개요
노로의 빠른 RSI 스위치 전략은 RSI 지표를 사용하여 과매매 기회를 식별하는 양적 거래 전략이다. 이 전략은 동시에 K선 형태와 일률적인 필터링 및 중지 방법을 결합하여 위험을 제어한다.
이 전략은 다음과 같은 몇 가지 핵심 요소에 기반합니다.
- 빠른 RSI 지표: 과매매 기회를 식별하는 데 사용됩니다
- K선 형태: K선 실체와 음양선을 결합하여 추세를 판단하는 보조
- 평균선 필터링: SMA 평균선을 사용하여 필터링하여 가짜 신호를 피합니다.
- 손해 차단 장치: RSI 경계 영역과 결합하여 손해 차단
전략 원칙
Noro의 빠른 RSI 전환 전략은 다음과 같은 구매/판매 신호를 결정합니다.
빠른 RSI 과잉 구매 과잉 판매 신호: 빠른 RSI가 상한을 넘어서거나 하한을 넘어서면 거래 신호가 발생한다.
K선 형태 신호: K선 개체 크기와 양양선 방향 등을 결합하여 트렌드를 판단하고, 빠른 RSI를 보조하는 신호를 생성한다.
평선 필터 신호: SMA 평선 방향과 결합하여 가짜 돌파구를 피한다.
정지 신호: 빠른 RSI가 상위 또는 하위 경계를 다시 통과하면 평행이 멈춥니다.
구체적으로, 이 전략은 빠른 RSI의 오버 바이 오버 소드 범위를 기반으로 거래 기회를 판단합니다. 빠른 RSI 아래에서 그 하위 경계를 통과하면, 오버 소드 신호로 간주되며, 빠른 RSI 위에서 그 상위 경계를 통과하면, 오버 바이 신호로 간주됩니다.
이 전략은 다음과 같은 보조 판단을 포함합니다.
- K선 엔터티 크기: K선 엔터티가 커질수록 트렌드가 더 뚜렷하다.
- 선양선: K선 트렌드 방향 판단
- SMA 평균선: 필터링 가짜 브레이크 신호
- 스톱 로드: 빠른 RSI가 제한된 영역을 통과할 때 스톱 로드
따라서, 이 전략은 빠른 RSI, K선 형태, 평균선 및 스톱로스를 결합하여 거래 결정을 수행합니다.
전략적 이점
이 전략에는 다음과 같은 장점이 있습니다.
- 급속한 RSI: 초고가 상승할 경우 초고가 상승할 경우 초고가 상승할 수 있습니다.
- K선과均線 보조 판단: 노이즈 거래를 피하라
- 자동 상쇄: 적시에 상쇄하여 위험을 통제할 수 있습니다.
- 단선 거래에 적합하다: 1시간, 30분 등과 같은 단선 주기에는 적합하다.
- 최적화 가능: 다양한 시장에 적합한 변수 조정
전략적 위험
이 전략에는 위험도 있습니다.
- 연속적인 손해가 발생할 수 있습니다. 진동 시에는 더 많은 손해 신호가 나타날 수 있습니다.
- 매개 변수 최적화 필요: 다른 주기 및 품종, 매개 변수 조정 필요
- 손실을 완전히 피할 수 없습니다: 적시에 중단하면 손실이 발생할 수 있습니다.
위험성을 줄이기 위해 다음과 같은 측면에서 최적화할 수 있습니다.
- 빠른 RSI 파라미터를 최적화하여 거래소 소음을 줄이십시오.
- 단편적 손실을 제어하기 위한 절감 포지션 최적화
- 자금 관리 모듈을 추가하고 위험을 분산합니다
전략 최적화 방향
이 전략은 다음과 같은 부분에서 최적화될 수 있습니다.
- 추가 중지 전략: 수익이 일정 수준에 도달하면 중지하여 수익의 일부를 잠금합니다.
- 자본 관리를 강화: 포지션 제어, 위험 분산 등의 관리 수단 추가
- 다른 주기 변수 최적화: 지표 변수를 조정하여 다른 주기의 효과를 테스트합니다.
- 더 많은 기계 학습: 알고리즘을 사용하여 변수를 자동으로 최적화하여 시장 변화에 적응
- 다양한 품종 테스트: 더 많은 품종에서 전략 강도를 테스트하는 방법
이 전략의 안정성을 크게 향상시킬 수 있는 방법은 스톱, 리스크 관리, 변수 최적화, 기계 학습 등의 방법을 통해 이 전략을 더욱 개선하는 것이다.
요약하다
전체적으로 노로의 빠른 RSI 전환 전략은 빠른 RSI 지표와 보조 K선 기술 지표를 결합하여 과매매 과매매에 대한 판단을 수행하는 단선 거래 전략을 구현합니다. 이 전략은 반응이 민첩하고 최적화 할 수 있으며 위험을 제어하기 위해 스톱 손실 모듈을 추가합니다. 더 많은 기계 학습과 변수 최적화를 통해 더 나은 전략 효과를 얻을 수 있습니다.
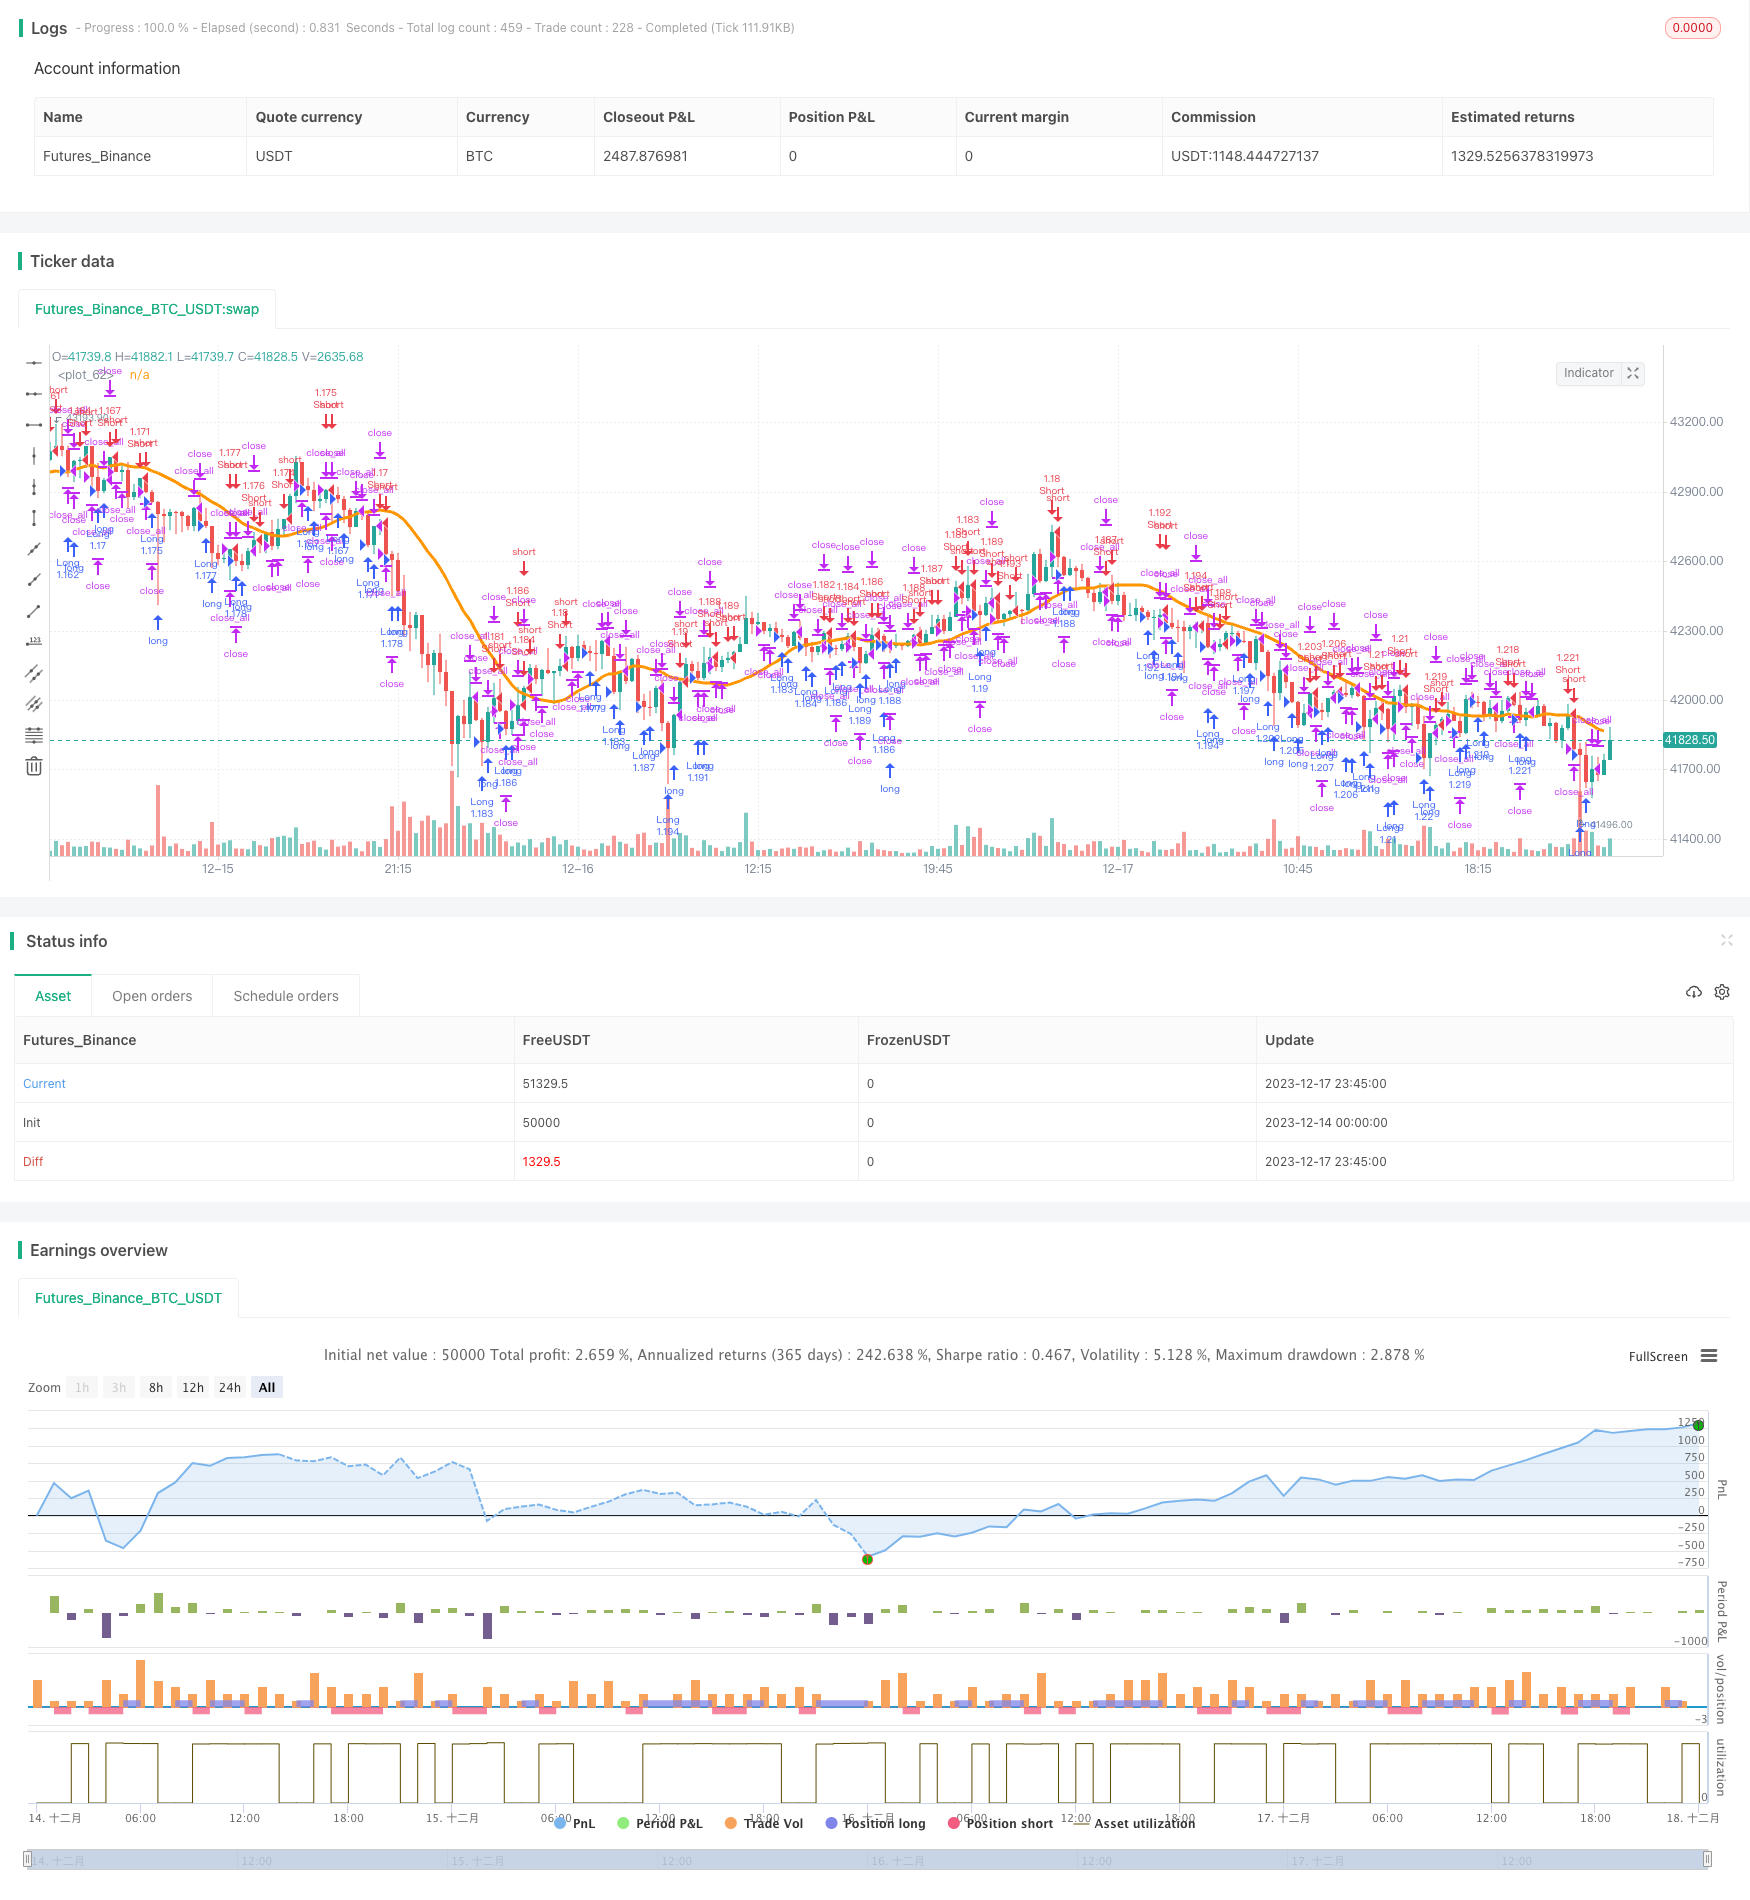
/*backtest
start: 2023-12-14 00:00:00
end: 2023-12-18 00:00:00
period: 15m
basePeriod: 5m
exchanges: [{"eid":"Futures_Binance","currency":"BTC_USDT"}]
*/

//Noro
//2018

//@version=2
strategy(title = "Noro's Fast RSI Strategy v1.7", shorttitle = "Fast RSI str 1.7", overlay = true)

//Settings
needlong = input(true, defval = true, title = "Long")
needshort = input(true, defval = true, title = "Short")
usemar = input(false, defval = false, title = "Use Martingale")
capital = input(100, defval = 100, minval = 1, maxval = 10000, title = "Capital, %")
usersi = input(true, defval = true, title = "Use Fast RSI Strategy")
usemm = input(true, defval = true, title = "Use Min/Max Strategy")
usebc = input(true, defval = true, title = "Use BarColor Strategy")
usesma = input(false, defval = false, title = "Use SMA Filter")
smaperiod = input(20, defval = 20, minval = 2, maxval = 1000, title = "SMA Filter Period")
fast = input(7, defval = 7, minval = 2, maxval = 50, title = "Fast RSI Period")
limit = input(30, defval = 30, minval = 1, maxval = 100, title = "RSI limit")
rsisrc = input(close, defval = close, title = "RSI Price")
rsibars = input(1, defval = 1, minval = 1, maxval = 20, title = "RSI Bars")
mmbars = input(1, defval = 1, minval = 1, maxval = 5, title = "Min/Max Bars")
showsma = input(false, defval = false, title = "Show SMA Filter")
showarr = input(false, defval = false, title = "Show Arrows")
fromyear = input(2018, defval = 2018, minval = 1900, maxval = 2100, title = "From Year")
toyear = input(2100, defval = 2100, minval = 1900, maxval = 2100, title = "To Year")
frommonth = input(01, defval = 01, minval = 01, maxval = 12, title = "From Month")
tomonth = input(12, defval = 12, minval = 01, maxval = 12, title = "To Month")
fromday = input(01, defval = 01, minval = 01, maxval = 31, title = "From day")
today = input(31, defval = 31, minval = 01, maxval = 31, title = "To day")

//Fast RSI
fastup = rma(max(change(rsisrc), 0), fast)
fastdown = rma(-min(change(rsisrc), 0), fast)
fastrsi = fastdown == 0 ? 100 : fastup == 0 ? 0 : 100 - (100 / (1 + fastup / fastdown))

//Limits
bar = close > open ? 1 : close < open ? -1 : 0
uplimit = 100 - limit
dnlimit = limit

//RSI Bars
upsignal = fastrsi > uplimit ? 1 : 0
dnsignal = fastrsi < dnlimit ? 1 : 0
uprsi = sma(upsignal, rsibars) == 1
dnrsi = sma(dnsignal, rsibars) == 1

//Body
body = abs(close - open)
abody = sma(body, 10)

//MinMax Bars
min = min(close, open)
max = max(close, open)
minsignal = min < min[1] and bar == -1 and bar[1] == -1 ? 1 : 0
maxsignal = max > max[1] and bar == 1 and bar[1] == 1 ? 1 : 0
mins = sma(minsignal, mmbars) == 1
maxs = sma(maxsignal, mmbars) == 1

//SMA Filter
sma = sma(close, smaperiod)
colorsma = showsma ? blue : na
plot(sma, color = colorsma, linewidth = 3)

//Signals
up1 = bar == -1 and (strategy.position_size == 0 or close < strategy.position_avg_price) and dnrsi and body > abody / 5 and usersi
dn1 = bar == 1 and (strategy.position_size == 0 or close > strategy.position_avg_price) and uprsi and body > abody / 5 and usersi
up2 = mins and (close > sma or usesma == false) and fastrsi < 70 and usemm
dn2 = maxs and (close < sma or usesma == false) and fastrsi > 30 and usemm
up3 = sma(bar, 2) == -1 and usebc
dn3 = sma(bar, 2) == 1 and usebc
exit = (((strategy.position_size > 0 and fastrsi > dnlimit and bar == 1) or (strategy.position_size < 0 and fastrsi < uplimit and bar == -1)) and body > abody / 2)

//Arrows
col = exit ? black : up1 or dn1 ? blue : up2 or dn2 ? red : na
needup = up1 or up2
needdn = dn1 or dn2
needexitup = exit and strategy.position_size < 0
needexitdn = exit and strategy.position_size > 0
plotarrow(showarr and needup ? 1 : na, colorup = blue, colordown = blue, transp = 0)
plotarrow(showarr and needdn ? -1 : na, colorup = blue, colordown = blue, transp = 0)
plotarrow(showarr and needexitup ? 1 : na, colorup = black, colordown = black, transp = 0)
plotarrow(showarr and needexitdn ? -1 : na, colorup = black, colordown = black, transp = 0)

//Trading
profit = exit ? ((strategy.position_size > 0 and close > strategy.position_avg_price) or (strategy.position_size < 0 and close < strategy.position_avg_price)) ? 1 : -1 : profit[1]
mult = usemar ? exit ? profit == -1 ? mult[1] * 2 : 1 : mult[1] : 1
lot = strategy.position_size == 0 ? strategy.equity / close * capital / 100 * mult : lot[1]

if up1 or up2 or up3
    if strategy.position_size < 0
        strategy.close_all()

    strategy.entry("Long", strategy.long, needlong == false ? 0 : lot)

if dn1 or dn2 or dn3
    if strategy.position_size > 0
        strategy.close_all()

    strategy.entry("Short", strategy.short, needshort == false ? 0 : lot)

if time > timestamp(toyear, tomonth, today, 23, 59) or exit
    strategy.close_all()