개요
이중 이동 평균의 교차를 구매 및 판매 신호로 사용하는 간단한 양자화 전략이다. 그것은 두 개의 다른 주기의 MA선을 사용하며, 짧은 주기의 MA선이 아래에서 긴 주기의 MA선을 통과할 때 구매 신호를 생성하고, 짧은 주기의 MA가 위에서 아래로 긴 주기의 MA를 통과할 때 판매 신호를 생성한다.
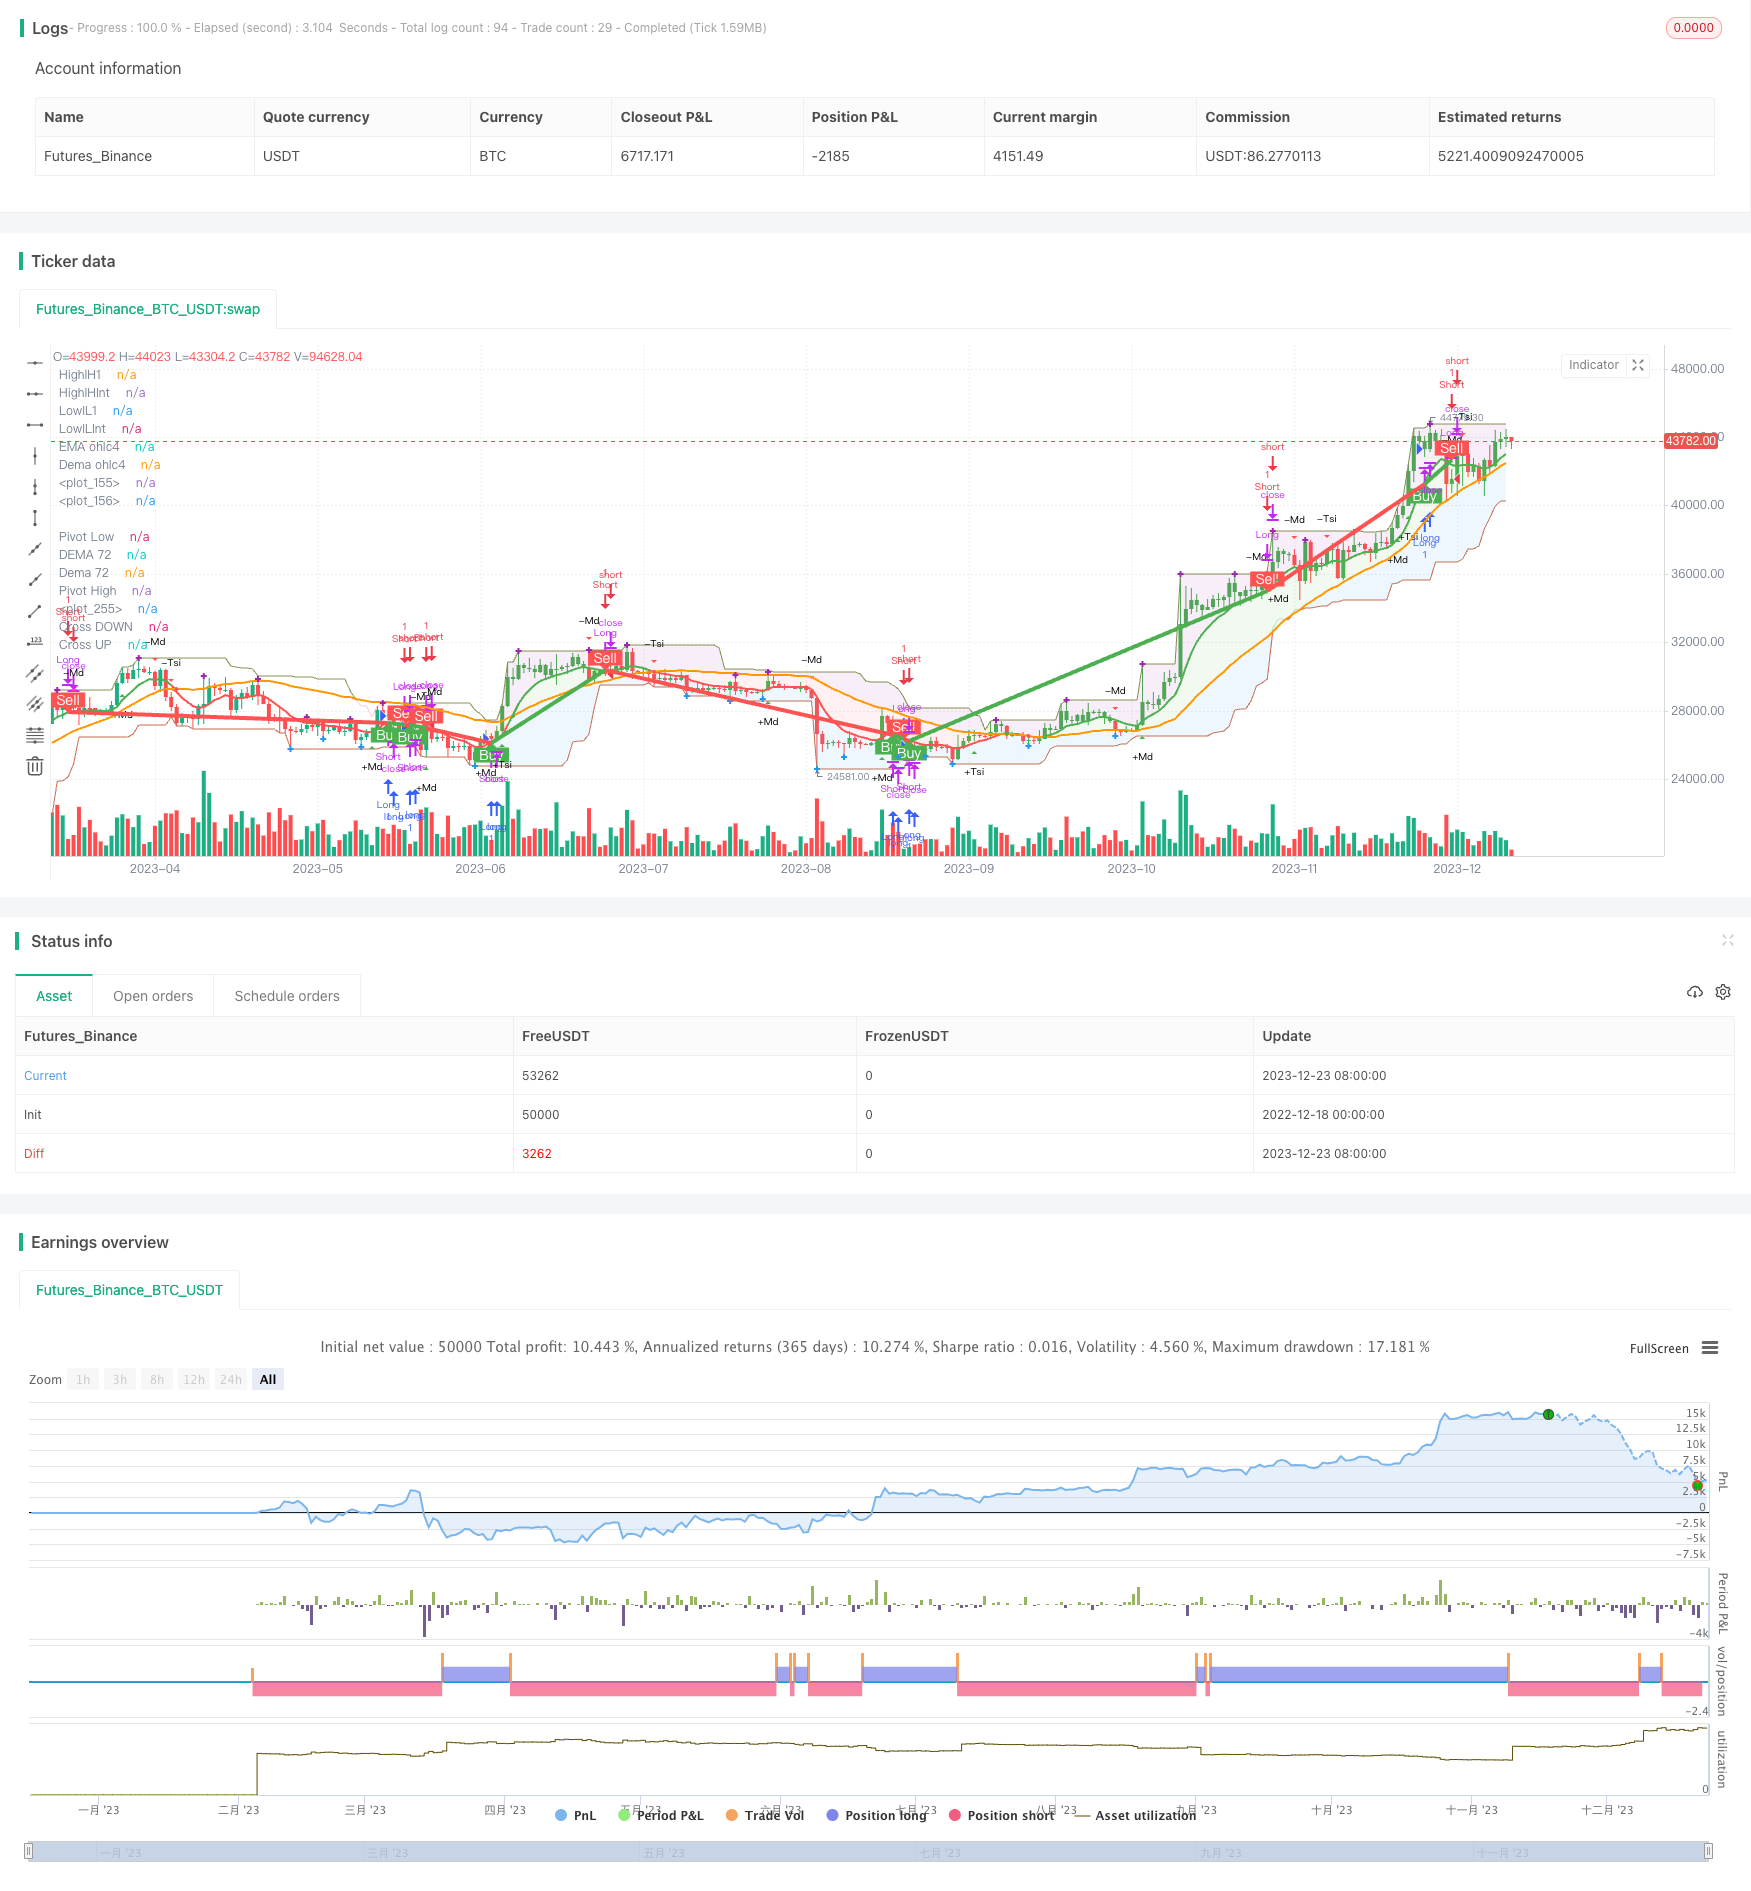
전략 원칙
이 전략은 8주기 EMA와 72주기 EMA를 계산하여 8주기 EMA와 72주기 EMA를 계산하여 차트에 그려집니다. 72주기 EMA를 8주기 EMA 위에 넘으면 구매 신호가 발생하고, 72주기 EMA를 8주기 EMA 아래에 넘으면 판매 신호가 발생합니다.
전략의 기본 가정은: 단기 MA 라인은 최근의 가격 추세와 동력을 나타내고, 장기 MA 라인은 장기 트렌드를 나타낸다. 짧은 MA에서 긴 MA를 통과하면, 단기 트렌드가 강해지고, 가격이 장기 평균선을 돌파하도록 유도하므로 구매할 수 있다. 짧은 MA 아래에서 긴 MA를 통과하면, 단기 상승이 끝났고, 장기 지지점이 돌파되어 판매를 고려해야 한다.
이 전략은 또한 윌리엄 %R 지표를 사용하여 과매매 지역을 판단하고, MACD 지표는 가격 운동 방향을 판단하여 거래 의사 결정에 참고합니다. 또한 전략에는 Dema, Pivots와 같은 보조 지표가 설정되어 있습니다.
우위 분석
이중 MA 교차 전략의 가장 큰 장점은 간단하고 이해하기 쉽고 실행하기 쉽다는 것입니다. 두 MA의 교차만으로 규칙에 따라 거래 신호를 생성 할 수 있으며 복잡한 모델과 변수 최적화가 필요하지 않습니다.
또 다른 장점은 MA 교차 전략이 트렌드형 시장에서 더 잘 작동한다는 것입니다. 주가가 명백한 상승 또는 하락 트렌드가있을 때 MA 교차 전략은 큰 트렌드를 포착하여 더 나은 수익을 얻을 수 있습니다.
위험 분석
이중 MA 교차 전략에는 주의해야 할 몇 가지 위험도 있습니다. 첫째, 축적 된 불안정한 시장에서 MA 선 교차가 자주 발생하여 잘못된 신호와 연쇄 손실이 발생할 수 있습니다. 둘째, MA 교차 신호는 종종 지연되어 갑작스러운 사건의 영향을 적시에 반영 할 수 없습니다. 마지막으로, MA 주기의 길이와 같은 파라미터 설정은 경험적으로 조정 판단이 필요합니다.
다른 지표와 결합하여 신호를 확인하거나, MA 매개 변수를 최적화하거나, 트렌드에서 명백한 시장 동작을 함으로써 위험을 줄일 수 있다. 또한, 스톱 로즈 스톱을 설정하고, 포지션 관리를 하는 등도 매우 중요하다.
최적화 방향
이 간단한 이중 MA 전략은 다음과 같은 몇 가지 측면에서 최적화 될 수 있습니다.
다른 MA 주기 변수의 조합을 테스트하여 최적의 변수를 찾습니다.
전략의 안정성을 높이기 위해 MACD, KDJ 등과 같은 다른 지표에 신호 필터링을 추가합니다.
고정된 값이 아닌 최적의 스톱 스팟을 추적하는 동적 탈퇴 메커니즘을 구축합니다.
시장 상황에 따라 적응하는 MA 주기, 최적화 매개 변수;
첨단 기계 학습과 딥 러닝 모델을 결합하여 예측을 수행하여 신호의 정확도를 향상시킵니다.
요약하다
이 전략은 간단한 쌍 MA 교차 전략으로, 약간의 지연성과 가짜 신호 문제가 있지만, 이해하기 쉽고 구현할 수 있다. 약간의 최적화 수정으로, 여전히 기본적이고 실용적인 양적 거래 전략이 될 수 있다.
/*backtest
start: 2022-12-18 00:00:00
end: 2023-12-24 00:00:00
period: 1d
basePeriod: 1h
exchanges: [{"eid":"Futures_Binance","currency":"BTC_USDT"}]
*/

// This source code is subject to the terms of the Mozilla Public License 2.0 at https://mozilla.org/MPL/2.0/
// © DalmarSantos
//@version=4
//Entry and Exit points to TRADE ==> Pontos de Entrada e Saida de TRADE
//Functions in use ==> Funções em uso
//(1) DEMA - Double Exponential Moving Average 08/17/34/72 ==> Média Móvel Exponencial Dupla
//(2) ema() - Exponential Moving Averge 72/ochl4 ==> Média Móvel Exponencial
//(3) plot()
//(4) barcolor()
//(5) cross()
//(6) pivots()
//(7) William R% Md
//(8) Maximum and Minimum Value
//(9) fill()
//(10) macd() - Moving Average Convergence Divergence
//(11) tsi() - Trading Strenght Indicator==> Índice de Força Real (IFR)
//(12) Buy and Sell TRADE Points
//(13) Strategy Buy and Sell TRADE Points
strategy("[DS]Entry_Exit_TRADE.V01-Strategy", overlay=true)
//variable ==> variáveis
return = input(title="Return Candels ?", type=input.integer, defval=190) //quantity of candles to analise ==> quantidade de candles para analise
//
//****************************
//Function==> Função | (1)DEMA
//****************************
//Dema 08
e1 = ema(close,8)
e2 = ema(e1,8)
dema08 = 2 * e1 - e2
//
//Dema 17
e1 := ema(close,17)
e2 := ema(e1,17)
dema17 = 2 * e1 - e2
//
//Dema 34
e1 := ema(close,34)
e2 := ema(e1,34)
dema34 = 2 * e1 - e2
//
//Dema 72
e1 := ema(close,72)
e2 := ema(e1,72)
dema72 = 2 * e1 - e2
//
//******************************
//Function==> Função | (2) ema()
//******************************
ema72 = ema(close,72)
emaOhlc4=ema(ohlc4,8)
//
//******************************
//Function==> Função | (3)plot()
//******************************
//
////Show the avareges ==> Apresenta as médias
//plot(dema17, title="DEMA 17", color=color.new(color.lime,0), linewidth=1, style=plot.style_line, transp=0, show_last=return) // Doble Exponential Moving Avarage 17
//plot(dema34, title="DEMA 34", color=color.new(color.black,0), linewidth=1, style=plot.style_line, transp=0, show_last=return) // Doble Exponential Moving Avarage 34

plot(dema72, title="DEMA 72", color=color.orange, linewidth=2, style=plot.style_line, transp=0, show_last=return) // Doble Exponential Moving Avarage 72
plot(emaOhlc4, title="EMA ohlc4", color=emaOhlc4>dema72 ? color.new(color.green,0) : color.new(color.red,0), linewidth=2, style=plot.style_line, transp=0, show_last=return) // Doble Exponential Moving Avarage 72
//
//***********************************
//Function==> Função | (4) barcolor()
//***********************************
//Show color TRADE bar if emaOhlc4>dema72 green (Buy) if not red (Red) ==> Mostra a cor da barra de TRADE se emaOhlc4>dema72 verde (Compra) se não vermelha (Venda)
barcolor(close>dema34 and close>dema72 or close>close[1]  ? color.new(color.green,0) : color.new(color.red,0), show_last=return)
//
//********************************
//Function==> Função | (5) cross()
//********************************
// Show the intersections crossing average on the graph ==> Apresenta no gráfico o local dos cruzamentos das médias
//UP ==> para CIMA
plot(crossover(emaOhlc4,dema72) ? dema72 : na, title="Cross UP", color=color.green, transp=0, style=plot.style_circles, linewidth=5, show_last=return)
//DOWM ==> para BAIXO
plot(crossunder(emaOhlc4,dema72) ? dema72 : na, title="Cross DOWN", color=color.red, transp=50, style=plot.style_circles, linewidth=5, show_last=return)
//
//********************************
//Function==> Função | (6) pivot()
//Reference: Pine Script Manual
//********************************
_Pivots	= input(title = "══════ Pivots ══════", type = input.bool, defval = false)
leftBars = input(4)
rightBars=input(4)
pivotHigh = pivothigh(leftBars, rightBars) //pivot de alta
plot(pivotHigh>ema72[rightBars] ? pivotHigh : na, title="Pivot High", style=plot.style_cross, linewidth=3, color= color.purple, transp=50, offset=-rightBars, show_last=return)
pivotLow = pivotlow(leftBars, rightBars) //pivot de baixa
plot(pivotLow<ema72[rightBars] ? pivotLow : na, title="Pivot Low", style=plot.style_cross, linewidth=3, color= color.blue, transp=50, offset=-rightBars, show_last=return)
//
//***************************************
//Function==> Função | (7) WILLIAM R% MOD
//Reference: Pine Script Manual
//***************************************
// Getting inputs
_WilliamR	= input(title = "══════ William R% Mod ══════", type = input.bool, defval = false)
SOB_William = input(title="OverBought Area", type=input.integer, defval=-7) //OverBought area ==> Area de SobreCompra
SOS_William = input(title="OverSold Area", type=input.integer, defval=-93) //OverSold area ==> Area de SobreVenda
length_William = input(17, minval=1) //interval ==> intervalo
highestHigh_William = highest(length_William) //maximum value ==> valor máximo
highestLow_William = lowest(length_William) //minumum value ==> valor mínimo
R_William = (highestHigh_William - close) / (highestHigh_William - highestLow_William) * -100
//Show the position ==> mostra a posição
//plotshape(R_William > SOS_William ? na : high, text="+R%", title="+r(+)%R Up", location=location.belowbar, color=color.green, transp=30, style=shape.triangleup, size=size.tiny, show_last=return)
//plotshape(R_William < SOB_William ? na : low, text="-R%", title="(-)%R DN", location=location.abovebar, color=color.red, transp=30, style=shape.triangledown, size=size.tiny, show_last=return)
//
// Show label with William %R value ==> Mostra a etiqueta com o valor do William %R
// The color label red is when the value arrive on OverBought Area and green on OverSold Area, be careful with these areas ==> O rótulo de cor vermelha é quando o valor chega na área de SobreCompra e verde na área de SobreVenda, cuidado com estas áreas
//
corTest=color.white
colorText = color.white
estilo = label.style_label_upper_left
textW=""
if R_William>SOB_William
    corTest := color.new(color.red,0) //vermelho escuro
    estilo := label.style_label_lower_left
    textW:="OB"

if R_William>-30 and R_William<=SOB_William
    corTest := #f5948e //vermelho intermediário
    estilo := label.style_label_lower_left

if R_William>-50 and R_William<=-30
    corTest := #f5d5d3 //vermelho claro
    colorText := color.black

if R_William>-70 and R_William<=-50
    corTest := #e7f5d3 //verde claro
    colorText := color.black

if R_William>=SOS_William and R_William<=-70
    corTest := color.lime //verde intermediario
    estilo := label.style_label_upper_left
    colorText := color.black

if R_William<SOS_William
    corTest := color.new(color.green,0) // verde escuro
    estilo := label.style_label_upper_left
    textW:="OS"
// Make a label at the high of the current bar
myLabel = label.new(x=bar_index, y=close, style= estilo, color=corTest, text=tostring(R_William,"#.#")+"% "+textW, textcolor=colorText, size=size.normal)
// Get the label text
labelText = label.get_text(id=myLabel)
// Then set the label's text to a new string that
// includes its current text
label.set_text(id=myLabel, text=labelText)
label.delete(myLabel[1])
//
//**************************************************
//Function==> Função | (8) MAXIMUM AND MINIMUM VALUE
//Reference: Pine Script Manual
//**************************************************
//Maximum High and Minimum Low close position ==> Posição Máxima e Minima de fechamento
ExtremoHigh=high+(highestHigh_William-high)
ExtremoLow=low-(low-highestLow_William)
plot(ExtremoHigh, color=color.new(color.red,70), style=plot.style_line, linewidth=1, show_last=return)
plot(ExtremoLow, color=color.new(color.green,70), style=plot.style_line, linewidth=1, show_last=return)
//Show the Extreme High and Low close position ==> Mostra a extrema posicao alta e baixa do fechamento
lH1 = 0.0
lHInt = close
lL1 = close
lLInt = close
Vr_LinhaH=0.0
Vr_LinhaL=0.0
Vr_LinhaC=0.0
if emaOhlc4<dema72
    Vr_LinhaH := high+(highestHigh_William-high)
    lH1 := Vr_LinhaH>dema72 ?  Vr_LinhaH : dema72
    lHInt:=emaOhlc4<dema72 ? dema72 : emaOhlc4
    lLInt := lHInt==emaOhlc4 ? dema72 : emaOhlc4
    Vr_LinhaL:= low-(low-highestLow_William)
    lL1 := Vr_LinhaL>lLInt ?  lLInt : Vr_LinhaL

if emaOhlc4>dema72
    Vr_LinhaH := high+(highestHigh_William-high)
    lH1 := Vr_LinhaH>dema72 ?  Vr_LinhaH : dema72
    lHInt:=dema72>emaOhlc4 ? dema72 : emaOhlc4
    lLInt := lHInt==dema72 ? emaOhlc4 : dema72
    Vr_LinhaL:= low-(low-highestLow_William)
    lL1 := Vr_LinhaL>lLInt ?  lLInt : Vr_LinhaL
//
//*******************************
//Function==> Função | (9) fill()
//Reference: Pine Script Manual
//*******************************
//Show TRADE area in red (Sell) and green (Buy) ==> Mostra a área de trade em vermelho (Venda) e verde (Compra)
Line1 = plot(emaOhlc4, title="Dema ohlc4", color=color.new(color.white,100), linewidth=1, transp=0, show_last=return)
Line2 = plot(dema72,  title="Dema 72", color=color.new(color.white,100), linewidth=1,transp=0, show_last=return)
fill(Line1, Line2, color=emaOhlc4>dema72 ? color.new(color.green,90) : color.new(color.red,90), transp=70, show_last=return)

//High area ==> Area de alta
HighlH1 = plot(lH1, title="HighlH1", color=color.green, linewidth=1, transp=90, show_last=return, style=plot.style_linebr)
HighlHInt = plot(lHInt, title="HighlHInt", color=color.green, linewidth=1, transp=100, show_last=return, style=plot.style_linebr)
fill(HighlH1, HighlHInt, color=color.new(color.purple,90),  transp=0, show_last=return)

//Low area ==> Area de baixa
LowlL1 = plot(lL1, title="LowlL1", color=color.red, linewidth=1, transp=90, show_last=return, style=plot.style_linebr)
LowlLInt = plot(lLInt, title="LowlLInt", color=color.red, linewidth=1, transp=100, show_last=return, style=plot.style_linebr)
fill(LowlL1, LowlLInt, color=color.new(color.blue,90),  transp=0, show_last=return)
//
//***************************************************************************
//Function==> Função | (10) macd() - Moving Average Convergence Divergence
//Reference: Pine Script Manual - adapted TradingView version - Dalmar Santos
//***************************************************************************
// Getting inputs
_Macd	= input(title = "═════ Macd ══════════", type = input.bool, defval = false)
fast_length_Macd = input(title="Fast Length", type=input.integer, defval=12)
slow_length_Macd = input(title="Slow Length", type=input.integer, defval=26)
src_Macd = input(title="Source", type=input.source, defval=close)
signal_length_Macd = input(title="Signal Smoothing", type=input.integer, minval = 1, maxval = 50, defval = 9)
// Calculating
fast_ma_Macd = ema(src_Macd, fast_length_Macd)
slow_ma_Macd = ema(src_Macd, slow_length_Macd)
macd_Macd = fast_ma_Macd - slow_ma_Macd
signal_Macd = ema(macd_Macd, signal_length_Macd)
hist_Macd = macd_Macd - signal_Macd
//cross Macd
MacdUp = crossover(macd_Macd,signal_Macd) ? 1 : 0
MacdDown = crossunder (macd_Macd,signal_Macd) ? 1 : 0
plotshape(MacdUp, text="+Md", title="(+)MACD UP", location=location.belowbar, color=color.green, transp=30, style=shape.triangleup, size=size.tiny, show_last=return)
plotshape(MacdDown, text="-Md", title="(-)MACD DN", location=location.abovebar, color=color.red, transp=30, style=shape.triangledown, size=size.tiny, show_last=return)
//
//*****************************************************************************************
//Function==> Função | (11) tsi() - Trading Strenght Indicator ==> Indice de Força do Trading
//Reference: Pine Script Manual - adapted TradingView version - Dalmar Santos
//*****************************************************************************************
_Tsi	= input(title = "═════ Tsi ══════════", type = input.bool, defval = false)
long_tsi = input(title="Long Length", type=input.integer, defval=72)
short_tsi = input(title="Short Length", type=input.integer, defval=17)
signal_tsi = input(title="Signal Length", type=input.integer, defval=17)
price_tsi = close
double_smooth(src_tsi, long_tsi, short_tsi) =>
	fist_smooth_tsi = ema(src_tsi, long_tsi)
	ema(fist_smooth_tsi, short_tsi)
pc_tsi = change(price_tsi)
double_smoothed_pc_tsi = double_smooth(pc_tsi, long_tsi, short_tsi)
double_smoothed_abs_pc_tsi = double_smooth(abs(pc_tsi), long_tsi, short_tsi)
tsi_value_tsi = 100 * (double_smoothed_pc_tsi / double_smoothed_abs_pc_tsi)
//TSI signal ==> Signal do TSI
TsiUp = crossover(tsi_value_tsi,ema(tsi_value_tsi, signal_tsi)) ? 1 : 0
TsiDown = crossunder(tsi_value_tsi,ema(tsi_value_tsi, signal_tsi)) ? 1 : 0
//Show the Position ==> Mostra a posicao
plotshape(TsiUp==1 ? low : na, text="+Tsi", title="(+)TSI Up", location=location.belowbar, color=color.green, transp=30, style=shape.triangleup, size=size.tiny, show_last=return)
plotshape(TsiDown==1 ? high : na, text="-Tsi", title="(-)TSI DN", location=location.abovebar, color=color.red, transp=30, style=shape.triangledown, size=size.tiny, show_last=return)
//
//***************************************************************************
//Function==> Função | (12) Buy and Sell TRADE Points
//Reference: Pine Script Manual - adapted TradingView version - Dalmar Santos
//***************************************************************************
//Cross Point ==> pontos de cruzamento
crossUP=crossover(emaOhlc4,dema34)
crossDN=crossunder(emaOhlc4,dema34)
//Show de Buy and Sell points ==> mostra pontos de compra e venda
tradeColor=crossUP ? color.red : crossDN ? color.green : na
//line buy or sell ==> linha de compra ou venda
plot(crossUP ? dema34 : crossDN ? dema34: na, color=tradeColor, style=plot.style_line, linewidth=4, editable=false, show_last=return)
//Buy point ==> pontos de compra
plotshape(crossUP ? dema34 : na, style=shape.labelup, location=location.absolute, text="Buy", transp=0, textcolor = color.white, color=color.green, editable=false, show_last=return)
//Sell points ==> pontos de venda
plotshape(crossDN ? dema34: na, style=shape.labeldown, location=location.absolute, text="Sell", transp=0, textcolor = color.white, color=color.red, editable=false, show_last=return)
//
//************************************************************
//Function==> Função | (13) Strategy Buy and Sell TRADE Points
//Reference: Pine Script Manual - Dalmar Santos
//************************************************************
//Start backtest year, month, day, hour, minute, second ==> Inicio do backtest ano, mês, dia, hora, minuto, segundo
start = timestamp(2021,01,01,1,00,00)
//*****************
//BUY ==> COMPRA
//*****************
if time>= start
    if crossUP
        strategy.close("Short", comment="Close Sell")
        strategy.entry("Long", strategy.long, 1, comment="Open Buy")

//*****************
//SELL ==> Venda
//*****************
    if crossDN
        strategy.close("Long", comment="Close Buy")
        strategy.entry("Short", strategy.short, 1, comment="Open Sell")