개요
이 전략은 동력 지표를 사용하여 단기 가격 변화를 추적하고 시장 추세 방향을 판단하고 구매 및 판매 작업을 수행한다. 전략의 이름은 Price Volume Trend Strategy라고 불리며, 가격 변화와 거래량 변화의 추세를 판단하는 전략을 사용하는 것을 반영한다.
전략 원칙
이 전략은 우선 가격의 움직임을 계산한다. 현재 주기 가격과 이전 주기 가격의 차이를 계산함으로써 최신의 주기 내의 가격의 절대적인 변화를 반영할 수 있다. 긍정적 값은 가격 상승을 나타내고, 부정적인 값은 가격 하락을 나타낸다. 그리고는 이 차이의 이동 평균을 계산하고, 미세한 파동 처리를 하여 평균 운동량 지표를 얻는다.
최신 가격이 평균 동력보다 크면 가격이 상승하고 있음을 나타냅니다. 최신 가격이 평균 동력보다 작으면 가격이 하락하고 있음을 나타냅니다. 이 지표에 따라 가격 추세 방향을 판단합니다. 합성 거래량이 확대된 필터를 결합하여 실제 거래에서 거래량이 큰 신호만 선택합니다.
가격 상승과 하락의 추세에 따라 구매 및 판매를 수행합니다.
우위 분석
- 트렌드를 재빨리 판단하고, 단기 가격 변화를 빠르게 포착하는 전략, 단선 운영에 적합하다.
- 트랜스포메이션 필터링을 통해 가짜 돌파구에 대한 오해를 피하십시오.
- 이 작업의 논리적인 의미는
- 적극적인 투자자에게 적합한 높은 거래 빈도
위험 분석
- 시장의 비정상적인 변동에 민감하며, 잘못된 신호의 위험이 있습니다.
- 거래의 빈번함으로 인한 슬라이드 위험
- 중·장기 추세를 놓칠 수도 있고, 장기적인 수익성은 검증될 수 있다.
최적화 방향
- 운동량 지표 변수를 조정하여 판단 효과를 최적화
- 전송량 필터링 매개 변수를 최적화하여 신호 품질을 향상시킵니다.
- 단편적 손실을 통제하기 위한 손해 방지 제도를 강화하는 것
- 더 많은 요소의 판단과 함께 다중 요소의 동력을 보장합니다.
요약하다
이 전략overall은 동력 지표를 통해 가격의 단기 변화 경향을 추적하여 구매 및 판매 시기를 신속하게 판단한다. 장점은 신속하게 작동하여 하락을 잡는 것이다. 단점은 신호 품질과 장기 수익성을 고려해야 한다. 매개 변수 조정, 풍력 제어 메커니즘을 강화함으로써 이 전략은 고주파 전략의 중요한 구성 요소가 될 수 있으며, 다른 저주파 전략과 함께 사용된다.
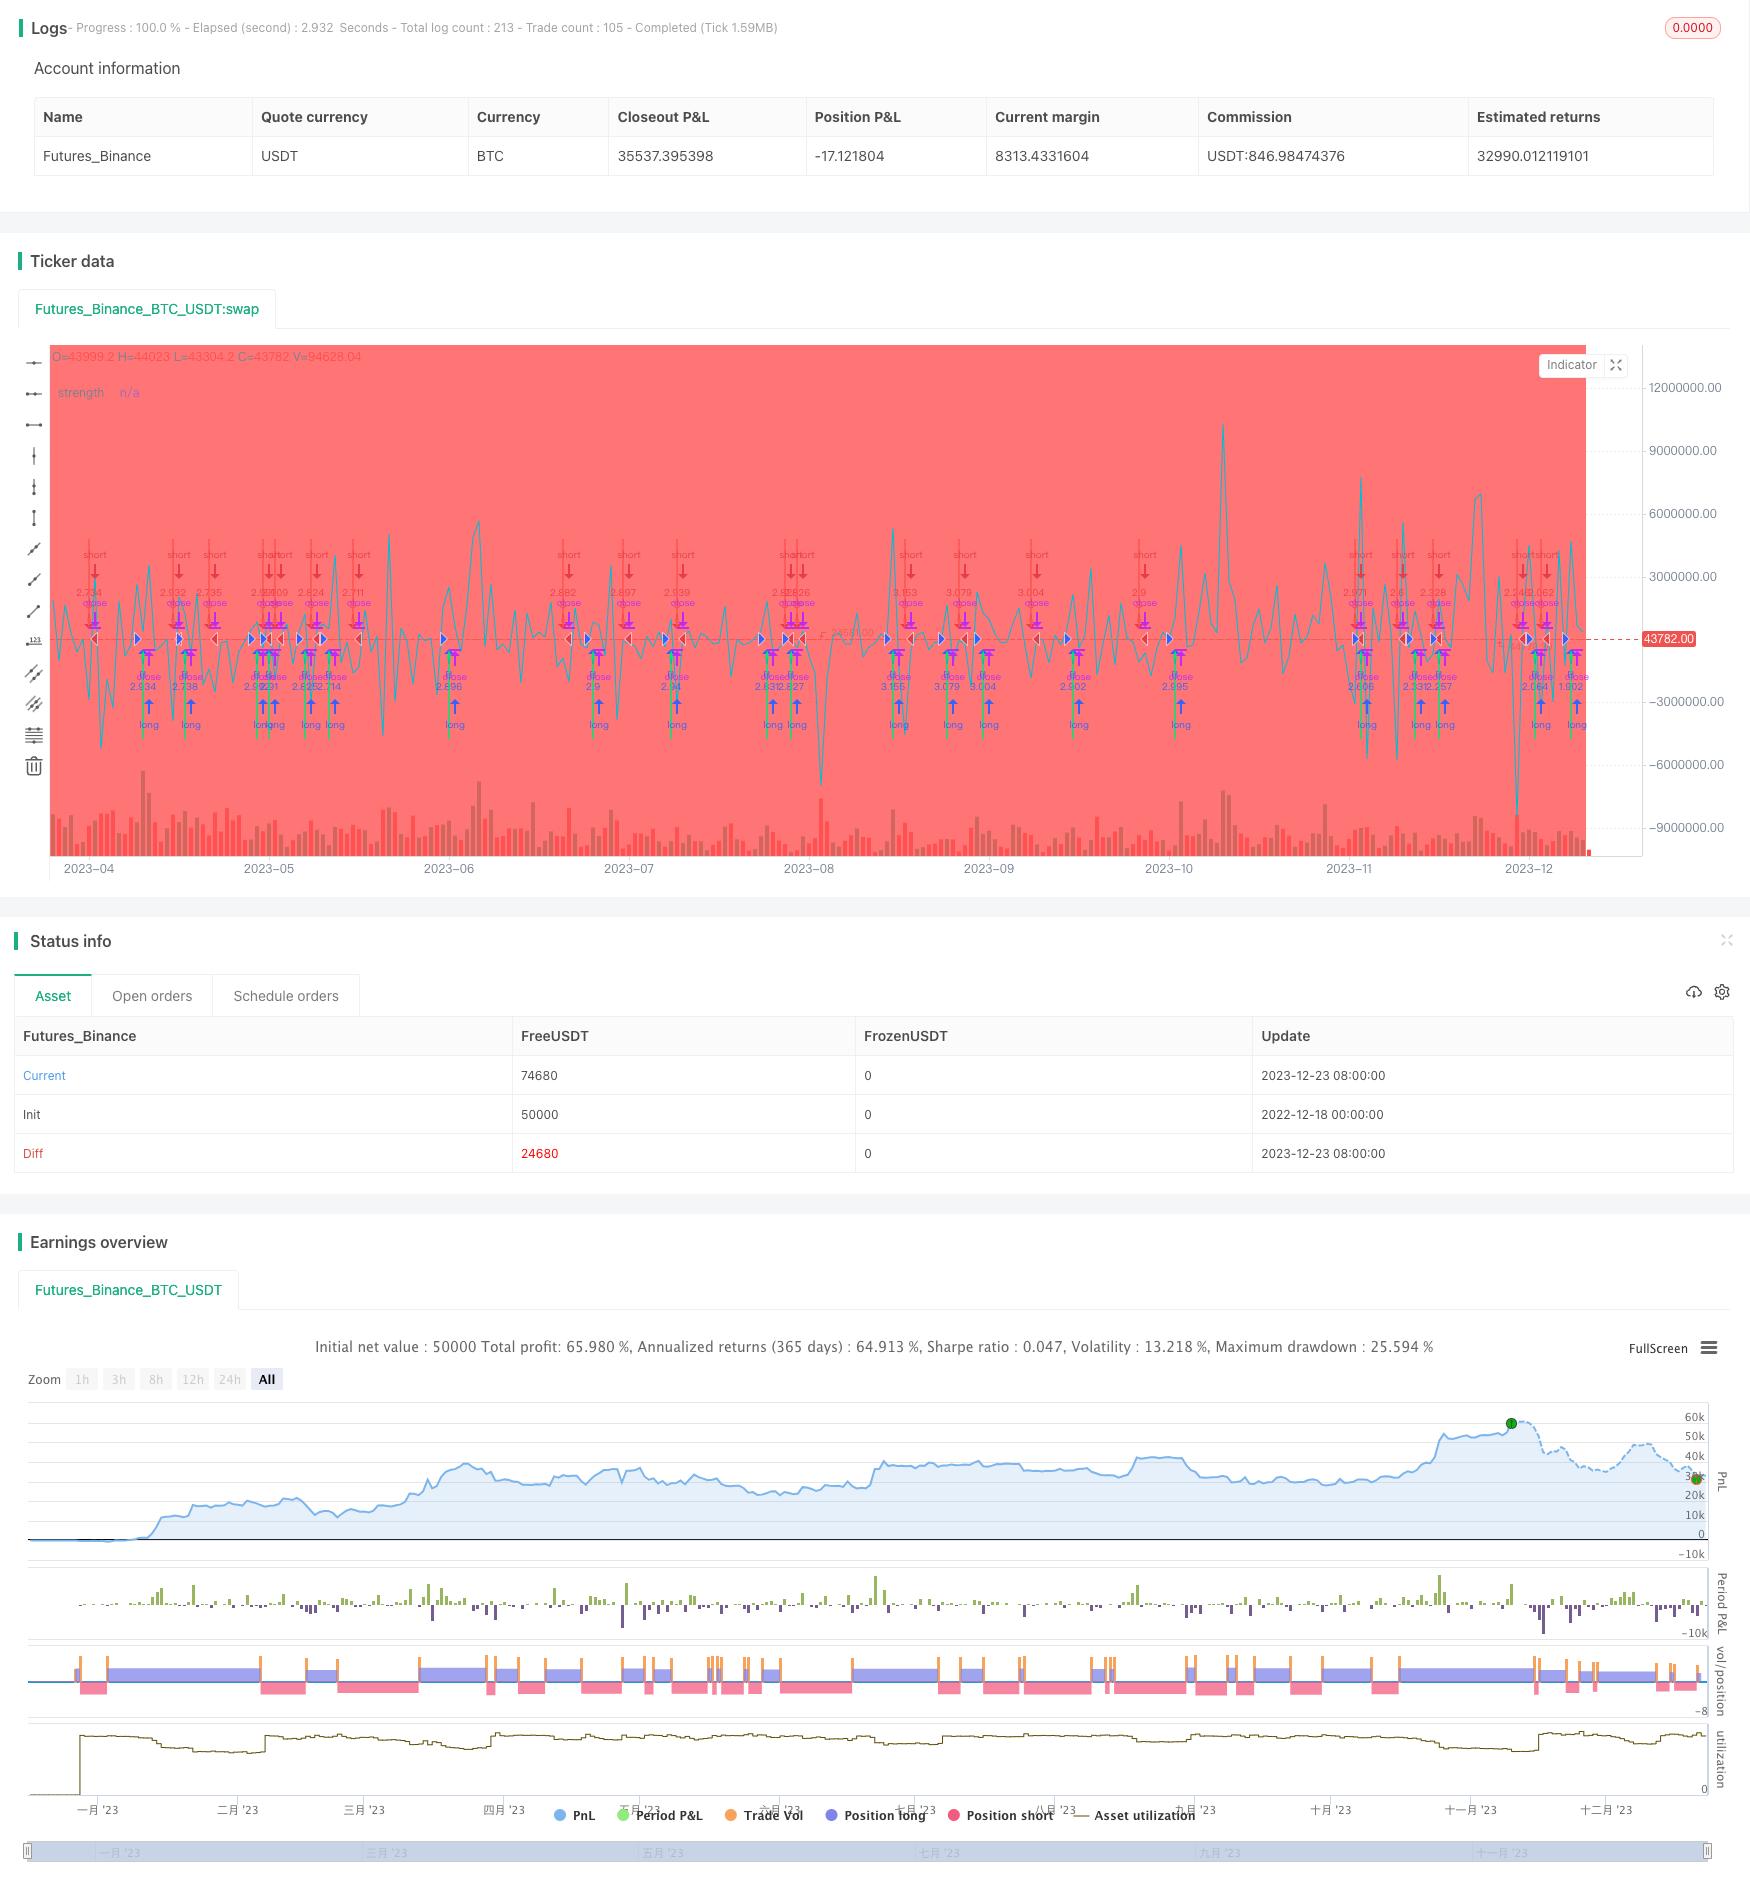
전략 소스 코드
/*backtest
start: 2022-12-18 00:00:00
end: 2023-12-24 00:00:00
period: 1d
basePeriod: 1h
exchanges: [{"eid":"Futures_Binance","currency":"BTC_USDT"}]
*/

// This source code is subject to the terms of the Mozilla Public License 2.0 at https://mozilla.org/MPL/2.0/
// © russtic

//@version=2

strategy("HA smoothed eliminator v2  ",pyramiding=1, slippage=10, default_qty_type=strategy.percent_of_equity,
     commission_type=strategy.commission.percent, commission_value=0.075, overlay=true,
     default_qty_value=100, initial_capital=1000)

FromMonth1 = input(defval=1, title="From Month", minval=1, maxval=12)
FromDay1 = input(defval=1, title="From Day", minval=1, maxval=31)
FromYear1 = input(defval=2019, title="From Year", minval=2010)
ToMonth1 = input(defval=12, title="To Month", minval=1, maxval=12)
ToDay1 = input(defval=31, title="To Day", minval=1, maxval=31)
ToYear1 = input(defval=2020, title="To Year", minval=2010)
start1 = timestamp(FromYear1, FromMonth1, FromDay1, 00, 00)
finish1 = timestamp(ToYear1, ToMonth1, ToDay1, 23, 59)
window1() => true

t1 = time(timeframe.period, "0300-1200")
t2 = time(timeframe.period, "0930-1700")
London = na(t1) ? na : green
NY = na(t2) ? na : red

bgcolor(London, title="London")
bgcolor(NY, title="New York")
///////////////////////////
// HA smoothed

len=(1 )
o=ema(open,len)
c=ema(close,len)
h=ema(high,len)
l=ema(low,len)

haclose = (o+h+l+c)/4
haopen = na(haopen[1]) ? (o + c)/2 : (haopen[1] + haclose[1]) / 2
hahigh = max (h, max(haopen,haclose))
halow = min (l, min(haopen,haclose))

len2=(len)
o2=ema(haopen, len2)
c2=ema(haclose, len2)
h2=ema(hahigh, len2)
l2=ema(halow, len2)

buy= (o2<c2)

closebuy= (o2>c2)

sell= (o2>c2)

closesell= (o2<c2)

//
/// END NEW SCRIPT

//
//
//                  MERGE SCRIPTS
a1= o2<c2
b1=o2>c2
is_uptrend = (a1)// and (p> 0)
is_downtrend =  (b1)// and (p <0)
barcolor(b1 ? red: a1 ? lime : blue)

//end


// =========================start     PVT -GIVES EACH BAR A VALUE
facton = (true)//, title="arrow elimination (factor) on ")
Length1 = 2//input(2, title="PVT Length", minval=1)

xPrice = close//input(title="Source", type=source, defval=close)
xsma = wma(xPrice, Length1)
nRes = xPrice - xsma
pos = iff(nRes > 0, 1,
	     iff(nRes < 0, -1, nz(pos[1], 0)))
forex= input(true, title = 'strength toggle ')
forexyes = (forex == true)? 10000 : (forex == false)? 1: na

plot(nRes*forexyes , color=aqua, title="strength", transp=100)
// =========================         end pvt
//
//=============================     start factor // ELIMINATES  weak signals
//                  start trend
//
factor = input(600.00, title = "strength elimination")
factor1 = factor - (factor*2)//input(-100.00, title = "sell strength elimination ")
facton1 = (facton == true) and is_uptrend == 1 and nRes*forexyes>factor ? 1 : (facton == true) and is_downtrend == 1 and nRes*forexyes<factor1 ? -1 : (facton == false)
// ==================== =====
//
//===========================    end factor
nRestrend = (nRes*forexyes)
//=========================== plot arrows
plot1 = iff(is_uptrend[1] == 1, 0 , 1)
plot2 = iff(is_downtrend[1]  == 1, 0 , 1)
uparrowcond =  is_downtrend ? false : nz(uparrowcond[1], false) == true ? uparrowcond[1] : (facton1 and is_uptrend and nRes*forexyes>factor)
downarrowcond =  is_uptrend ? false : nz(downarrowcond[1], false) == true ? downarrowcond[1] : (facton1 and is_downtrend and nRes*forexyes<factor1)
//prevarrowstate = uparrowcond  ? 1 : downarrowcond ? -1 : nz(prevarrowstate[1], 0)


candledir = (open < close)? 1: (open>close)? -1 : na // ONLY OPENS ON SAME BAR DIRECTION AS SIGNAL


up=nz(uparrowcond[1], false) == false and ( is_uptrend and nRes*forexyes>factor) and candledir ? 1:na
dn=nz(downarrowcond[1], false) == false and ( is_downtrend and nRes*forexyes<factor1) and candledir? -1:na


sig=0
if up==1
    sig:=1
else
    if dn==-1
        sig:=-1
    else
        sig:=sig[1]
plotarrow(sig[1]!=1 and sig==1?1:na, title="BUY ARROW", colorup=lime, maxheight=80, minheight=50, transp=0)// up arrow
plotarrow(sig[1]!=-1 and sig==-1?-1:na, title="SELL ARROW", colordown=red, maxheight=80, minheight=50, transp=0)// down arrow

//========================= alert condition
alertcondition(sig[1]!=1 and sig==1?1:na, title="BUY eliminator", message="BUY " )
alertcondition(sig[1]!=-1 and sig==-1?-1:na, title="SELL eliminator",  message="SELL ")


strategy.entry("B", true, when=(sig[1]!=1 and sig==1?1:na) and window1())
strategy.entry("S", false,when=(sig[1]!=-1 and sig==-1?-1:na) and window1())