개요
이중 이동 평균 반전 전략 (Dual Moving Average Reversal Strategy) 은 이중 이동 평균을 사용하여 단기 및 장기 동향을 식별하는 정량 거래 전략이다. 이 전략은 10일 간소 이동 평균과 200일 간소 이동 평균을 결합하여 장기 파동의 큰 동향 아래에서 단기 반전 구매 기회를 포착한다. 이 전략에는 또한 약간의 트렌드 추적 및 손실 제어 장치가 있습니다.
전략 원칙
이중 이동 평균 역전 전략은 주로 다음과 같은 가정에 기반합니다.
200일 간소 이동 평균은 시장의 장기적인 경향 방향을 식별할 수 있다. 가격이 200일선 이상일 때, 대장치가 장기적인 부진적 경향에 있음을 나타낸다.
10일 간단한 이동 평균은 시장의 단기 회전을 식별할 수 있다. 가격이 10일 라인 아래로 떨어지면 단기간에 회전이 나타난다.
장기적 인 수면 추세에서, 어떤 단기적 인 회전은 낮은 흡수 기회로 간주 될 수 있으며, 효율적으로 잡을 수 있습니다.
위의 가정에 기초하여, 이 전략의 거래 신호 생성 논리는 다음과 같습니다.
종식 가격 상단 200 일선을 통과하고 동시에 10 일선을 통과하면, 장기 동향을 나타내고, 단기 회귀가 발생하여 구매 신호를 생성한다.
포지션을 보유할 때, 만약 종식 가격이 10일선을 다시 통과하여 단기 경향의 반전을 나타낸다면, 즉시 상실을 중단해야 한다. 또한, 주식 가격이 크게 하락하여 손실이 미리 설정된 스톱로스 라인에 도달하면, 또한 적극적으로 상실을 중단한다.
대시장 전체에 큰 폭의 하락이 있을 때, 낮은 흡수 기회로, 미리 설정된 하락한치값을 통해 구매 시기를 판단할 수 있다.
이런 디자인을 통해, 황소 시장의 장기적 인 큰 추세에서, 효과적으로 낮은 흡수 추적을 할 수 있으며, 위험을 제어하기 위해 손실을 설정할 수 있다.
전략적 이점
이중 이동 평균 반전 전략은 다음과 같은 장점이 있다:
- 전략은 명확하고 간단하며 이해하기 쉽고 실행이 가능합니다.
- 이중 이동 평균 필터를 사용하여 대장과 개별 주식의 장기 단기 추세를 효과적으로 식별 할 수 있습니다.
- 더 나은 시간 효율성. 단기 반향을 포착함으로써 더 높은 자금 사용 효율을 얻을 수 있다.
- 내장된 손해 중지 메커니즘으로, 개별 포지션의 손실을 잘 제어할 수 있다.
- 대장 지수와 인기 개인 주식에 적용할 수 있다.
전략적 위험
이중 이동 평균 반전 전략의 장점은 분명하지만, 다음과 같은 위험도 있습니다.
- 대盘가 장기 수립에 있을 때, 잘못된 신호가 발생하기 쉬우므로, 전략의 성과에 영향을 미칩니다. 이 시점에는 전략을 일시 중지하고, 명확한 추세가 다시 활성화될 때까지 기다려야 합니다.
- 이동 평균을 기반으로 트렌드를 판단하고 신호를 생성하는 것은 다른 유효한 특성을 놓칠 수 있습니다. 조합 최적화를 위해 더 많은 지표를 도입하는 것을 고려할 수 있습니다.
- 단 하나의 손해 차단 방법은 너무 딱딱할 수 있으며, 다른 유형의 손해 차단 장치를 테스트할 수 있다.
- 정책 매개 변수는 서로 다른 기준에 맞게 조정 및 최적화가 필요하며, 그렇지 않으면 안정성에 영향을 미칩니다.
전략 최적화 방향
이중 이동 평균 반전 전략에는 다음과 같은 최적화 방향이 있습니다.
- 다양한 길이의 이동 평균 조합을 테스트하여 최적의 변수를 찾습니다.
- 다른 보조 지표를 추가하여 더 안정적인 신호를 형성한다. 예를 들어, 거래량, 진동 지표 등이다.
- 다양한 유형의 스톱을 테스트합니다. 예를 들어, 추적 스톱, 시간 스톱.
- 구매 및 중지 변수를 최적화하여 변화하는 시장 상황에 적응할 수 있도록 한다.
- 기계 학습 알고리즘을 추가하여 더 많은 역사 데이터를 사용하여 파라미터를 최적화하십시오.
요약하다
이중 이동 평균 역전 전략은 전체적으로 매우 실용적인 양적 전략이다. 그것은 이동 평균의 장점을 활용하여 긴 선의 다중 헤드 상황에서 낮은 흡수 및 손실을 수행하여 높은 단일 회전 수익을 얻는다. 동시에 그것은 약간의 대장 인식 능력과 위험 제어를 가지고 있다. 지속적인 테스트 및 최적화로 전략의 성과가 더 우수할 것으로 믿습니다.
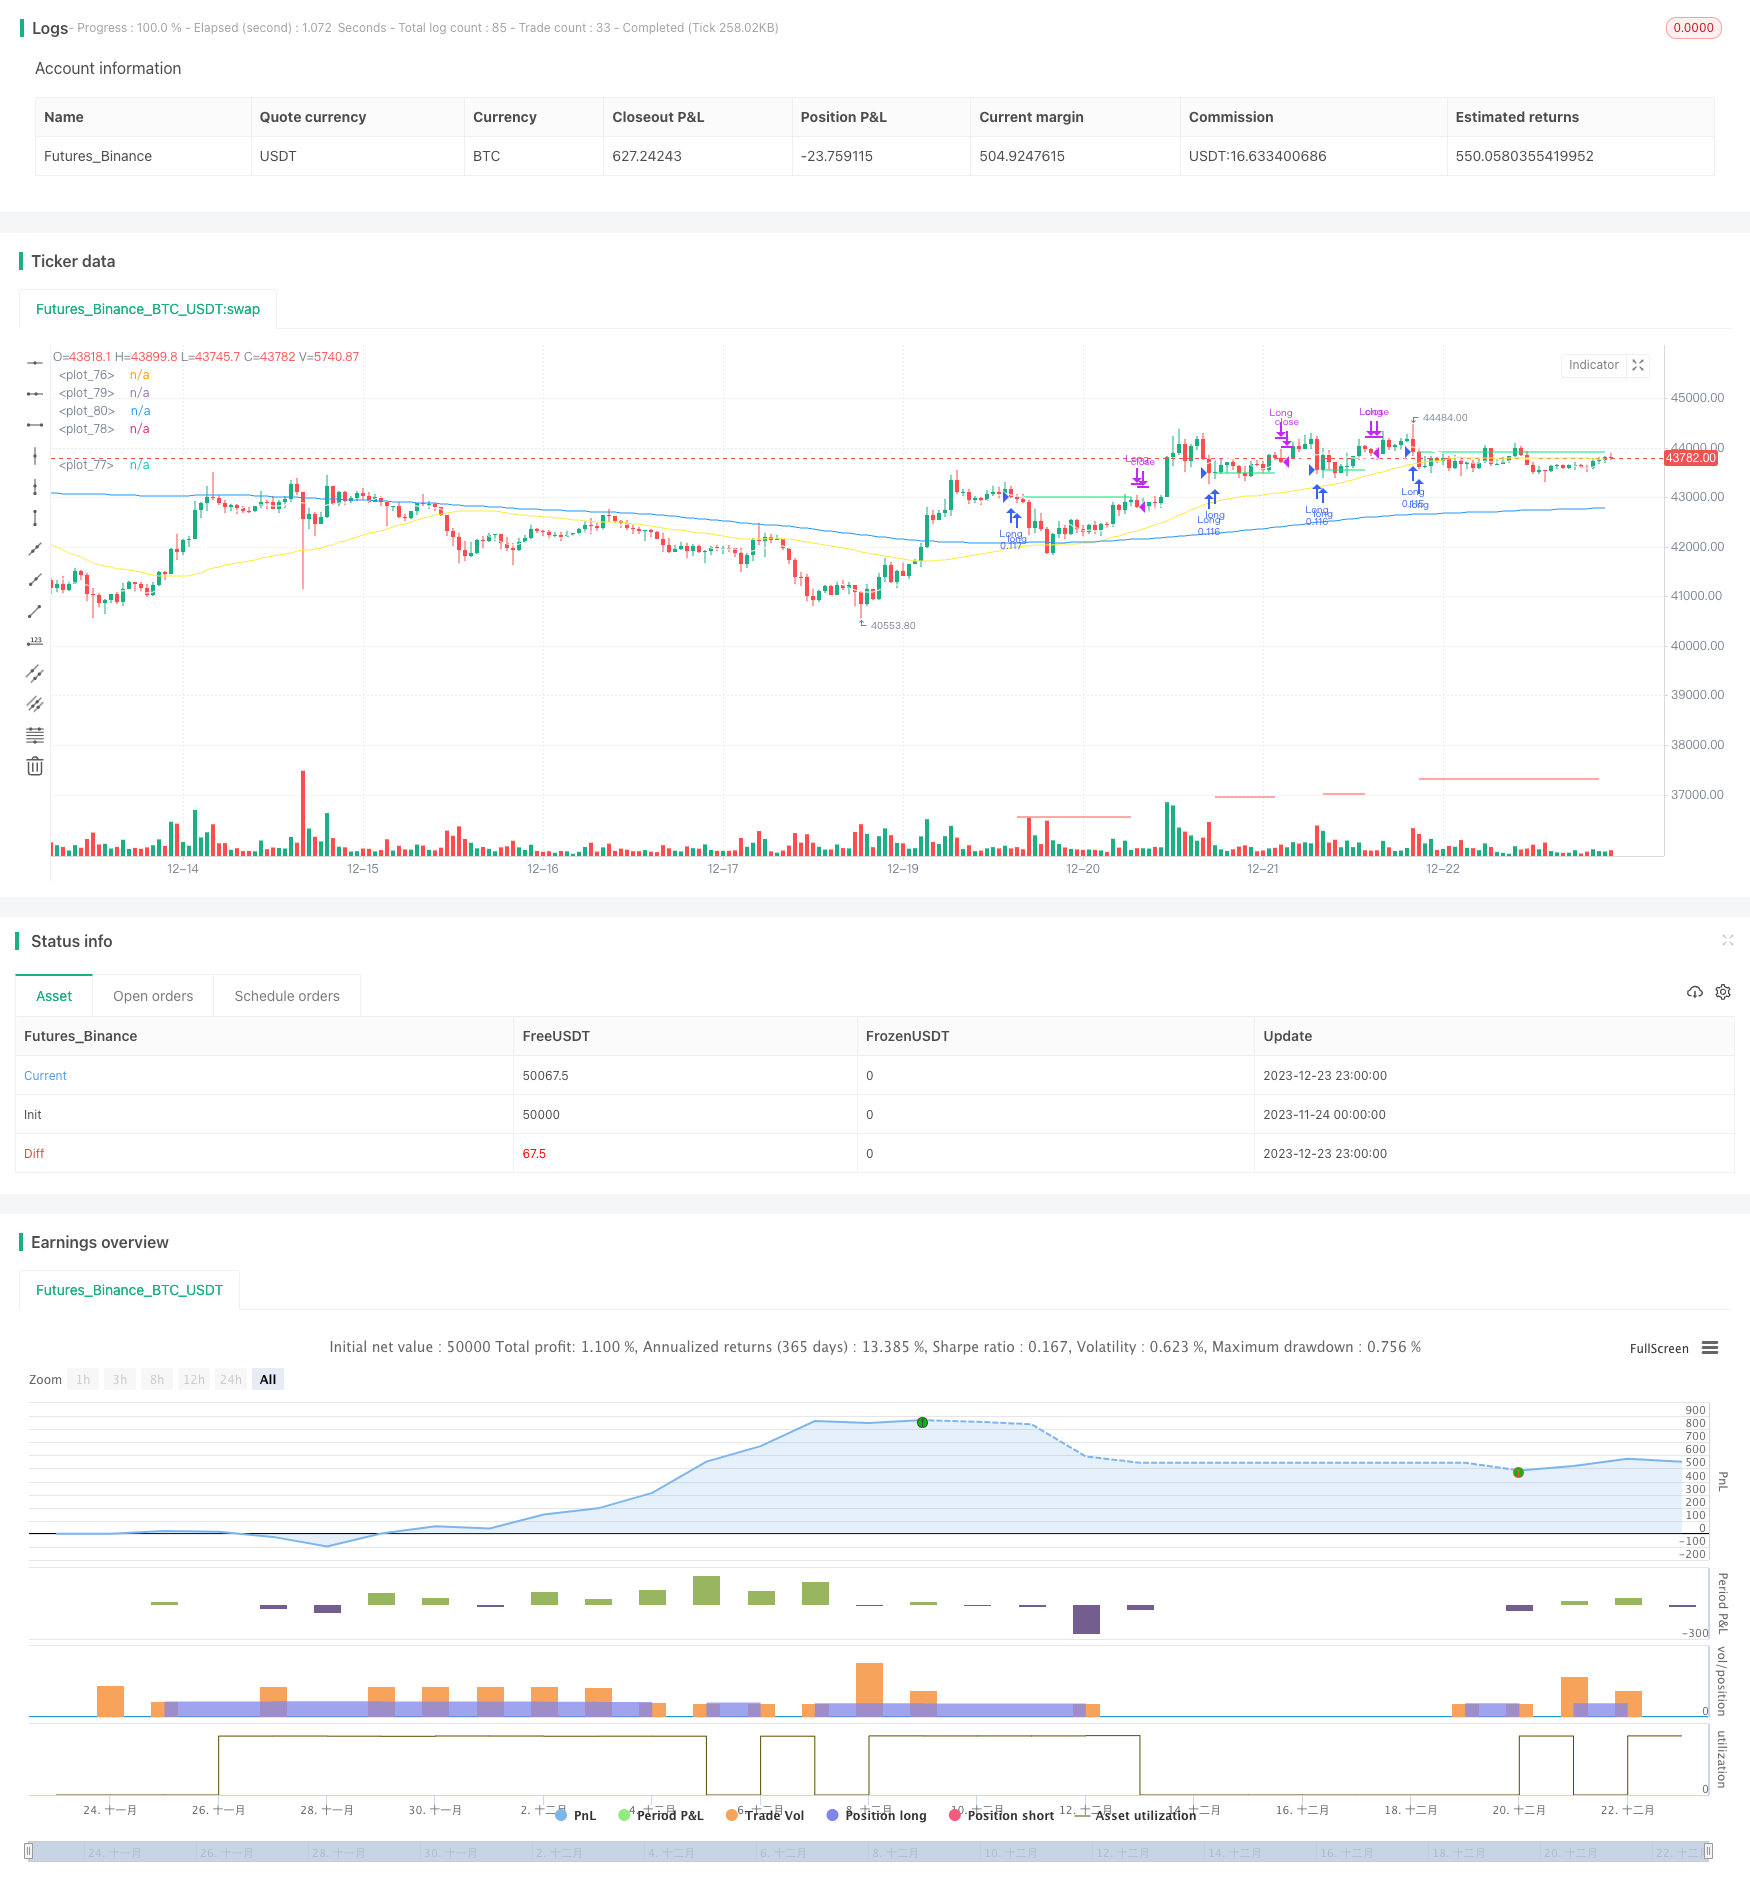
/*backtest
start: 2023-11-24 00:00:00
end: 2023-12-24 00:00:00
period: 1h
basePeriod: 15m
exchanges: [{"eid":"Futures_Binance","currency":"BTC_USDT"}]
*/

// This source code is subject to the terms of the Mozilla Public License 2.0 at https://mozilla.org/MPL/2.0/
// © Gold_D_Roger
//note: spreading 1 statement over multiple lines needs 1 apce + 1 tab | multi line function is 1 tab
//Recommended tickers: SPY (D), QQQ (D) and big indexes, AAPL (4H)

//@version=5
strategy("Davin's 10/200MA Pullback on SPY Strategy v2.0",
     overlay=true,
     initial_capital=10000,
     default_qty_type=strategy.percent_of_equity,
     default_qty_value=10, // 10% of equity on each trade
     commission_type=strategy.commission.cash_per_contract,
     commission_value=0.1) //Insert your broker's rate, IB is 0.005USD or tiered

//Best parameters
// SPY D
// Stop loss 0.15
// commission of 0.005 USD using Interactive brokers
// Exit on lower close
// Buy more when x% down --> 14%
// DO NOT include stop condition using MA crossover

// Get User Input
i_ma1           = input.int(title="MA Length 1", defval=200, step=10, group="Strategy Parameters", tooltip="Long-term MA 200")
i_ma2           = input.int(title="MA Length 2", defval=10, step=10, group="Strategy Parameters", tooltip="Short-term MA 10")
i_ma3           = input.int(title="MA Length 3", defval=50, step=1, group="Strategy Parameters", tooltip="MA for crossover signals`")
i_stopPercent   = input.float(title="Stop Loss Percent", defval=0.15, step=0.01, group="Strategy Parameters", tooltip="Hard stop loss of 10%")
i_startTime     = input(title="Start filter", defval=timestamp("01 Jan 2013 13:30 +0000"), group="Time filter", tooltip="Start date and time to begin")
i_endTime       = input(title="End filter", defval=timestamp("01 Jan 2099 19:30 +0000"), group="Time filter", tooltip="End date and time to stop")
i_lowerClose    = input.bool(title="Exit on lower close", defval=true, group="Strategy Parameters", tooltip="Wait for lower close after above 10SMA before exiting") // optimise exit strat, boolean type creates tickbox type inputs
i_contrarianBuyTheDip = input.bool(title="Buy whenever more than x% drawdown", defval=true, group="Strategy Parameters", tooltip="Buy the dip! Whenever x% or more drawdown on SPY")
i_contrarianTrigger = input.int(title="Trigger % drop to buy the dip", defval=14, step=1, group="Strategy Parameters", tooltip="% drop to trigger contrarian Buy the Dip!")
//14% to be best for SPY 1D
//20% best for AMZN 1D
i_stopByCrossover_MA2_3 = input.bool(title="Include stop condition using MA crossover", defval=false, group="Strategy Parameters", tooltip="Sell when crossover of MA2/1 happens")

// Get indicator values
ma1 = ta.sma(close,i_ma1) //param 1
ma2 = ta.sma(close,i_ma2) //param 2
ma3 = ta.sma(close,i_ma3) //param 3
ma_9 = ta.ema(close,9) //param 2
ma_20 = ta.ema(close,20) //param 3

// Check filter(s)
f_dateFilter = true //make sure date entries are within acceptable range

// Highest price of the prev 52 days: https://www.tradingcode.net/tradingview/largest-maximum-value/#:~:text=()%20versus%20ta.-,highest(),max()%20and%20ta.
highest52 = ta.highest(high,52)
overall_change = ((highest52 - close[0]) / highest52) * 100

// Check buy/sell conditions
var float buyPrice = 0 //intialise buyPrice, this will change when we enter a trade ; float = decimal number data type 0.0
buyCondition  = (close > ma1 and close < ma2 and strategy.position_size == 0 and f_dateFilter) or (strategy.position_size == 0 and i_contrarianBuyTheDip==true and overall_change > i_contrarianTrigger and f_dateFilter) // higher than 200sma, lower than short term ma (pullback) + avoid pyramiding positions
sellCondition = close > ma2 and strategy.position_size > 0 and (not i_lowerClose or close < low[1])  //check if we already in trade + close above 10MA;
// third condition: EITHER i_lowerClose not turned on OR closing price has to be < previous candle's LOW [1]

stopDistance  = strategy.position_size > 0 ? ((buyPrice - close)/close) : na // check if in trade > calc % drop dist from entry, if not na
stopPrice     = strategy.position_size > 0 ? (buyPrice - (buyPrice * i_stopPercent)) : na // calc SL price if in trade, if not, na
stopCondition = (strategy.position_size > 0 and stopDistance > i_stopPercent) or (strategy.position_size > 0 and (i_stopByCrossover_MA2_3==true and ma3 < ma1))


// Enter positions
if buyCondition
    strategy.entry(id="Long", direction=strategy.long) //long only


if buyCondition[1] // if buyCondition is true prev candle
    buyPrice := open // entry price = current bar opening price

// Exit position
if sellCondition or stopCondition
    strategy.close(id="Long", comment = "Exit" + (stopCondition ? "Stop loss=true" : "")) // if condition? "Value for true" : "value for false"
    buyPrice := na //reset buyPrice

// Plot
plot(buyPrice, color=color.lime, style=plot.style_linebr)
plot(stopPrice, color=color.red, style=plot.style_linebr, offset = -1)
plot(ma1, color=color.blue) //defval=200
plot(ma2, color=color.white) //defval=10
plot(ma3, color=color.yellow) // defval=50