개요
이 전략은 볼 강带, 이동 평균 및 거래량 분석에 기반하여 안정적인 트렌드 추적 전략을 구현한다. 이 전략은 잠재적인 트렌드 반전을 포착하고 시장 동력을 활용하는 것을 목표로 한다.
전략 원칙
보르 강철 테이프
보르 강철 테이프를 사용하여 시장의 과매매 상태를 식별한다. 상하의 명확한 시각화 보조 의사 결정.
보르 강철의 기본 원리는 일정 주기 내의 주가 평균과 표준 차이를 기준으로 상하 궤도를 계산하는 것이다. 주가 상하 궤도를 타는 것은 과매매 신호이며, 하하 궤도를 타는 것은 과매매 신호이다.
이동 평균 필터
이동 평균 필터를 구현하여 트렌드 식별을 강화한다. 사용자는 간단한 이동 평균, 지수 이동 평균 및 가중 이동 평균과 같은 다른 유형의 이동 평균을 선택할 수 있다.
가격이 이동 평균을 넘어서서 아래로 넘어가면 구매 신호가 발생한다.
거래량 분석
사용자가 거래량 분석을 전략에 통합하여 신호 확인을 할 수 있습니다. 다른 색의 양 기둥은 거래량이 평균보다 높거나 낮다는 것을 나타냅니다.
거래량이 평균을 돌파하는 것은 가격 신호를 확인하는 데 사용될 수 있다.
우위 분석
트렌드 추적 전략
볼 강철, 이동 평균 및 거래량에 기반한 시장 추세가 역전되었다.
가격 동향을 파악하고 동향을 따라 수익을 올릴 수 있다.
유연성과 맞춤화
사용자는 볼 강철의 파라미터, 이동 평균의 종류 및 길이를 선택하여 최적화할 수 있다.
장고와 빈仓位는 별도로 제어할 수 있다.
시각화 및 확인
이중 신호 메커니즘, 이동 평균과 거래량으로 볼 강철의 가격 신호를 확인한다.
이동 평균, 스톱 손실 라인 등의 거래 신호를 직관적으로 표시합니다.
위험 관리
ATR을 기반으로 스톱로스 레벨을 계산한다. ATR 주기 및 스톱로스 ATR 배수를 사용자 정의할 수 있다.
포지션 규모는 포지션 리스크의 비율에 따라 조정한다. 단일 손실을 효과적으로 제어한다.
위험 분석
회전 주기의 위험
- 다른 역사주기는 전략의 성능에 영향을 미칠 수 있다. 전략의 안정성을 보장하기 위해 다른 주기 내에서 재검토를 해야 한다.
추세 반전 위험
- 흔들리는 상황에서 자주 스톱로드를 트리거한다. 이동 평균 파라미터를 최적화함으로써 이 위험을 줄일 수 있다.
오버 최적화 위험
- 다중 변수 최적화는 과도한 최적화로 이어질 수 있으며, 다중 변수 조합을 사용하여 안정성 검사를 수행해야 한다.
기술 지표 지연 위험
- 지표 계산에는 일정 지연이 존재하며, 가격 주체 판단과 결합하여 지표에 전적으로 의존할 수 없다.
최적화 방향
변수 최적화
- 볼 강철 줄기 매개 변수, 이동 평균 유형 및 ATR 매개 변수를 다양한 품종과 주기에 맞게 최적화한다.
포지션 최적화
- 다양한 포지션 리스크 비율 수준을 테스트하고, 스톱 로스 배수를 최적화한다.
신호 최적화
- 테스트는 KD, MACD 등과 같은 다른 보조 지표 필터링 신호를 추가합니다.
코드 최적화
- 신호 판단 논리를 최적화하고, 불필요한 포지션을 줄인다. 객체지향 프로그래밍을 적용하여 확장성을 향상시킨다.
요약하다
이 전략은 볼 강철띠, 이동 평균 및 거래량 분석을 통합하여 트렌드를 추적하는 기계 거래 시스템을 구축한다. 전략의 장점은 신호 확인 메커니즘이 강력하고 위험이 통제되어 있다는 것이다. 후속으로 매개 변수 및 신호 최적화를 통해 전략의 안정성과 수익성을 향상시킬 수 있다. 이 전략은 투자자가 유행을 따라가는 방법론을 참조할 수 있다.
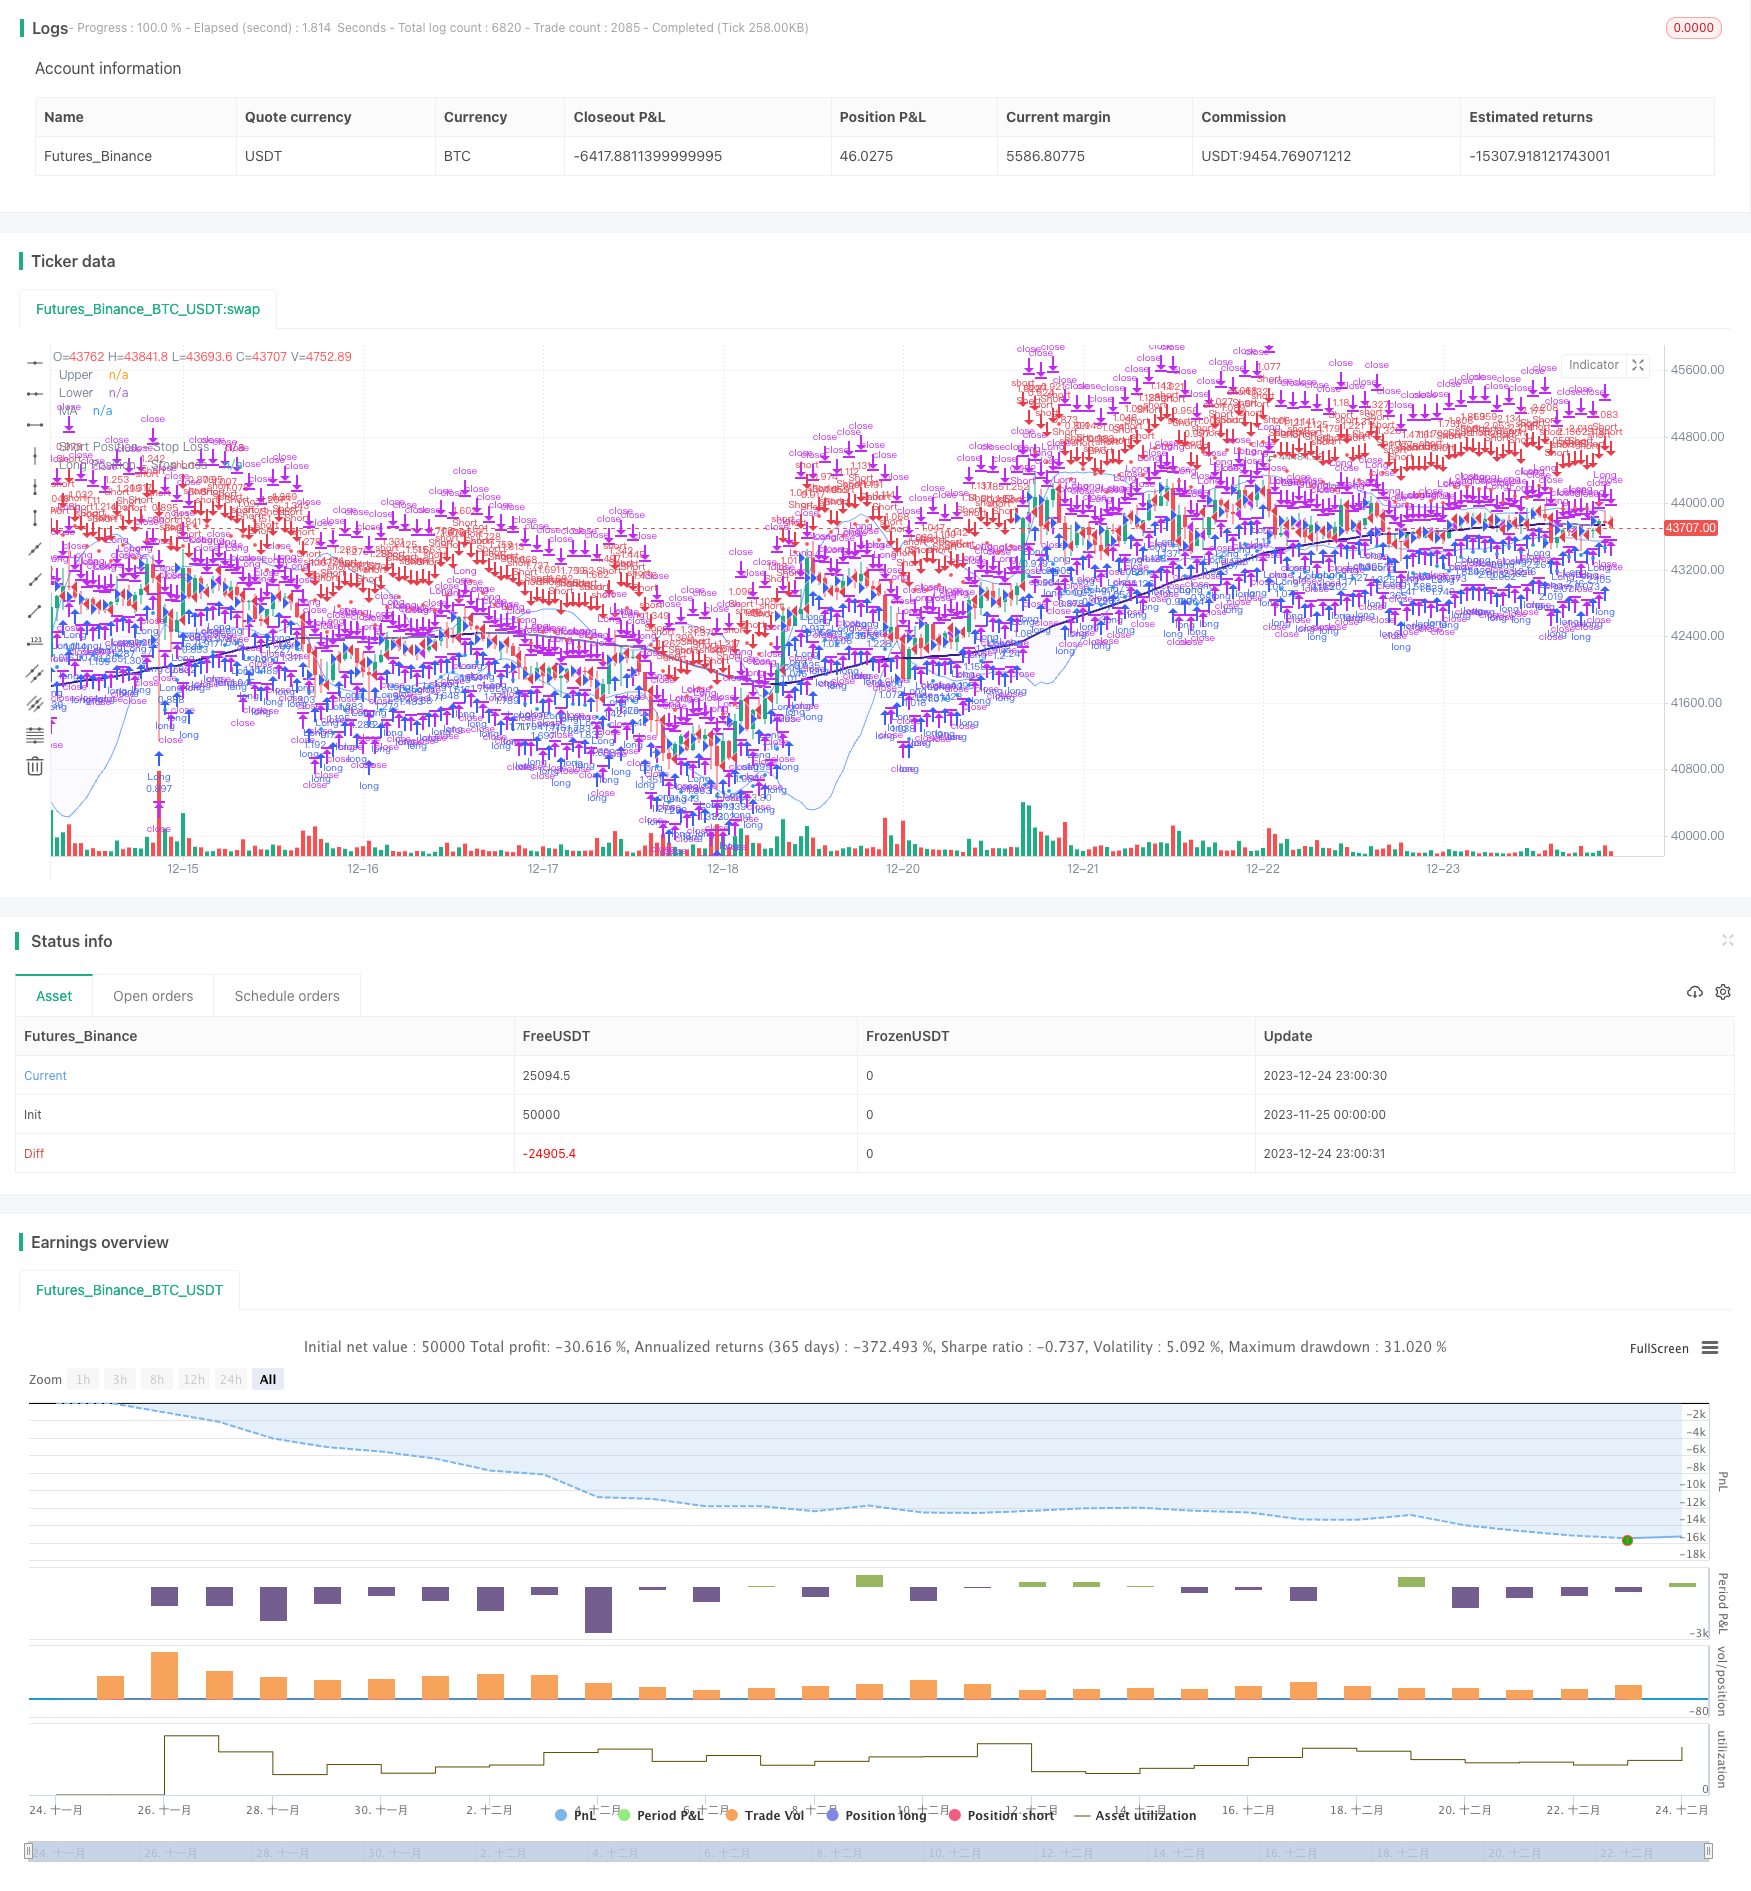
/*backtest
start: 2023-11-25 00:00:00
end: 2023-12-25 00:00:00
period: 1h
basePeriod: 15m
exchanges: [{"eid":"Futures_Binance","currency":"BTC_USDT"}]
*/

// This source code is subject to the terms of the Mozilla Public License 2.0 at https://mozilla.org/MPL/2.0/
// © sosacur01

//@version=5
strategy(title="Bollinger Band | Trend Following", overlay=true, pyramiding=1, commission_type=strategy.commission.percent, commission_value=0.2, initial_capital=10000)

//--------------------------------------

//BACKTEST RANGE
useDateFilter = input.bool(true, title="Filter Date Range of Backtest",
     group="Backtest Time Period")
backtestStartDate = input(timestamp("1 jan 2017"),
     title="Start Date", group="Backtest Time Period",
     tooltip="This start date is in the time zone of the exchange " +
     "where the chart's instrument trades. It doesn't use the time " +
     "zone of the chart or of your computer.")
backtestEndDate = input(timestamp("1 jul 2100"),
     title="End Date", group="Backtest Time Period",
     tooltip="This end date is in the time zone of the exchange " +
     "where the chart's instrument trades. It doesn't use the time " +
     "zone of the chart or of your computer.")
inTradeWindow = true
if not inTradeWindow and inTradeWindow[1]
    strategy.cancel_all()
    strategy.close_all(comment="Date Range Exit")

//--------------------------------------

//LONG/SHORT POSITION ON/OFF INPUT
LongPositions   = input.bool(title='On/Off Long Postion', defval=true, group="Long & Short Position")
ShortPositions  = input.bool(title='On/Off Short Postion', defval=true, group="Long & Short Position")

//--------------------------------------
//MA INPUTS
averageType1    = input.string(defval="WMA", group="MA", title="MA Type", options=["SMA", "EMA", "WMA", "HMA", "RMA", "SWMA", "ALMA", "VWMA", "VWAP"])
averageLength1  = input.int(defval=99, title="MA Lenght", group="MA")
averageSource1  = input(close, title="MA Source", group="MA")

//MA TYPE
MovAvgType1(averageType1, averageSource1, averageLength1) =>
	switch str.upper(averageType1)
        "SMA"  => ta.sma(averageSource1, averageLength1)
        "EMA"  => ta.ema(averageSource1, averageLength1)
        "WMA"  => ta.wma(averageSource1, averageLength1)
        "HMA"  => ta.hma(averageSource1, averageLength1)
        "RMA"  => ta.rma(averageSource1, averageLength1)
        "SWMA" => ta.swma(averageSource1)
        "ALMA" => ta.alma(averageSource1, averageLength1, 0.85, 6)
        "VWMA" => ta.vwma(averageSource1, averageLength1)
        "VWAP" => ta.vwap(averageSource1)
        => runtime.error("Moving average type '" + averageType1 +
             "' not found!"), na


//MA VALUES
ma  = MovAvgType1(averageType1, averageSource1, averageLength1)

//MA CONDITIONS
bullish_ma = close > ma
bearish_ma = close < ma

//PLOT COLOR
ma_plot    = if close > ma
    color.navy
else
    color.rgb(49, 27, 146, 40)

//MA PLOT
plot(ma,color=ma_plot, linewidth=2, title="MA")

//--------------------------------------
//BB INPUTS
length  = input.int(20, minval=1, group="BB")
src     = input(close, title="Source", group="BB")
mult    = input.float(2.0, minval=0.001, maxval=50, title="StdDev", group="BB")

//BB VALUES
basis = ta.sma(src, length)
dev = mult * ta.stdev(src, length)
upper = basis + dev
lower = basis - dev
offset = input.int(0, "Offset", minval = -500, maxval = 500)

//BBPLOT
//plot(basis, "Basis", color=#FF6D00, offset = offset)
p1 = plot(upper, "Upper", color=#2978ffa4, offset = offset)
p2 = plot(lower, "Lower", color=#2978ffa4, offset = offset)
fill(p1, p2, title = "Background", color=color.rgb(33, 47, 243, 97))

//BB ENTRY AND EXIT CONDITIONS
bb_long_entry  = close >= upper
bb_long_exit   = close <= lower
bb_short_entry = close <= lower
bb_short_exit  = close >= upper

//---------------------------------------------------------------
//VOLUME INPUTS
useVolumefilter  = input.bool(title='Use Volume Filter?', defval=false, group="Volume Inputs")
dailyLength      = input.int(title = "MA length", defval = 30, minval = 1, maxval = 100, group = "Volume Inputs")
lineWidth        = input.int(title = "Width of volume bars", defval = 3, minval = 1, maxval = 6, group = "Volume Inputs")
Volumefilter_display  = input.bool(title="Color bars?", defval=false, group="Volume Inputs", tooltip = "Change bar colors when Volume is above average")

//VOLUME VALUES
volumeAvgDaily = ta.sma(volume, dailyLength)

//VOLUME SIGNAL
v_trigger  = (useVolumefilter ? volume > volumeAvgDaily : inTradeWindow)

//PLOT VOLUME SIGNAL
barcolor(Volumefilter_display ? v_trigger ? color.new(#6fe477, 77):na: na, title="Volume Filter")
//---------------------------------------------------------------

//ENTRIES AND EXITS
long_entry  = if inTradeWindow and bullish_ma and bb_long_entry and v_trigger and LongPositions
    true
long_exit   = if inTradeWindow and bb_long_exit
    true

short_entry = if inTradeWindow  and bearish_ma and bb_short_entry and v_trigger and ShortPositions
    true
short_exit  = if inTradeWindow  and bb_short_exit
    true

//--------------------------------------

//RISK MANAGEMENT - SL, MONEY AT RISK, POSITION SIZING
atrPeriod                = input.int(14, "ATR Length", group="Risk Management Inputs")
sl_atr_multiplier        = input.float(title="Long Position - Stop Loss - ATR Multiplier", defval=2, group="Risk Management Inputs", step=0.5)
sl_atr_multiplier_short  = input.float(title="Short Position - Stop Loss - ATR Multiplier", defval=2, group="Risk Management Inputs", step=0.5)
i_pctStop                = input.float(2, title="% of Equity at Risk", step=.5, group="Risk Management Inputs")/100

//ATR VALUE
_atr = ta.atr(atrPeriod)

//CALCULATE LAST ENTRY PRICE
lastEntryPrice = strategy.opentrades.entry_price(strategy.opentrades - 1)

//STOP LOSS - LONG POSITIONS
var float sl = na

//CALCULTE SL WITH ATR AT ENTRY PRICE - LONG POSITION
if (strategy.position_size[1] != strategy.position_size)
    sl := lastEntryPrice - (_atr * sl_atr_multiplier)

//IN TRADE - LONG POSITIONS
inTrade = strategy.position_size > 0

//PLOT SL - LONG POSITIONS
plot(inTrade ? sl : na, color=color.blue, style=plot.style_circles, title="Long Position - Stop Loss")

//CALCULATE ORDER SIZE - LONG POSITIONS
positionSize = (strategy.equity * i_pctStop) / (_atr * sl_atr_multiplier)

//============================================================================================

//STOP LOSS - SHORT POSITIONS
var float sl_short = na

//CALCULTE SL WITH ATR AT ENTRY PRICE - SHORT POSITIONS
if (strategy.position_size[1] != strategy.position_size)
    sl_short := lastEntryPrice + (_atr * sl_atr_multiplier_short)

//IN TRADE SHORT POSITIONS
inTrade_short = strategy.position_size < 0

//PLOT SL - SHORT POSITIONS
plot(inTrade_short ? sl_short : na, color=color.red, style=plot.style_circles, title="Short Position - Stop Loss")

//CALCULATE ORDER - SHORT POSITIONS
positionSize_short = (strategy.equity * i_pctStop) / (_atr * sl_atr_multiplier_short)


//===============================================

//LONG STRATEGY
strategy.entry("Long", strategy.long, comment="Long", when = long_entry, qty=positionSize)
if (strategy.position_size > 0)
    strategy.close("Long", when = (long_exit), comment="Close Long")
    strategy.exit("Long", stop = sl, comment="Exit Long")

//SHORT STRATEGY
strategy.entry("Short", strategy.short, comment="Short", when = short_entry, qty=positionSize_short)
if (strategy.position_size < 0)
    strategy.close("Short", when = (short_exit), comment="Close Short")
    strategy.exit("Short", stop = sl_short, comment="Exit Short")

//ONE DIRECTION TRADING COMMAND (BELLOW ONLY ACTIVATE TO CORRECT BUGS)
//strategy.risk.allow_entry_in(strategy.direction.long)