개요
이 전략은 최근 일정 기간 동안의 최고 가격과 최저 가격을 계산하여 현재 가격과 결합하여 동적인 중간축을 형성한다. 그리고는 최근 변동률에 따라 빨간 하향 채널과 녹색 상향 채널을 생성한다. 이 세 개의 채널 라인은 거래 가능한 범위를 구성한다. 가격이 채널 경계에 가까워지면 역전작업을 수행하고, 목표는 중간축으로 돌아가는 것이다.
전략 원칙
- 최근 N주기의 최고 가격과 최저 가격을 계산하고, 현재 폐장 가격과 결합하여 동적 중축을 형성
- ATR 및 곱하기 생성된 동적 통로 대역, 시장 변동에 따른 대역폭
- 가격이 하위 채널 라인에서 반발 할 때 더 많이하고, 상위 채널 라인에서 반발 할 때 더 많이
- 정지 및 중단 논리, 중축 정지로 돌아가는 목표
- 동시 트렌드 인덱스를 계산하여 부진한 거래를 필터링합니다.
우위 분석
- 채널 라인 위치의 동적 변화, 실시간 시장 변동률 포착
- 유동 거래의 확률이 높아서 트렌드를 파악하는 데 도움이 됩니다.
- 단편적 손실을 제어하는 논리적인 제약
위험 분석
- 변수 최적화가 잘못되면 과도한 거래가 발생할 수 있습니다.
- 대동맥에서 불리한 거래를 완전히 제거할 수 없습니다.
- 일방적인 돌파구가 계속될 수 있습니다.
최적화 방향
- 다양한 품종의 특성에 맞게 통로 라인의 매개 변수를 조정합니다.
- 트렌드 지수 변수를 조정하여 우세 확률을 높여줍니다.
- 기계 학습 요소를 추가하여 변수를 동적으로 최적화합니다.
요약하다
이 전략은 주로 시장의 흔들림 특성에 의존하여 수익을 얻는다. 동적 채널을 통해 가격 반전점을 포착하고, 트렌드 필터링과 결합하여 반전 거래를 효과적으로 활용할 수 있으며, 동시에 위험을 제어한다. 핵심은 변수와 조율하는 데 있습니다. 채널 라인이 실시간으로 가격을 추적 할 수 있도록하는 것이 필요하며 너무 민감하지 않습니다. 또한 트렌드 지수는 필터링 역할을하기 위해 적절한 주기를 선택해야합니다. 이 전략은 이론적으로 순조롭고 상쇄가 있으며, 실제 사용에서는 변수 최적화로 좋은 수익을 얻을 수 있습니다.
전략 소스 코드
/*backtest
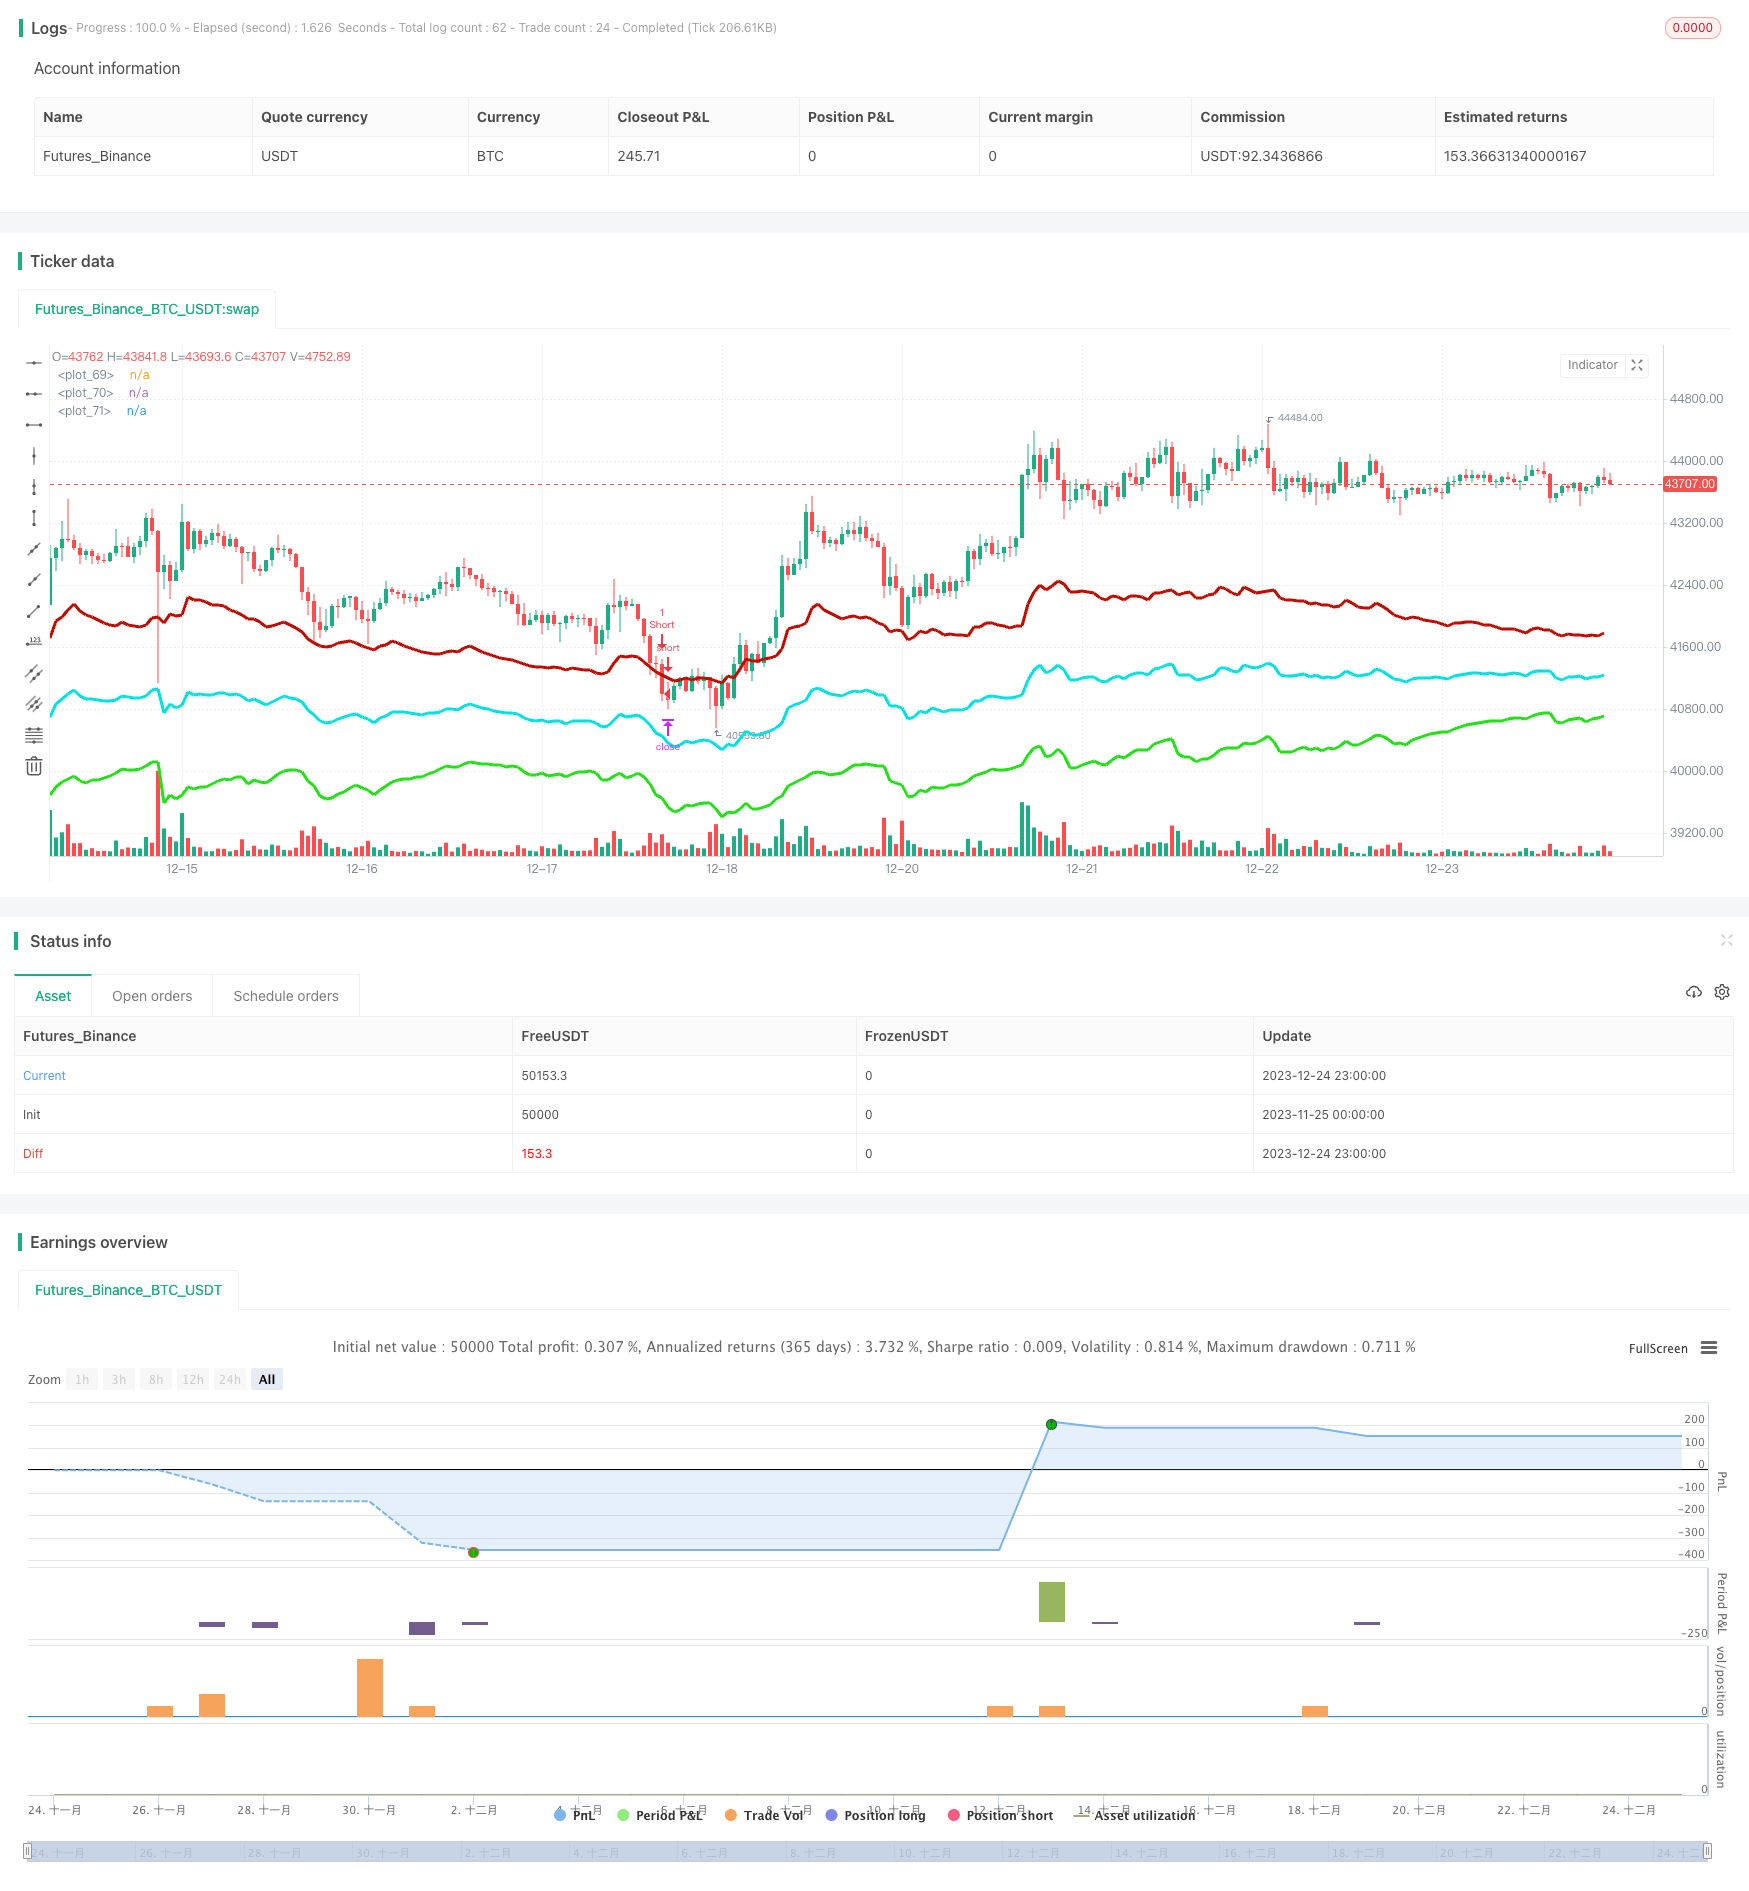
start: 2023-11-25 00:00:00
end: 2023-12-25 00:00:00
period: 1h
basePeriod: 15m
exchanges: [{"eid":"Futures_Binance","currency":"BTC_USDT"}]
*/
//@version=4
strategy(title="Strategy - Bobo PAPATR", overlay=true, default_qty_type = strategy.fixed, default_qty_value = 1, initial_capital = 10000)
// === STRATEGY RELATED INPUTS AND LOGIC ===
len = input(24, minval=1, title="Pivot Length, defines lookback for highs and lows to make pivots")
length = input(title="ATR lookback (Lower = bands more responsive to recent price action)", type=input.integer, defval=22)
myatr = atr(length)
dailyatr = myatr[1]
atrmult = input(title="ATR multiplier (Lower = wider bands)", type=input.float, defval=3)
pivot0 = (high[1] + low[1] + close[1]) / 3
// PIVOT CALC
h = highest(len)
h1 = dev(h, len) ? na : h
hpivot = fixnan(h1)
l = lowest(len)
l1 = dev(l, len) ? na : l
lpivot = fixnan(l1)
pivot = (lpivot + hpivot + pivot0) / 3
upperband1 = (dailyatr * atrmult) + pivot
lowerband1 = pivot - (dailyatr * atrmult)
middleband = pivot
// == TREND CALC ===
i1=input(2, "Momentum Period", minval=1) //Keep at 2 usually
i2=input(20, "Slow Period", minval=1)
i3=input(5, "Fast Period", minval=1)
i4=input(3, "Smoothing Period", minval=1)
i5=input(4, "Signal Period", minval=1)
i6=input(50, "Extreme Value", minval=1)
hiDif = high - high[1]
loDif = low[1] - low
uDM = hiDif > loDif and hiDif > 0 ? hiDif : 0
dDM = loDif > hiDif and loDif > 0 ? loDif : 0
ATR = rma(tr(true), i1)
DIu = 100 * rma(uDM, i1) / ATR
DId = 100 * rma(dDM, i1) / ATR
HLM2 = DIu - DId
DTI = (100 * ema(ema(ema(HLM2, i2), i3), i4)) / ema(ema(ema(abs(HLM2), i2), i3), i4)
signal = ema(DTI, i5)
// === RISK MANAGEMENT INPUTS ===
inpTakeProfit = input(defval = 0, title = "Take Profit (In Market MinTick Value)", minval = 0)
inpStopLoss = input(defval = 100, title = "Stop Loss (In Market MinTick Value)", minval = 0)
// === RISK MANAGEMENT VALUE PREP ===
// if an input is less than 1, assuming not wanted so we assign 'na' value to disable it.
useTakeProfit = inpTakeProfit >= 1 ? inpTakeProfit : na
useStopLoss = inpStopLoss >= 1 ? inpStopLoss : na
// === STRATEGY - LONG POSITION EXECUTION ===
enterLong = (((low<=lowerband1) and (close >lowerband1)) or ((open <= lowerband1) and (close > lowerband1))) and (strategy.opentrades <1) and (atr(3) > atr(50)) and (signal>signal[3])
exitLong = (high > middleband)
strategy.entry(id = "Long", long = true, when = enterLong)
strategy.close(id = "Long", when = exitLong)
// === STRATEGY - SHORT POSITION EXECUTION ===
enterShort = (((high>=upperband1) and (close < upperband1)) or ((open >= upperband1) and (close < upperband1))) and (strategy.opentrades <1) and (atr(3) > atr(50)) and (signal<signal[3])
exitShort = (low < middleband)
strategy.entry(id = "Short", long = false, when = enterShort)
strategy.close(id = "Short", when = exitShort)
// === STRATEGY RISK MANAGEMENT EXECUTION ===
strategy.exit("Exit Long", from_entry = "Long", profit = useTakeProfit, loss = useStopLoss)
strategy.exit("Exit Short", from_entry = "Short", profit = useTakeProfit, loss = useStopLoss)
// === CHART OVERLAY ===
plot(upperband1, color=#C10C00, linewidth=3)
plot(lowerband1, color=#23E019, linewidth=3)
plot(middleband, color=#00E2E2, linewidth=3)
//plot(strategy.equity, title="equity", color=red, linewidth=2, style=areabr)