개요
Bullish Engulfing는 K선 형태를 기반으로 한 양적 거래 전략이다. 이 전략은 K선 형태를 인식하여 주식 가격의 역전 기회를 포착하여 수익을 창출한다.
이 전략의 주요 장점은 다음과 같습니다.
- 정교한 기술 분석 이론에 기반하여 높은 확률의 가격 반전 기회를 식별합니다.
- 간단하고 직관적인 거래 신호
- 위험은 통제할 수 있습니다.
전략 원칙
이 전략은 K선 형태를 취한 불리쉬 엔글루핑 (Bullish Engulfing) 을 기반으로 가격 반전을 판단한다.
주식이 하향 추세에 있을 때, 만약 하나의 주체가 작은 음계 K선으로 나타나고, 그 다음의 K선으로 이어지는 주체가 전의 K선으로 이어지는 주체를 완전히 삼켜버리고, 그리고 종결 가격이 전의 K선으로 이어지는 주식의 최고 가격보다 높으면, 불리시 앵글핑 대양 삼켜버리는 것을 형성한다. 이는 가격이 반전될 것을 예고하고, 주가가 상승할 것이다.
이 전략은 Bullish Engulfing 형태를 인식할 때 더 많은 포지션을 열고 Exit을 설정하여 1%의 수익을 목표로하고 1%의 손실을 중지하고 수익을 잠금합니다.
전략적 강점 분석
이 전략은 다음과 같은 장점을 가지고 있습니다.
- 검증된 기술 분석 이론에 근거하여, Bullish Engulfing는 가격 반전의 신호가 높은 확률로, 가격 반전의 기회를 효과적으로 포착할 수 있다.
- 거래 신호는 간단하고 직관적이며, 이해하기 쉬운 구현으로, 양적 거래에 적합하다.
- 주식 지수 선물과 같은 유동성이 높은 품종을 도입하면 효율적인 출입을 할 수 있다.
- 스톱 스톱 손실 Exit을 설정하면 단일 거래의 이익 손실 비율을 잘 제어 할 수 있으며, 수익을 보장하고 큰 손실을 방지 할 수 있습니다.
- 전략의 매개 변수는 다양한 품종과 시장 환경에 따라 유연하게 조정할 수 있습니다.
전략적 위험 분석
이 전략에는 몇 가지 위험도 있습니다.
- 기술 분석 이론에 따르면, 잘못된 신호의 위험이 있습니다.
- 시장 조건의 변화로 인해 매개 변수가 유효하지 않을 수 있으며, 조정할 필요가 있다.
- 스톱 손실 설정이 너무 작으면 작은 스톱 손실이 발생할 수 있으며, 너무 커지면 손실이 증가 할 수 있습니다.
위와 같은 위험들에 대해, 우리는 다음과 같은 조치를 취할 수 있습니다.
- 최적화 매개 변수, 다양한 시장에서의 유효성을 검증하는 것
- 단독 스톱 손실을 감당할 수 있는 범위 내에서 제어할 수 있도록 스톱 손실을 확대한다.
- 지수나 주식 지수 선물과 같은 유동성이 좋고 변동성이 적당한 거래 종류.
전략 최적화 방향
이 전략은 다음과 같은 측면에서 최적화될 수 있습니다.
- 트렌드 지표 필터링과 함께, 예를 들어, 평평선 판단을 추가하여 역동적인 거래를 피하십시오.
- 을 막고 수익을 창출할 수 있게 해줍니다.
- 가격운동에 따라 점진적으로 스톱로드를 높이고 스톱로드를 감소시키는 등 스톱로드 메커니즘을 최적화한다
- 부리쉬 앵글핑 과 비슷한 다른 K선 형태의 조합을 사용하여 거래 포트폴리오를 형성한다.
요약하다
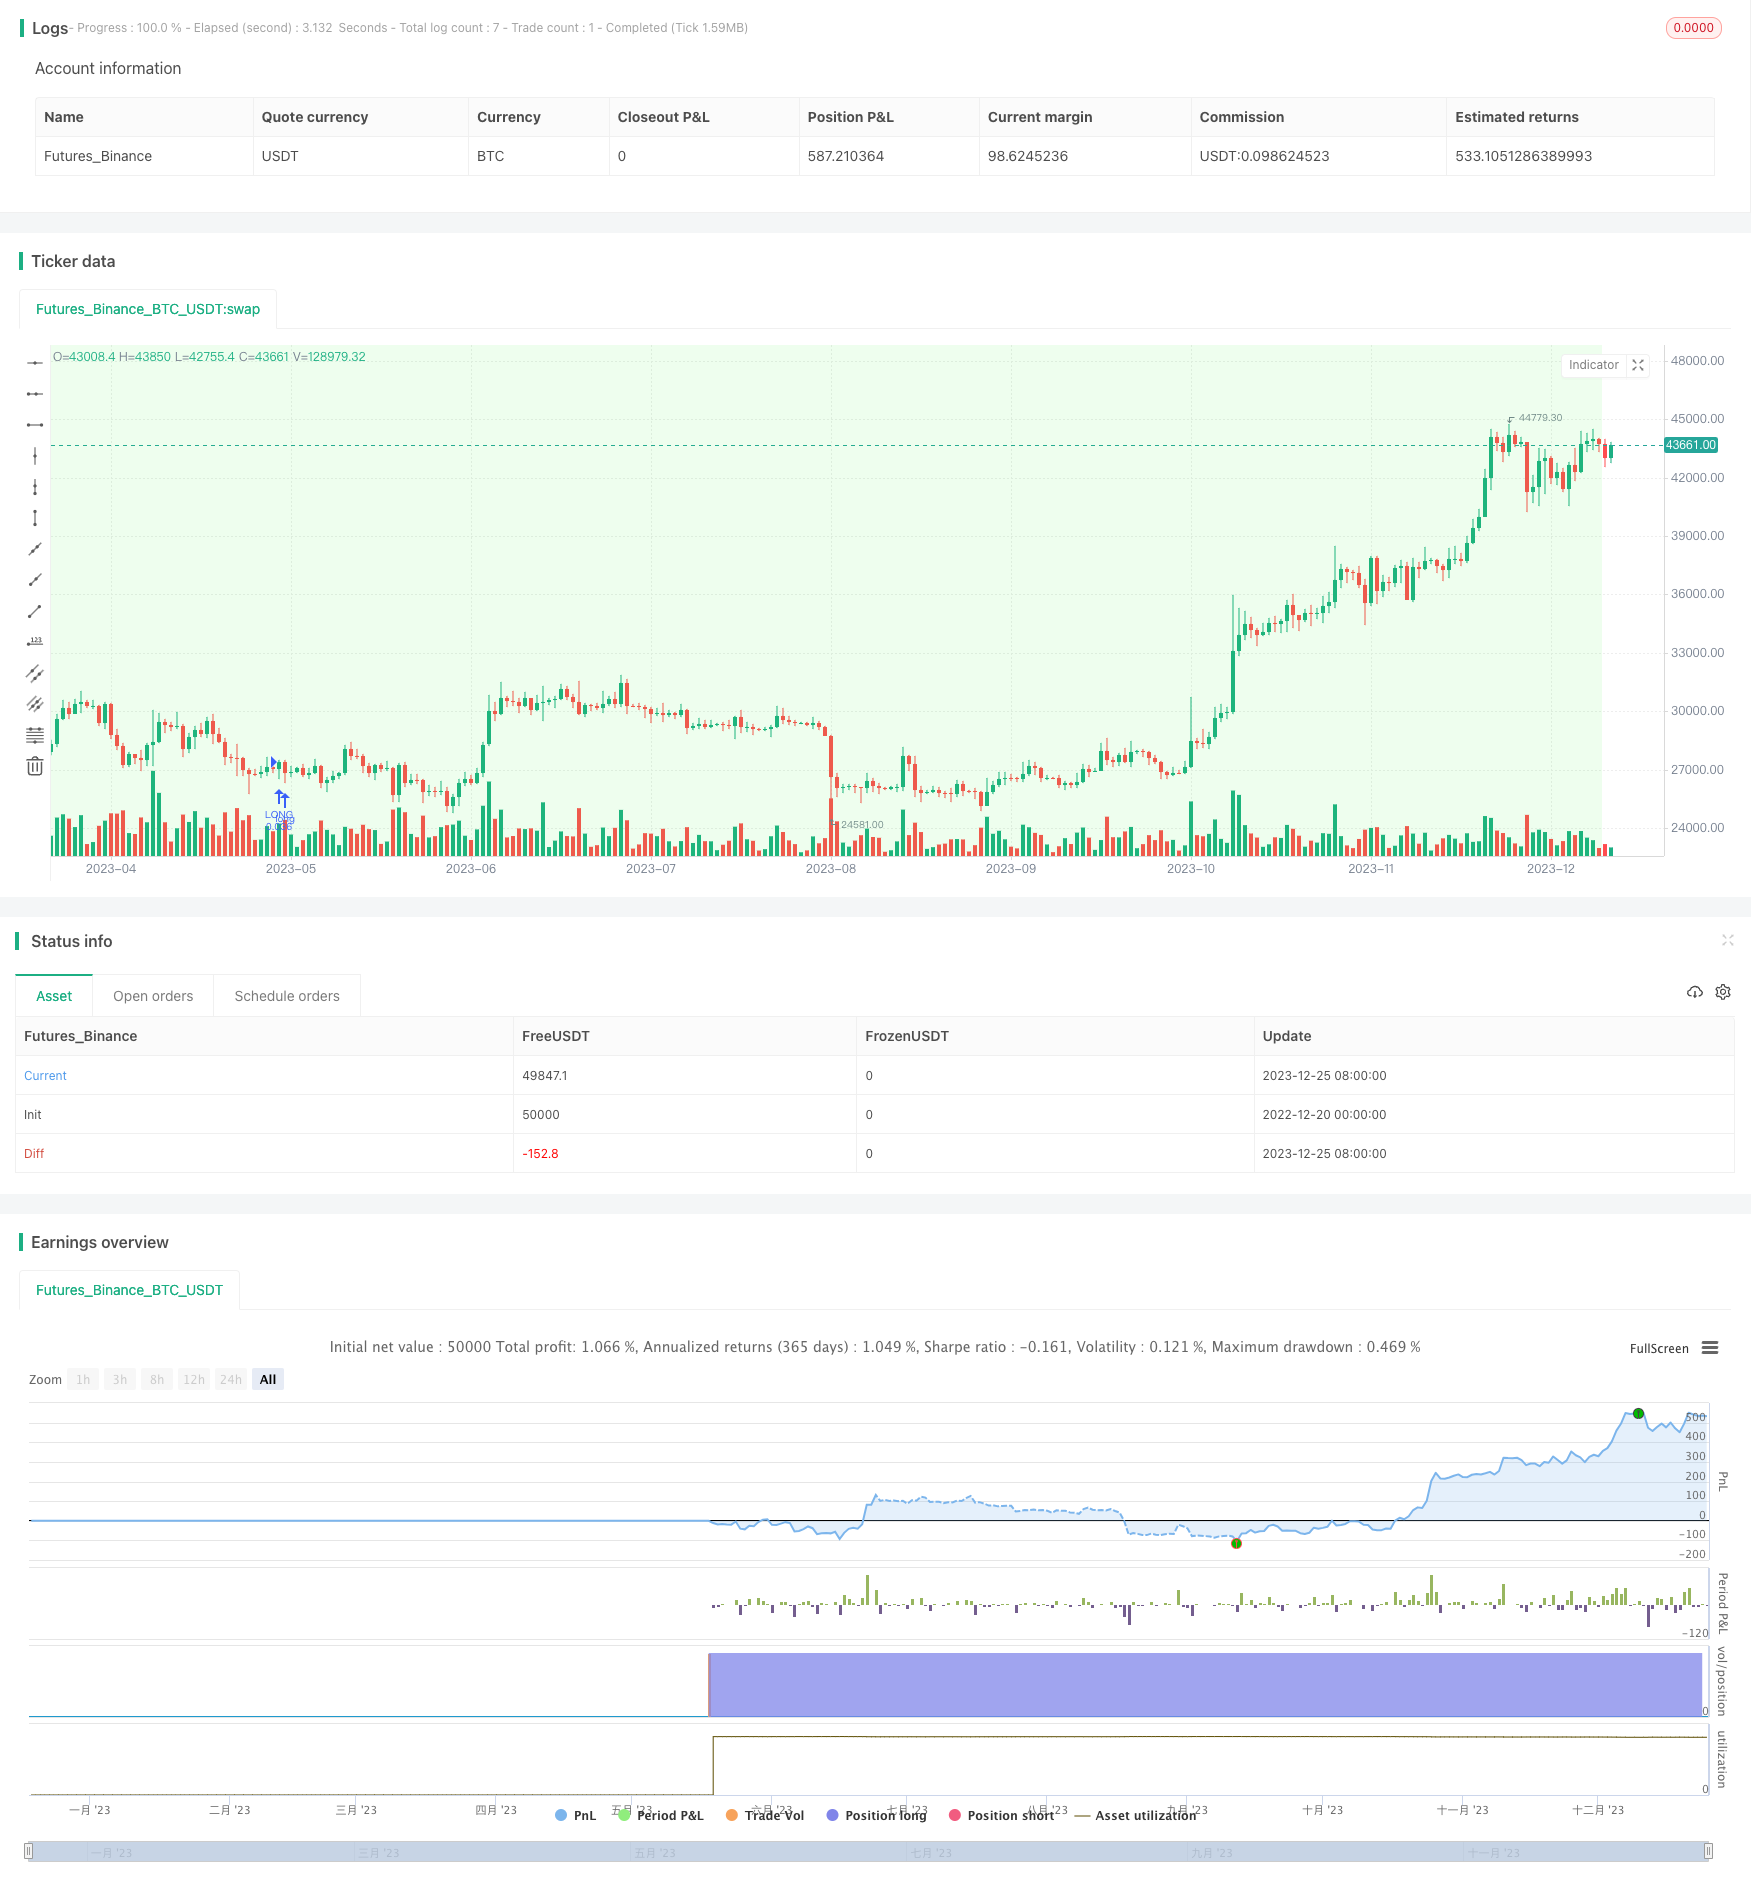
Bullish Engulfing 거래 전략은 기술 분석을 기반으로 한 정량 거래 전략으로 거래 신호가 간결하고 명확하며 쉽게 실행 할 수 있습니다. 매개 변수 최적화 및 위험 제어 조치가있는 경우 안정적인 수익을 얻을 수 있습니다.
전략 소스 코드
/*backtest
start: 2022-12-20 00:00:00
end: 2023-12-26 00:00:00
period: 1d
basePeriod: 1h
exchanges: [{"eid":"Futures_Binance","currency":"BTC_USDT"}]
*/

// This source code is subject to the terms of the Mozilla Public License 2.0 at https://mozilla.org/MPL/2.0/
// © thequantscience

// ██████╗ ██╗   ██╗██╗     ██╗     ██╗███████╗██╗  ██╗    ███████╗███╗   ██╗ ██████╗ ██╗   ██╗██╗     ███████╗██╗███╗   ██╗ ██████╗
// ██╔══██╗██║   ██║██║     ██║     ██║██╔════╝██║  ██║    ██╔════╝████╗  ██║██╔════╝ ██║   ██║██║     ██╔════╝██║████╗  ██║██╔════╝
// ██████╔╝██║   ██║██║     ██║     ██║███████╗███████║    █████╗  ██╔██╗ ██║██║  ███╗██║   ██║██║     █████╗  ██║██╔██╗ ██║██║  ███╗
// ██╔══██╗██║   ██║██║     ██║     ██║╚════██║██╔══██║    ██╔══╝  ██║╚██╗██║██║   ██║██║   ██║██║     ██╔══╝  ██║██║╚██╗██║██║   ██║
// ██████╔╝╚██████╔╝███████╗███████╗██║███████║██║  ██║    ███████╗██║ ╚████║╚██████╔╝╚██████╔╝███████╗██║     ██║██║ ╚████║╚██████╔╝
// ╚═════╝  ╚═════╝ ╚══════╝╚══════╝╚═╝╚══════╝╚═╝  ╚═╝    ╚══════╝╚═╝  ╚═══╝ ╚═════╝  ╚═════╝ ╚══════╝╚═╝     ╚═╝╚═╝  ╚═══╝ ╚═════╝

//@version=5
strategy(
     "Buy&Sell Bullish Engulfing - The Quant Science",
     overlay = true,
     default_qty_type = strategy.percent_of_equity,
     default_qty_value = 100,
     pyramiding = 1,
     currency = currency.EUR,
     initial_capital = 10000,
     commission_type = strategy.commission.percent,
     commission_value = 0.07,
     process_orders_on_close = true,
     close_entries_rule = "ANY"
     )

startDate  = input.int(title="D: ", defval=1,    minval=1,    maxval=31,   inline = 'Start', group = "START DATE BACKTESTING", tooltip = "D is Day, M is Month, Y is Year.")
startMonth = input.int(title="M: ", defval=1,    minval=1,    maxval=12,   inline = 'Start', group = "START DATE BACKTESTING", tooltip = "D is Day, M is Month, Y is Year.")
startYear  = input.int(title="Y: ", defval=2022, minval=1800, maxval=2100, inline = 'Start', group = "START DATE BACKTESTING", tooltip = "D is Day, M is Month, Y is Year.")

endDate    = input.int(title="D: ", defval=31,   minval=1,    maxval=31,   inline = 'End',   group = "END DATE BACKTESTING", tooltip = "D is Day, M is Month, Y is Year.")
endMonth   = input.int(title="M: ", defval=12,   minval=1,    maxval=12,   inline = 'End',   group = "END DATE BACKTESTING", tooltip = "D is Day, M is Month, Y is Year.")
endYear    = input.int(title="Y: ", defval=2023, minval=1800, maxval=2100, inline = 'End',   group = "END DATE BACKTESTING", tooltip = "D is Day, M is Month, Y is Year.")

inDateRange = (time >= timestamp(syminfo.timezone, startYear, startMonth, startDate, 0, 0)) and (time < timestamp(syminfo.timezone, endYear, endMonth, endDate, 0, 0))

PROFIT   = input.float(defval = 1, minval = 0, title = "Target profit (%): ", step = 0.10, group = "TAKE PROFIT-STOP LOSS")
STOPLOSS = input.float(defval = 1, minval = 0, title = "Stop Loss (%): ",     step = 0.10, group = "TAKE PROFIT-STOP LOSS")

var float equity_trades = 0
strategy.initial_capital = 50000
equity_trades := strategy.initial_capital
var float equity   = 0
var float qty_order   = 0
t_ordersize = "Percentage size of each new order. With 'Reinvestment Profit' activate, the size will be calculate on the equity, with 'Reinvestment Profit' deactivate the size will be calculate on the initial capital."
orders_size = input.float(defval = 2, title = "Orders size (%): ", minval = 0.10, step = 0.10,  maxval = 100, group = "RISK MANAGEMENT", tooltip = t_ordersize)
qty_order := ((equity_trades * orders_size) / 100 ) / close

C_DownTrend = true
C_UpTrend   = true
var trendRule1 = "SMA50"
var trendRule2 = "SMA50, SMA200"
var trendRule = input.string(trendRule1, "Detect Trend Based On", options=[trendRule1, trendRule2, "No detection"], group = "BULLISH ENGULFING")

if trendRule == trendRule1
	priceAvg = ta.sma(close, 50)
	C_DownTrend := close < priceAvg
	C_UpTrend := close > priceAvg

if trendRule == trendRule2
	sma200 = ta.sma(close, 200)
	sma50  = ta.sma(close, 50)
	C_DownTrend := close < sma50 and sma50 < sma200
	C_UpTrend := close > sma50 and sma50 > sma200
C_Len = 14
C_ShadowPercent = 5.0
C_ShadowEqualsPercent = 100.0
C_DojiBodyPercent = 5.0
C_Factor = 2.0

C_BodyHi = math.max(close, open)
C_BodyLo = math.min(close, open)
C_Body = C_BodyHi - C_BodyLo
C_BodyAvg = ta.ema(C_Body, C_Len)
C_SmallBody = C_Body < C_BodyAvg
C_LongBody = C_Body > C_BodyAvg
C_UpShadow = high - C_BodyHi
C_DnShadow = C_BodyLo - low
C_HasUpShadow = C_UpShadow > C_ShadowPercent / 100 * C_Body
C_HasDnShadow = C_DnShadow > C_ShadowPercent / 100 * C_Body
C_WhiteBody = open < close
C_BlackBody = open > close
C_Range = high-low
C_IsInsideBar = C_BodyHi[1] > C_BodyHi and C_BodyLo[1] < C_BodyLo
C_BodyMiddle = C_Body / 2 + C_BodyLo
C_ShadowEquals = C_UpShadow == C_DnShadow or (math.abs(C_UpShadow - C_DnShadow) / C_DnShadow * 100) < C_ShadowEqualsPercent and (math.abs(C_DnShadow - C_UpShadow) / C_UpShadow * 100) < C_ShadowEqualsPercent
C_IsDojiBody = C_Range > 0 and C_Body <= C_Range * C_DojiBodyPercent / 100
C_Doji = C_IsDojiBody and C_ShadowEquals

patternLabelPosLow  = low  - (ta.atr(30) * 0.6)
patternLabelPosHigh = high + (ta.atr(30) * 0.6)

label_color_bullish = input.color(color.rgb(43, 255, 0), title = "Label Color Bullish", group = "BULLISH ENGULFING")
C_EngulfingBullishNumberOfCandles = 2
C_EngulfingBullish = C_DownTrend and C_WhiteBody and C_LongBody and C_BlackBody[1] and C_SmallBody[1] and close >= open[1] and open <= close[1] and ( close > open[1] or open < close[1] )
if C_EngulfingBullish
    var ttBullishEngulfing = "Engulfing\nAt the end of a given downward trend, there will most likely be a reversal pattern. To distinguish the first day, this candlestick pattern uses a small body, followed by a day where the candle body fully overtakes the body from the day before, and closes in the trend’s opposite direction. Although similar to the outside reversal chart pattern, it is not essential for this pattern to completely overtake the range (high to low), rather only the open and the close."
    label.new(bar_index, patternLabelPosLow, text="BE", style=label.style_label_up, color = label_color_bullish, textcolor=color.white, tooltip = ttBullishEngulfing)
bgcolor(ta.highest(C_EngulfingBullish?1:0, C_EngulfingBullishNumberOfCandles)!=0 ? color.new(#21f321, 90) : na, offset=-(C_EngulfingBullishNumberOfCandles-1))

var float c       = 0
var float o       = 0
var float c_exit  = 0
var float c_stopl = 0

if C_EngulfingBullish and strategy.opentrades==0 and inDateRange
    c := strategy.equity
    o := close
    c_exit  := c + (c * PROFIT / 100)
    c_stopl := c - (c * STOPLOSS / 100)
    strategy.entry(id = "LONG", direction = strategy.long, qty = qty_order, limit = o)

if ta.crossover(strategy.equity, c_exit)
    strategy.exit(id = "CLOSE-LONG", from_entry = "LONG", limit = close)
if ta.crossunder(strategy.equity, c_stopl)
    strategy.exit(id = "CLOSE-LONG", from_entry = "LONG", limit = close)