개요
쌍방향 RSI 돌파 전략은 RSI 지표를 사용하여 가격 반전점을 식별하는 알고리즘 거래 전략이다. RSI 지표를 설정된 상하 하위값과 비교하여 시장이 과매매를 초과했는지 판단하고 거래 신호를 발산한다.
전략 원칙
이 전략은 주로 RSI 지표에 의존하여 상황을 판단한다. RSI 지표는 일정 기간 동안의 종결 가격의 변화를 기반으로 계산되며, 이는 주식의 구매력을 반영한다. RSI 상의 설정된 상위 상위 (설정된 75위) 를 넘으면 주식이 초고가 지역으로 진입하는 것을 나타냅니다.
전략적 판단 규칙:
- RSI가 하락하면 공백을 둡니다.
- RSI가 하락할 때 더 많은 일을 해야 합니다.
- 스톱로스 또는 스톱로스 후 평점.
거래 논리는 간단하고 명확하며, 참조 매개 변수는 합리적으로 설정되어 있으며, 구성 가능한 공간이 넓으며, 시장의 큰 추세를 포착하는 데 적합합니다.
우위 분석
이 전략은 다음과 같은 장점을 가지고 있습니다.
- 논리적으로 간단하고, 이해하기 쉽고, 구현하기 쉽습니다.
- 참고 변수 설정은 합리적이고 개인화 할 수 있습니다.
- 리버스 트레이딩 로직을 구성하고, 상황에 따라 유연하게 대응할 수 있습니다.
- 가격의 전환점을 효과적으로 식별하고, 큰 트렌드를 포착할 수 있다.
전체적으로, 이 전략의 참조 매개 변수는 합리적으로 설정되고, 실행이 간단하며, RSI 지표를 통해 가격 반전을 효과적으로 판단할 수 있으며, 중·장선에서 큰 동향을 포착하는 데 적합하며, 사용하기 쉬운 계량화 전략이다.
위험 분석
이 전략은 간단하고 안정적이지만, 잠재적인 위험도 무시할 수 없습니다.
- RSI 지표는 잘못된 신호를 발산할 확률이 높습니다. RSI는 가격 반전을 완벽하게 예측할 수 없으며, 잘못된 판단이 발생할 수 있습니다.
- 트렌드 상황 속에서 연속적으로 상쇄되는 가능성이 있다. RSI 지표는 정상적인 범위 조정과 트렌드 반전을 구별하기 어렵다.
- 충격적인 상황에서는 손실이 더 많다. RSI 지표는 충격적인 움직임을 효과적으로 판단할 수 없으며, 이러한 환경에서는 전략 손실이 증가한다.
위험들을 통제하기 위해, 우리는 다음과 같은 점들을 주의해야 합니다.
- 잘못된 판단을 방지하기 위해 매개 변수를 적절하게 조정합니다.
- 다른 지표와 결합하여 거래 신호를 확인하여 정확도를 높여줍니다.
- 단편적 손실을 줄이기 위해
- 이 거래는 매우 위험합니다.
최적화 방향
이 전략은 주로 반전 오류와 충격적 인 손실의 위험에 직면해 있기 때문에 다음과 같은 측면에서 최적화 할 수 있습니다.
- 다른 지표와 결합하여 신호 필터링한다. KDJ, MACD 등 지표는 필터링 역할을 하며, 잘못된 판단을 방지한다.
- 조건부 단편적 손실을 늘리십시오. 단편적 손실을 적절히 확대하여 전략이 큰 추세와 함께 작동하도록 도와줍니다.
- 포지션 개시 빈도 제한을 설정한다. 1회 또는 N회 거래의 논리적 임계값을 추가하여 포지션 개시 빈도를 조절한다.
- 상황 판단을 설정한다. 판단 전략은 트렌드 상황에서만 작동하며, 충격적인 상황을 피하며, 전략의 수익 위험 비율을 크게 최적화할 수 있다.
요약하다
양방향 RSI 돌파 전략은 전반적으로 간단하고 실용적인 양적 전략이다. 그것은 RSI 지표를 통해 가격 반전을 판단하여 간단한 트렌드 추적을 구현한다. 약간의 잘못된 판단의 위험이 있음에도 불구하고, 매개 변수 조정 및 신호 필터링을 통해 최적화 할 수 있으며, 중·장선 트렌드를 포착하는 데 중요한 역할을 한다.
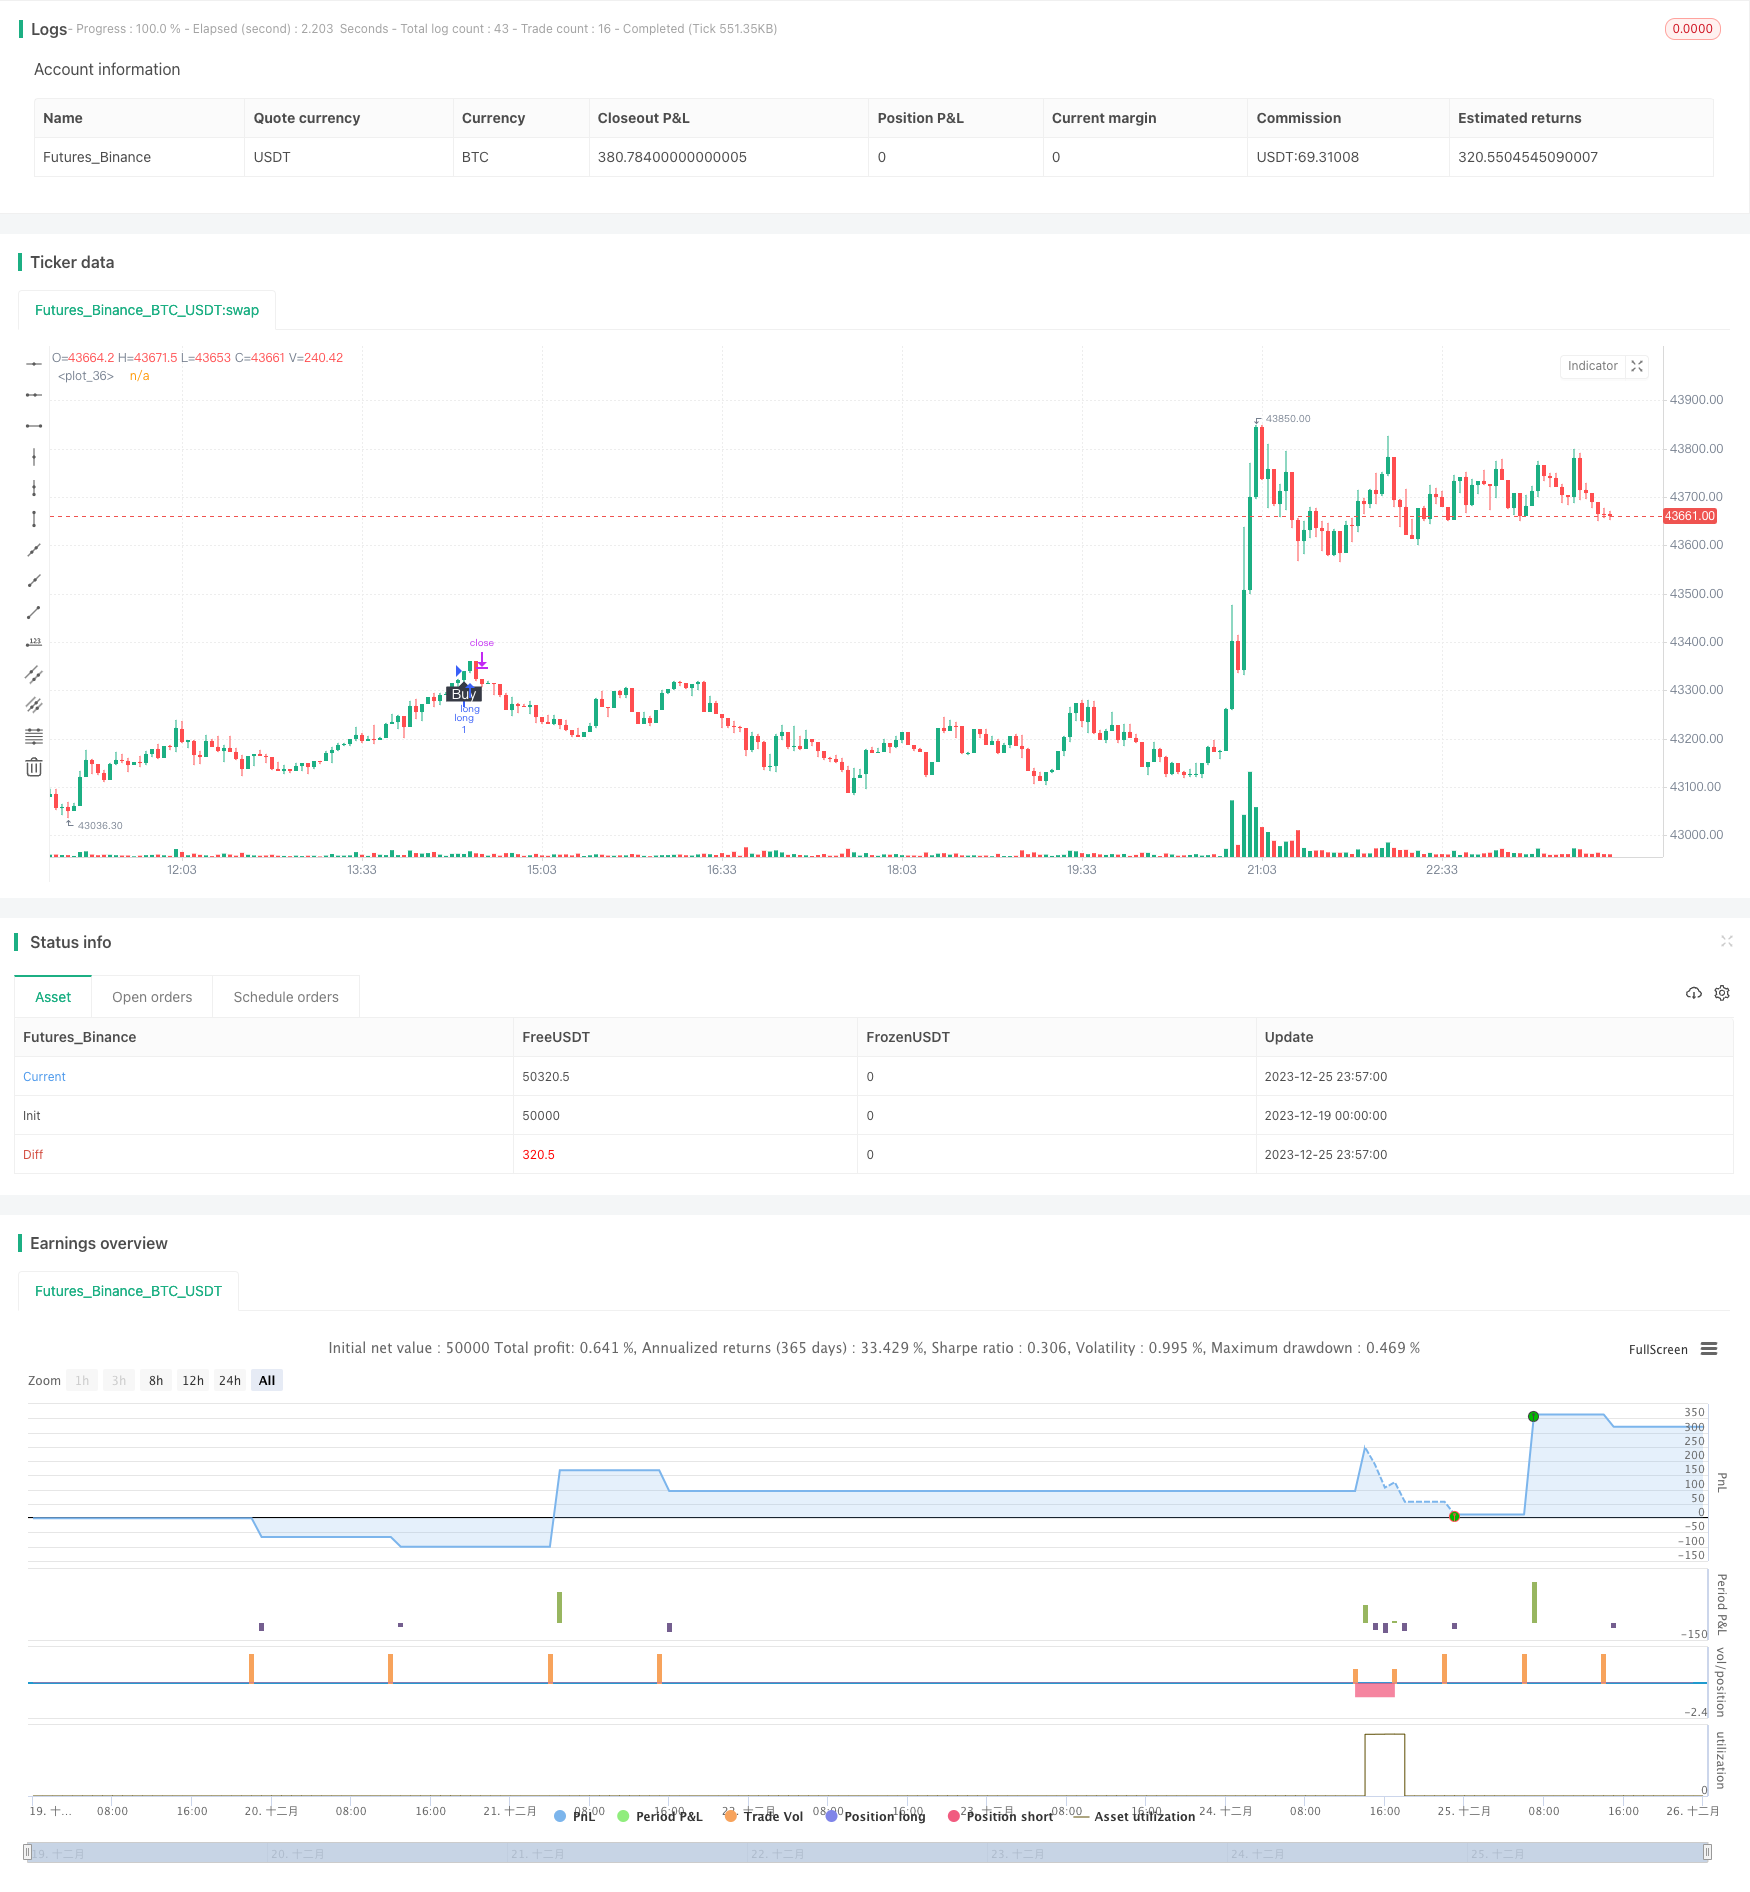
/*backtest
start: 2023-12-19 00:00:00
end: 2023-12-26 00:00:00
period: 3m
basePeriod: 1m
exchanges: [{"eid":"Futures_Binance","currency":"BTC_USDT"}]
*/

//@version=4
strategy("RSI Algo", overlay=true)

// Calculate start/end date and time condition
DST = 1 //day light saving for usa
//--- Europe
London = iff(DST==0,"0000-0900","0100-1000")
//--- America
NewYork = iff(DST==0,"0400-1500","0500-1600")
//--- Pacific
Sydney = iff(DST==0,"1300-2200","1400-2300")
//--- Asia
Tokyo = iff(DST==0,"1500-2400","1600-0100")

//-- Time In Range
timeinrange(res, sess) => time(res, sess) != 0

london = timeinrange(timeframe.period, London)
newyork = timeinrange(timeframe.period, NewYork)

time_cond = true


myPeriod = input(defval=14, type=input.integer, title="Period")
myThresholdUp = input(defval=75, type=input.float, title="Upper Threshold")
myThresholdDn = input(defval=25, type=input.float, title="Lower Threshold")
myAlgoFlipToggle = input(defval=false, type=input.bool, title="Imverse Algorthim")
myLineToggle = input(defval=true, type=input.bool, title="Show Lines")
myLabelToggle = input(defval=true, type=input.bool, title="Show Labels")
myRSI=rsi(close, myPeriod)
buy = myAlgoFlipToggle ? falling(myRSI,1) and cross(myRSI, myThresholdDn) : rising(myRSI, 1) and cross(myRSI,myThresholdUp) //and time_cond
sell = myAlgoFlipToggle ? rising(myRSI, 1) and cross(myRSI,myThresholdUp) : falling(myRSI,1) and cross(myRSI, myThresholdDn) //and time_cond
myPosition = 0
myPosition := buy==1 ? 0 : sell==1 or myPosition[1]==1 ? 1 : 0
trendColor = buy ? color.red : sell ? color.green : na
plot(myLineToggle ? buy and myPosition[1]==1 ? low - 0.004: sell and myPosition[1]==0 ? high + 0.004 : na : na, color=trendColor, style=plot.style_line, linewidth=4, editable=false)
plotshape(myLabelToggle ? buy and myPosition[1]==1 ? low - 0.005 : na : na, style=shape.labelup, location=location.absolute, text="Buy", transp=0, textcolor = color.white, color=color.black, editable=false)
plotshape(myLabelToggle ? sell and myPosition[1]==0 ? high + 0.005 : na : na, style=shape.labeldown, location=location.absolute, text="Sell", transp=0, textcolor = color.white, color=color.black, editable=false)

strategy.initial_capital = 50000
    //Calculate the size of the next trade
balance = strategy.netprofit + strategy.initial_capital //current balance
floating = strategy.openprofit          //floating profit/loss
risk = input(2,type=input.float,title="Risk %")/100           //risk % per trade
isTwoDigit = input(false,"Is this a 2 digit pair? (JPY, XAU, XPD...")


stop = input(250, title="stop loss pips")
tp = input(2500, title="take profit pips")
if(isTwoDigit)
    stop := stop/100

temp01 = balance * risk     //Risk in USD
temp02 = temp01/stop        //Risk in lots
temp03 = temp02*100000      //Convert to contracts
size = 1

strategy.entry("long",1,size,when=buy and myPosition[1]==1 )
strategy.entry("short",0,size,when=sell and myPosition[1]==0)

strategy.exit("exit_long","long",loss=stop, profit=tp)      //Long exit (stop loss)
strategy.exit("exit_short","short",loss=stop, profit=tp)      //Short exit (stop loss)

//strategy.close_all(when= not time_cond)