개요
모멘텀 인디케이터 크로스오버 전략 (Momentum Indicator Crossover Strategy) 은 지수 이동 평균 (Exponential Moving Average, EMA) 과 상대적으로 약한 지수 (Relative Strength Index, RSI) 의 신호를 결합한 거래 방법이다. 이 전략은 두 개의 EMA 선의 교차를 사용하여 구매 및 판매 신호를 생성하여 금융 시장에서 거래하는 것을 목표로 한다.
전략 원칙
이 전략의 핵심은 EMA의 느리고 빠른 라인 크로스 시스템이다. 이 전략은 세 가지 다른 파라미터를 가진 EMA 라인을 정의한다:ema1、ema2그리고ema3그 중,ema1그리고 그 결과로,ema2중장기적 추세입니다.ema3장기 트렌드를 나타냅니다. 단기 트렌드가 중기 트렌드를 뚫을 때 구매 신호를 생성합니다. 단기 트렌드가 중기 트렌드를 뚫을 때 판매 신호를 생성합니다.
오류 진단 신호를 필터링하기 위해 정책은 두 가지 추가 조건을 정의합니다.bodybar1 > bodybar2그리고close > entrybar(구매 신호) 또는close < entrybar(Sell Signal) ᅳ 이것은 가장 가까운 두 개의 K 선의 실체 길이 관계가 신호의 방향과 일치하고, 가격이 입시점을 돌파하여 재입시를 방지한다.
또한, 전략은 RSI 지표 evalue와 결합되어 RSI 고위 영역은 과매매 신호를 정의하고 RSI 낮은 영역은 과매매 신호를 정의합니다. 이것은 가격 과열과 과냉한 시장에서 잘못된 신호를 피하는 데 도움이됩니다.
우위 분석
이 전략은 다음과 같은 장점을 가지고 있습니다.
- 사용방법은 간단하고, 사용자가 복잡한 지표들을 숙지할 필요 없이 사용할 수 있다.
- 투자금의 비율에 따라 포지션 크기를 유연하게 조정할 수 있습니다.
- EMA는 RSI 필터링과 결합하여 신호의 신뢰도를 높일 수 있습니다.
- 거래 논리는 명확하고, 이해하기 쉽고, 조정하기 쉽습니다.
위험 분석
이 전략에는 다음과 같은 위험도 있습니다.
- EMA 교차는 시장의 소음을 완전히 필터링 할 수 없으며 잘못된 신호를 발생시킬 수 있습니다.
- 고정된 파라미터의 EMA 라인은 실시간 시장 변화에 적응할 수 없다.
- 단편적 손실을 통제할 수 없는 상쇄 손실 논리가 없습니다.
- RSI 필터링 조건은 단일이며, 일부 기회를 놓칠 수 있습니다.
최적화 방향
이 전략은 다음과 같은 방향으로 최적화될 수 있습니다.
- 시장의 변동율과 거래 유형에 따라 EMA 매개 변수를 조정하여 매개 변수의 실시간성을 향상시킵니다.
- MACD, 브린 띠 등과 같은 다른 지표와 결합하여 복수의 필터링을 통해 가짜 신호를 줄일 수 있다.
- 트래킹 스톱로스, 수익 스톱 기능, 거래 위험을 제어하는 기능
- RSI의 필터링 논리를 최적화하여 전략의 전반적인 안정성을 향상시킵니다.
- 기계 학습 기술과 결합된 동적 최적화 전략 파라미트.
요약하다
동력 지표 교차 전략은 EMA와 RSI의 장점을 통합하여 지표 교차를 기반으로 거래 신호를 형성한다. 이 전략은 간단하고 실용적이며 초보자에게 적합하며 실제 필요에 따라 확장 및 최적화하여 전략의 효과를 향상시킬 수 있다. 엄격한 위험 관리를 통해 이 전략은 안정적인 초과 수익을 얻을 것으로 보인다.
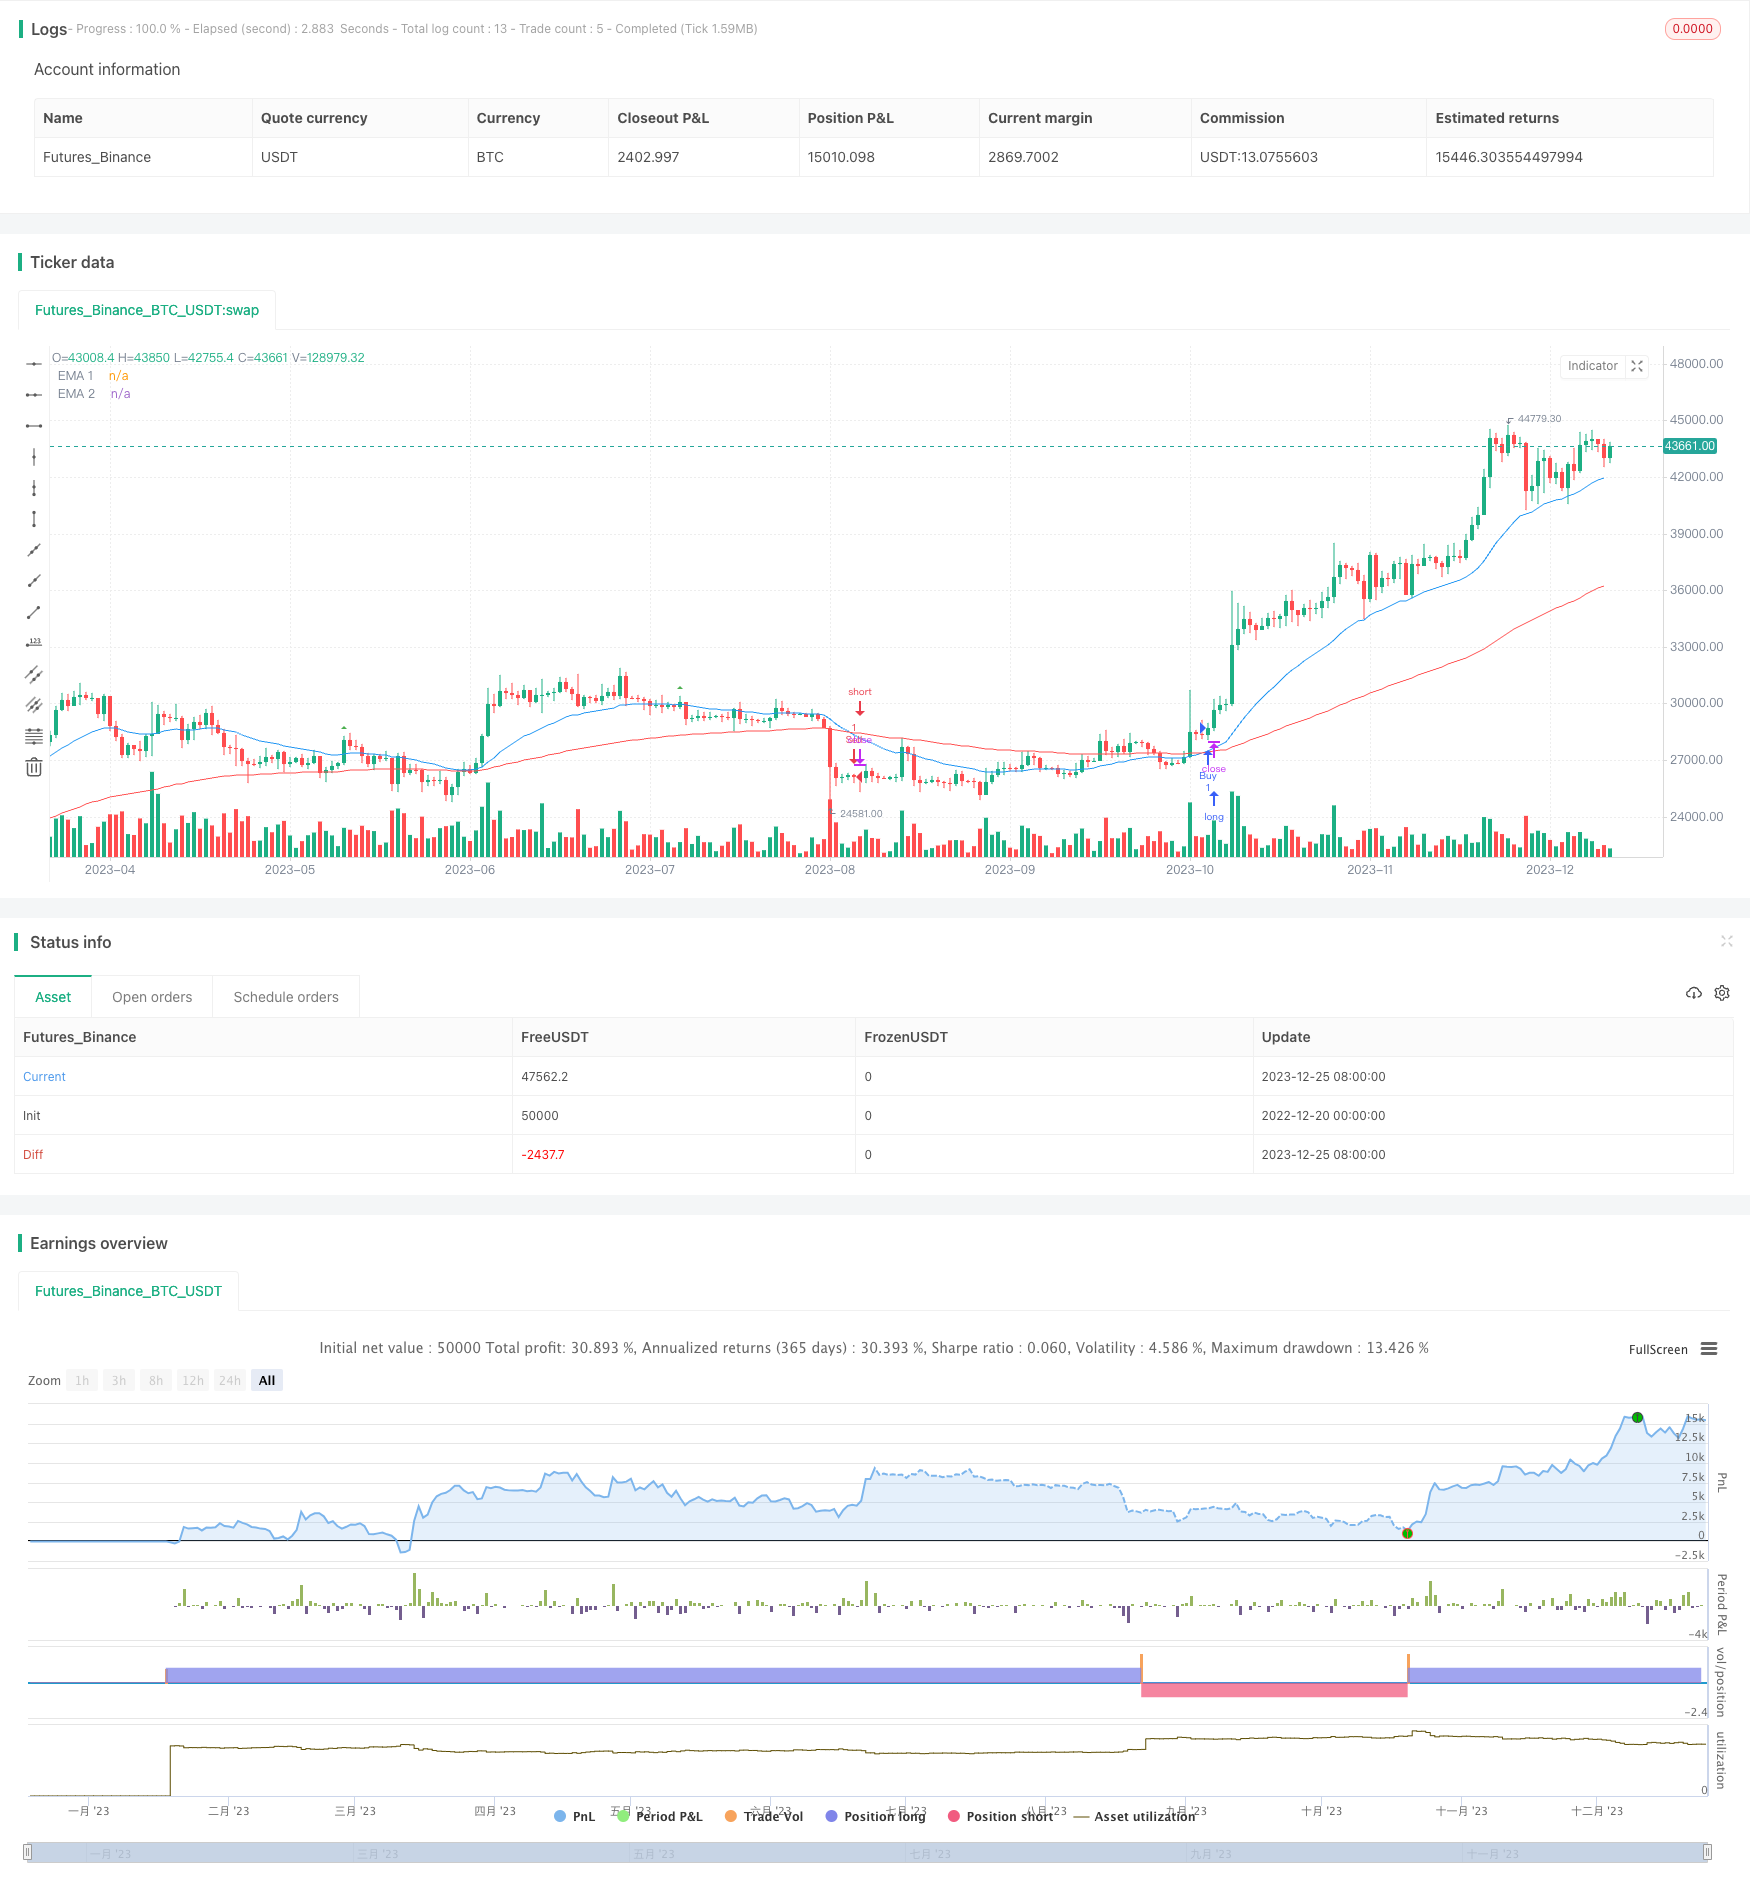
/*backtest
start: 2022-12-20 00:00:00
end: 2023-12-26 00:00:00
period: 1d
basePeriod: 1h
exchanges: [{"eid":"Futures_Binance","currency":"BTC_USDT"}]
*/

//@version=5
strategy('EMA Crossover Strategy', shorttitle='EMA Crossover', overlay=true)


// Define input for position size as a percentage of equity
position_size_pct = input(1, title='Position Size (%)') / 100

//Input EMA
len1 = input.int(25, minval=1, title='EMA 1')
src1 = input(close, title='Source')
ema1 = ta.ema(src1, len1)
len2 = input.int(100, minval=1, title='EMA 2')
src2 = input(close, title='Source')
ema2 = ta.ema(src2, len2)
len3 = input.int(200, minval=1, title='EMA 3')
src3 = input(close, title='Source')
ema3 = ta.ema(src3, len3)
//End of format

//Format RSI
lenrsi = input(14, title='RSI length')
outrsi = ta.rsi(close,lenrsi)
//plot(outrsi, title='RSI', color=color.new(color.blue, 0), linewidth=1)

//hline(70, 'Overbought', color=color.red)
//hline(30, 'Oversold', color=color.green)
//End of format


bodybar1 = math.abs(close - open)
bodybar2 = math.abs(close[1] - open[1])
// Plot the EMAs
plot(ema1, color=color.new(color.blue, 0), title='EMA 1')
plot(ema2, color=color.new(color.red, 0), title='EMA 2')
//plot(ema3, color=color.new(#ffffff, 0), title='EMA 3')

// EMA Crossover conditions
emaCrossoverUp = ta.crossover(ema1, ema2)
emaCrossoverDown = ta.crossunder(ema1, ema2)

var entrybar = close  // Initialize entrybar with the current close


// Calculate crossovers outside of the if statements
emaCrossoverUpOccured = ta.crossover(close, ema1) and ema1 > ema2 and bodybar1 > bodybar2 and close > entrybar
emaCrossoverDownOccured = ta.crossunder(close, ema1) and ema1 < ema2 and bodybar1 > bodybar2 and close < entrybar

plotshape(series=emaCrossoverUpOccured, location=location.abovebar, color=color.new(color.green, 0), style=shape.triangleup, title='New Buy Order', size=size.tiny)
plotshape(series=emaCrossoverDownOccured, location=location.belowbar, color=color.new(color.red, 0), style=shape.triangledown, title='New Sell Order', size=size.tiny)

// Define trading logic with custom position size and RSI conditions
if emaCrossoverUp or emaCrossoverUpOccured
    strategy.entry('Buy', strategy.long)
    entrybar := close  // Update entrybar when entering a new buy position
    entrybar

if emaCrossoverDown or emaCrossoverDownOccured
    strategy.entry('Sell', strategy.short)
    entrybar := close  // Update entrybar when entering a new sell position
    entrybar