개요
이 전략은 전날 거래의 최고 가격, 최저 가격, 그리고 종결 가격으로 계산된 지지부진한 지위를 기반으로, 현재 거래의 날에 긴 위치 또는 짧은 위치의 작업을 수행합니다. 가격이 상위 지지부진 R1을 돌파 할 때, 더 많은 것을하고, 가격이 하위 지지부진 S1을 넘어서는 경우, 공백을합니다. 이 전략은 동적 지지부진 전략에 속합니다.
전략 원칙
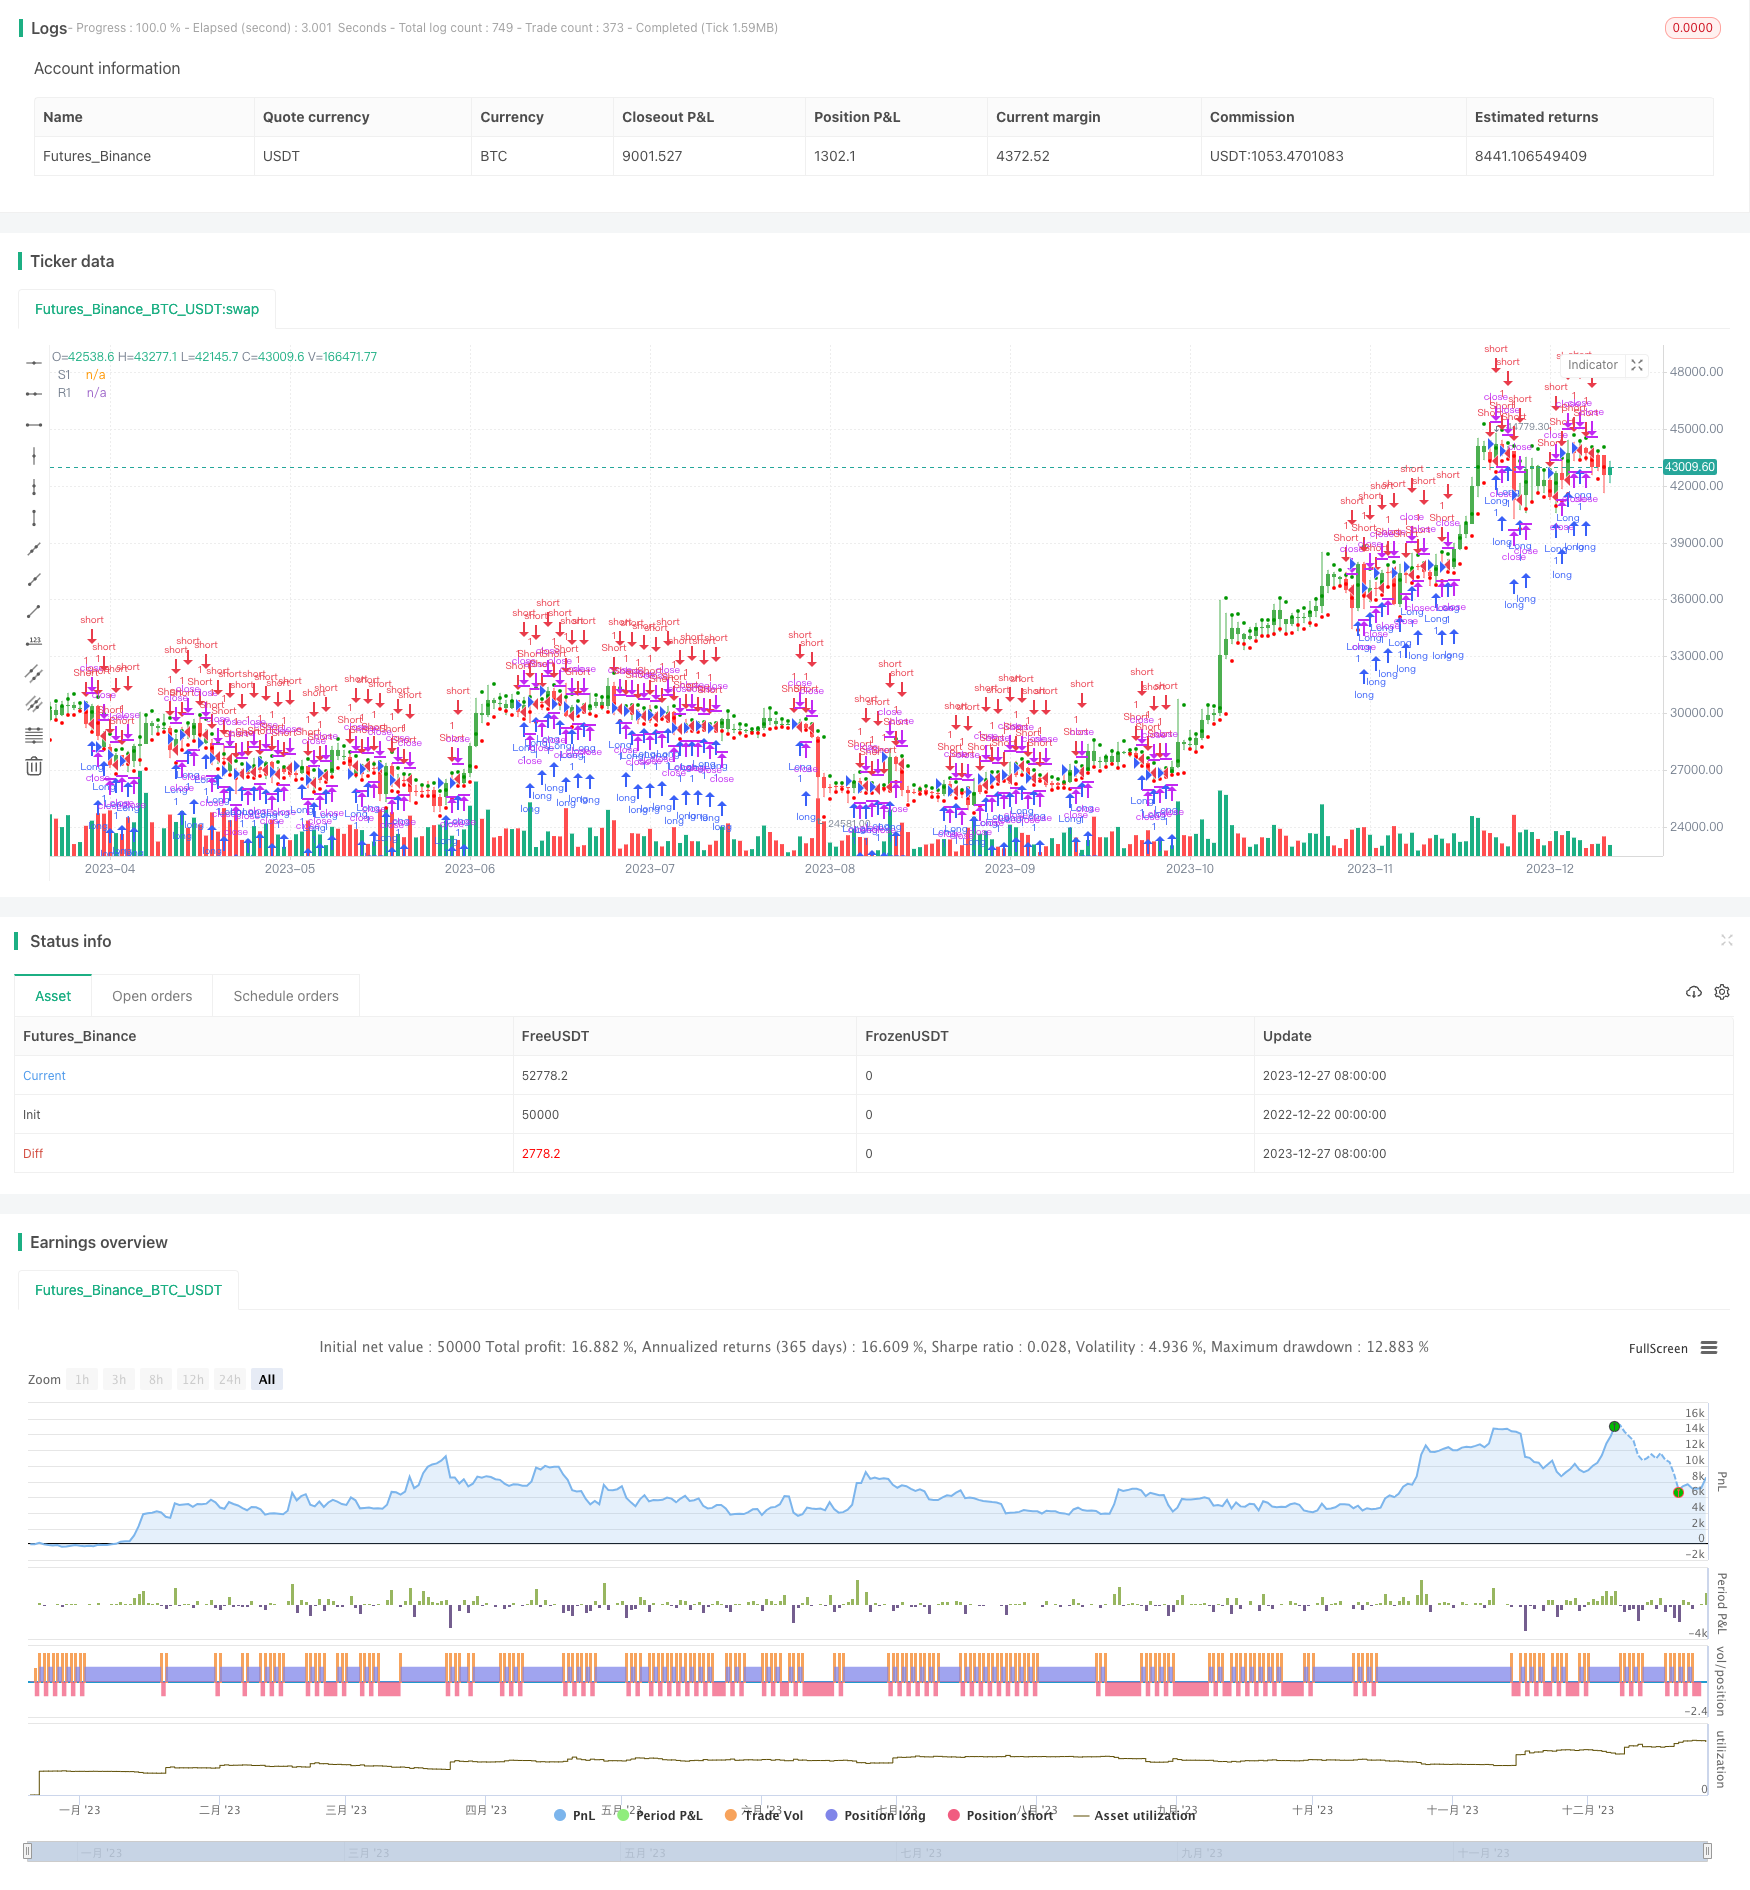
- 전날 거래의 최고 가격 xHigh, 최저 가격 xLow, 그리고 종점 가격 xClose를 기준으로 당일 지지점 S1, 저항점 R1, 그리고 축점 vPP를 계산한다.
vPP = (xHigh+xLow+xClose) / 3
vR1 = vPP+(vPP-xLow)
vS1 = vPP-(xHigh - vPP)
- 가격이 vR1 또는 vS1을 돌파하는지 판단하고, vR1을 돌파하면 더하고, vS1을 넘어지면 공백하십시오. POS 기록은 더 많은 공백 방향을하십시오.
pos = iff(close > vR1, 1,
iff(close < vS1, -1, nz(pos[1], 0)))
possig 실제 거래 방향을 기록한다. 역전 거래 reverse=true를 열면 거래 신호가 반전된다.
포시그 신호에 따르면, vR1을 돌파할 때 더하고, vS1을 돌파할 때 공백한다.
전략적 이점
- 이 전략은 역동적인 지지/저항 지표를 활용하여 돌파구를 포착할 수 있습니다.
- 지원 저항 지점은 매일 업데이트되며, 동적으로 작동합니다.
- 상향 거래 또는 역거래를 선택할 수 있으며, 다양한 시장 환경에 적용된다.
- 전략은 간단하고 명확하며, 실행을 이해하기 쉽습니다.
- 시각적으로 지지 저항 지점을 표시하고, 직관적으로 추세가 전환되었다는 것을 판단한다.
위험 분석
- 시장이 흔들리면 불필요한 매매 신호가 반복될 수 있습니다.
- 만약 비정상적인 경향성이 나타나면, 지지 저항이 깨진 후 계속 확장되어 손실을 초래할 수 있다.
- 축점과 지지 저항 지점 계산 방법은 비교적 간단하며, 추가적으로 최적화될 예정이다.
위험 해결 방법:
- 지분 규모를 적절히 조정하여 단기 손실을 통제하십시오.
- 스톱로스를 설정하여 감당할 수 있는 손실을 피하십시오.
- 다른 지표와 함께 신호를 필터링하여, 불안정한 상황에서 자주 거래하는 것을 피하십시오.
최적화 방향
- 지원 저항점의 계산 방법을 최적화하여 더 예측할 수 있도록 한다.
- 트렌드, 모멘텀 등에 대한 조합을 늘리고, 불필요한 거래를 피한다.
- 더 많은 손실을 막고, 단위와 최대 손실을 통제하는 전략
- 기계학습 방법과 결합하여 저항비트 계산을 동적으로 최적화 할 수 있습니다.
요약하다
이 전략은 동적 지원 저항 지표에 기반하여 가격 돌파의 방향에 따라 포지션을 유지한다. 전략 아이디어는 간단하고 이해하기 쉽고 실행할 수 있으며, 트렌드의 전환점을 효과적으로 포착할 수 있다. 그러나 또한 다른 지표와 함께 추가적인 최적화가 필요한 위험이 있습니다. 거래 신호를 더 정확하고 신뢰할 수 있도록.
전략 소스 코드
//@version=2
////////////////////////////////////////////////////////////
//  Copyright by HPotter v1.0 14/06/2018
// This Pivot points is calculated on the current day.
// Pivot points simply took the high, low, and closing price from the previous period and
// divided by 3 to find the pivot. From this pivot, traders would then base their
// calculations for three support, and three resistance levels. The calculation for the most
// basic flavor of pivot points, known as ‘floor-trader pivots’, along with their support and
// resistance levels.
//
// You can change long to short in the Input Settings
// WARNING:
// - For purpose educate only
// - This script to change bars colors.
////////////////////////////////////////////////////////////
strategy(title="Dynamic Pivot Point Backtest", shorttitle="Dynamic Pivot Point", overlay = true)
reverse = input(false, title="Trade reverse")
xHigh  = request.security(syminfo.tickerid,"D", high[1])
xLow   = request.security(syminfo.tickerid,"D", low[1])
xClose = request.security(syminfo.tickerid,"D", close[1])
vPP = (xHigh+xLow+xClose) / 3
vR1 = vPP+(vPP-xLow)
vS1 = vPP-(xHigh - vPP)
pos = iff(close > vR1, 1,
       iff(close < vS1, -1, nz(pos[1], 0)))
possig = iff(reverse and pos == 1, -1,
          iff(reverse and pos == -1, 1, pos))
if (possig == 1)
    strategy.entry("Long", strategy.long)
if (possig == -1)
    strategy.entry("Short", strategy.short)
barcolor(possig == -1 ? red: possig == 1 ? green : blue )
plot(vS1, color=#ff0000, title="S1", style = circles, linewidth = 1)
plot(vR1, color=#009600, title="R1", style = circles, linewidth = 1)