개요
이 전략은 보린 반지와 상대적으로 강한 지수 ((RSI)) 의 기술 지표를 사용하여 RSI 지표의 금포크 또는 사각지대가 발생했을 때 가격이 보린 반지를 터치하거나 돌파하여 구매 및 판매 신호를 발산하는지 판단합니다.
전략 원칙
20주기 SMA를 기본선으로 계산하고, 상반선은 기본선 + 2배 표준차, 하반선은 기본선 -2배 표준차로, 보린띠를 구성한다.
14주기 RSI값을 계산하면, RSI가 70보다 높으면 과매구역이고, 30 이하라면 과매구역이다.
RSI 지표가 30을 넘으면, 가격이 하위 궤도보다 낮으면, 구매 신호를 생성한다. RSI 지표가 70을 넘으면, 가격이 상위 궤도보다 높으면, 판매 신호를 생성한다.
우위 분석
보린띠는 표준차차 범위를 사용하여 가격 변동과 미래 움직임을 판단하고, 강한 추세를 판단하는 능력을 가지고 있다.
RSI 지표는 오버 바이와 오버 소드를 판단하고, 보링 밴드 궤도 판단과 결합하여, 역전 기회를 효과적으로 발견할 수 있다.
RSI 지표는 브레이크 신호를 형성하기 쉽고, 보린 띠와 결합하면 신호가 더 정확하고 신뢰할 수 있다.
위험 분석
보링벨트는 100% 정확하지 않으며, 가격이 상하철을 뚫고 계속 운행될 가능성이 있다.
RSI 지표는 보링띠 판단과 일치하지 않는 가짜 브레이크 신호를 형성할 수도 있다.
적절하게 조정된 파라미터는 매우 중요하며, 파라미터를 잘못 설정하면 거래 신호가 너무 자주 또는 드물게 발생할 수 있다.
최적화 방향
다양한 주기에서 변수를 테스트하여 최적의 변수 조합을 찾을 수 있다.
KD, MACD 등과 같은 다른 지표와 결합하여 신호의 신뢰성을 높일 수 있다.
재검토 결과를 바탕으로, 손해 중지 전략을 최적화하고, 위험을 통제할 수 있다.
요약하다
이 전략은 보린띠의 트렌드 분석과 RSI 지표의 오버 구매 오버 판매 판단을 통합하여 거래 신호를 형성한다. 전반적으로, 전략 아이디어는 명확하고, 실행하기 쉽고, 실제 가치가 있다. 그러나 특정 위험도 존재하며, 변수 조정과 지표 통합에 주의를 기울이고, 다양한 시장 환경에 적응하도록 지속적으로 최적화해야합니다.
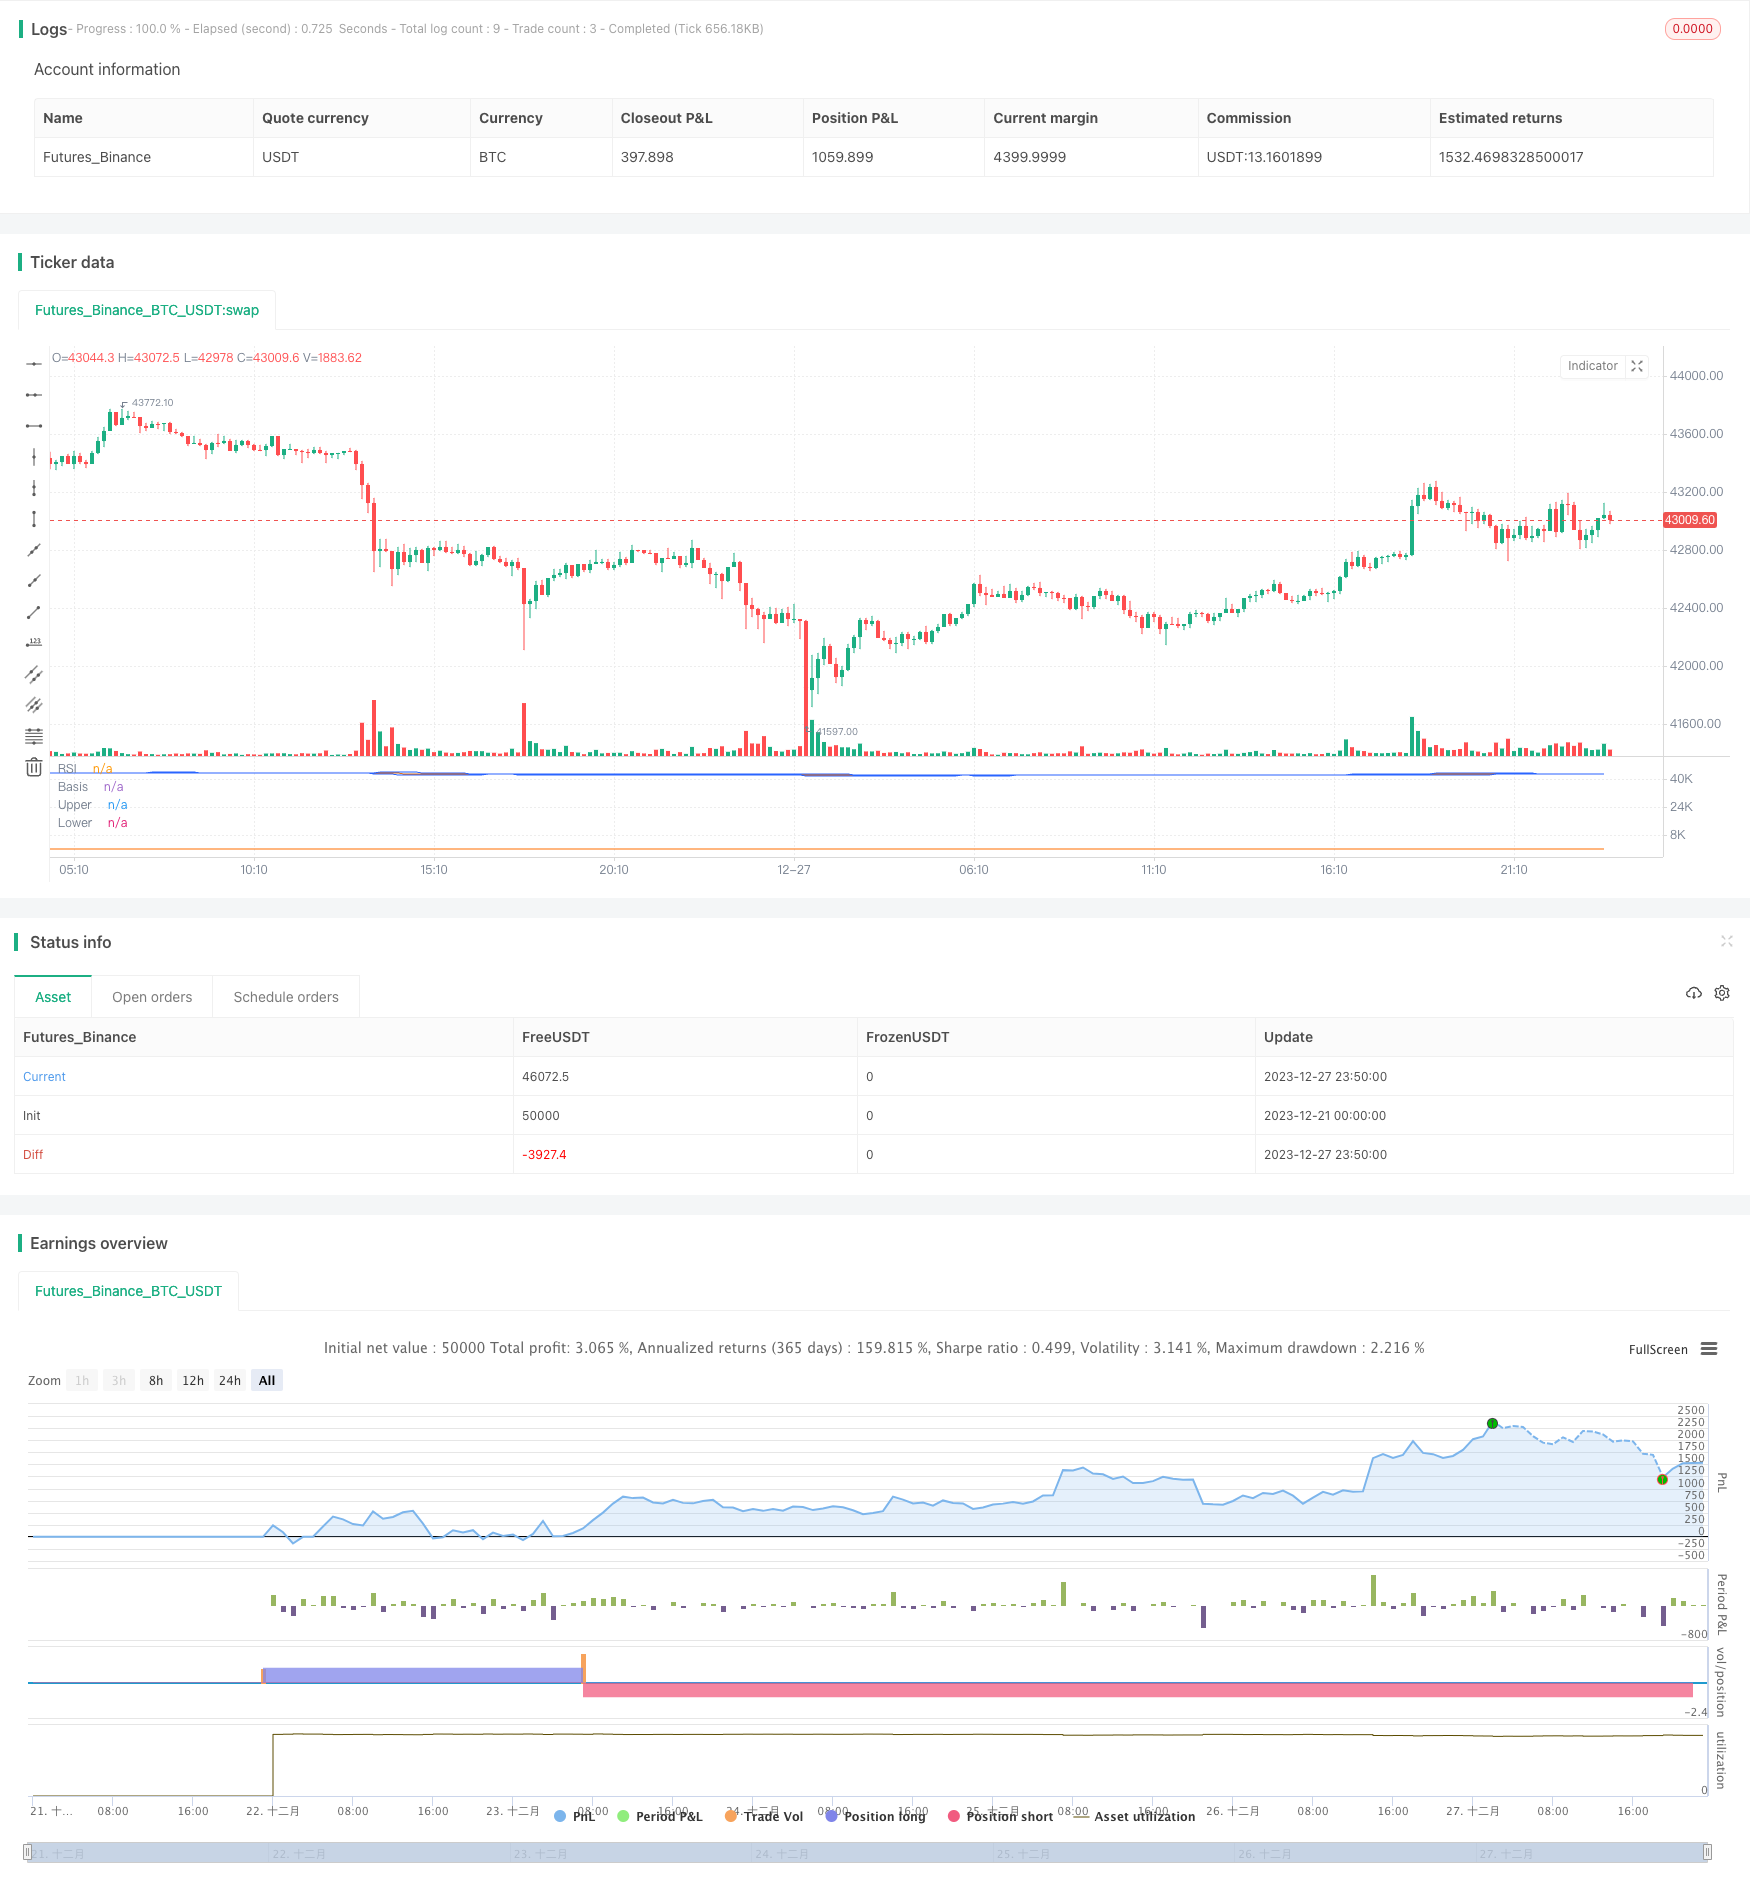
/*backtest
start: 2023-12-21 00:00:00
end: 2023-12-28 00:00:00
period: 10m
basePeriod: 1m
exchanges: [{"eid":"Futures_Binance","currency":"BTC_USDT"}]
*/

//@version=5
strategy("Bollinger Bands and RSI Strategy", overlay=false)

// Define the parameters
length = input.int(20, "Length", minval=1)
src = input(close, "Source")
mult = input.float(2.0, "StdDev", minval=0.001, maxval=50)
rsiLength = input.int(14, "RSI Length", minval=1)
rsiOverbought = input.int(70, "RSI Overbought Level", minval=1, maxval=100)
rsiOversold = input.int(30, "RSI Oversold Level", minval=1, maxval=100)

// Calculate the Bollinger Bands
basis = ta.sma(src, length)
dev = mult * ta.stdev(src, length)
upper = basis + dev
lower = basis - dev

// Plot the Bollinger Bands
plot(basis, "Basis", color=#FF6D00)
p1 = plot(upper, "Upper", color=#2962FF)
p2 = plot(lower, "Lower", color=#2962FF)
fill(p1, p2, color=color.rgb(33, 150, 243, 90), title="Background")

// Calculate the RSI
rsi = ta.rsi(src, rsiLength)

// Plot the RSI
plot(rsi, "RSI", color=#FF6D00)

// Define the entry and exit conditions
longCondition = ta.crossover(rsi, rsiOversold) and src < lower // Use ta.crossover here
if (longCondition)
    strategy.entry("Long", strategy.long)

shortCondition = ta.crossunder(rsi, rsiOverbought) and src > upper // Use ta.crossunder here
if (shortCondition)
    strategy.entry("Short", strategy.short)

// Plot the buy and sell signals
plotshape(longCondition, title="Buy", location=location.belowbar, color=color.green, style=shape.triangleup, size=size.small)
plotshape(shortCondition, title="Sell", location=location.abovebar, color=color.red, style=shape.triangledown, size=size.small)