요약
이 전략은 다중 시간 프레임 덱스 이동 평균 (MTF EMA) 의 트렌드 방향을 판단하고 MACD 지표의 구매/판매 신호를 생성하는 기능을 최대한 활용하며 ATR 지표와 결합하여 스톱-로스-스 가격을 설정합니다. 이 전략은 강력한 트렌드가있는 디지털 화폐와 정규 화폐 거래 쌍에 적합하며, 트렌드가 강한 시장에서 잘 작동합니다.
전략 원칙
1. MTF EMA 판단 경향
다시계 프레임임 지수 이동 평균 (MTF EMA) 은 동일한 차트에서 여러 시간 주기 이동 평균을 표시하여 자산의 전반적인 빈 상태를 판단할 수 있습니다. 전략은 1 시간 주기 및 15 분 주기 MTF EMA를 사용합니다.
가격이 1시간 MTF EMA보다 높고 1시간 MTF EMA가 15분 MTF EMA보다 낮으면 상승 추세로 정의되고; 가격이 1시간 MTF EMA보다 낮고 1시간 MTF EMA가 15분 MTF EMA보다 높으면 하향 추세로 정의된다.
2. MACD가 구매/판매 신호를 생성합니다.
MACD 라인이 아래쪽에서 Signal 라인을 돌파할 때, 구매 신호를 생성한다. 위쪽에서 아래로 떨어질 때, 판매 신호를 생성한다. 동시에 MACD 라인과 Signal 라인의 교차 제한 값을 설정하여 가짜 신호를 피한다.
3. ATR을 설정해
ATR 지표를 사용하여 스톱 스톱 가격을 설정한다. ATR은 시장의 변동성에 따라 합리적인 스톱 스톱 거리를 설정할 수 있다. 또한 높은 낮은 지점 재검토에 따라 스톱 스톱의 배수를 설정하여 스톱 스톱을 더 유연하게 설정한다.
거래 전략
포지션 개설 신호
멀티 헤드 신호: 상승 추세이며 MACD가 신호 라인을 통과하고 크로스 값이 제한 값보다 작습니다. 공백 신호: 하향 추세이며 MACD가 Signal 라인을 통과하고 크로스 값이 제한 값보다 크다
평점 신호
다중 머리 막대기: ATR 막대기를 넘었다 다중 상위 상장: ATR 상장 상장을 돌파 허드 스톱: ATR 스톱을 돌파했다. 빈 헤드 스톱: ATR 스톱을 돌파했다
우위 분석
이 전략의 가장 큰 장점은 MTF EMA 판단 트렌드 및 MACD 생성 구매 판매 신호의 장점을 최대한 활용하는 데 있습니다. MTF EMA는 전체 트렌드 방향을 명확하게 판단 할 수 있으며, 불안정한 상황에서 자주 거래하는 것을 피할 수 있습니다. MACD 지표는 단기 가격 상황의 변화를 더 잘 포착하여 구매 구매 신호를 생성합니다.
위험과 해결책
이 전략에는 크게 두 가지 위험이 있습니다. 첫째, 명백한 추세가 없을 때 MTF EMA는 잘못된 신호를 생성하여 손실을 초래할 수 있습니다. 둘째, MACD 지표는 가격이 크게 변할 때 종종 잘못된 신호를 생성하여 과다 거래가 발생할 수 있습니다. 첫 번째 위험에 대해 MTF EMA 매개 변수를 적절히 조정하여 가격 추세 변화에 더 잘 대응 할 수 있습니다.
최적화 방향
이 전략은 다음과 같은 부분에서 최적화될 수 있습니다.
MTF EMA의 주기적 변수를 조정하여 다른 거래 품종의 가격 특성에 더 잘 맞게합니다.
MACD 지표의 속속 평균선과 Signal 평균선 변수를 최적화하여 더 나은 신호를 얻습니다.
다양한 ATR 주기 변수와 스톱 스톱 손실 배수를 테스트하여 최적의 수익을 얻습니다.
다른 보조 지표 필터링 신호를 추가
요약하다
이 긴 공백 포지션 전략은 MTF EMA 판단 트렌드, MACD 생성 거래 신호 및 ATR 다이내믹 스톱 로즈 스톱의 방법을 통합하여 명백한 트렌드 시장에서 더 나은 수익을 얻을 수 있습니다. 이 전략은 최적화 공간이 넓고, 매개 변수를 조정하고 최적화하여 더 나은 성과를 얻을 수 있습니다. 그러나 위험을 관리하는 데 주의를 기울여야하며, 불안정한 상황에서 맹목적으로 거래하는 것을 피하십시오.
/*backtest
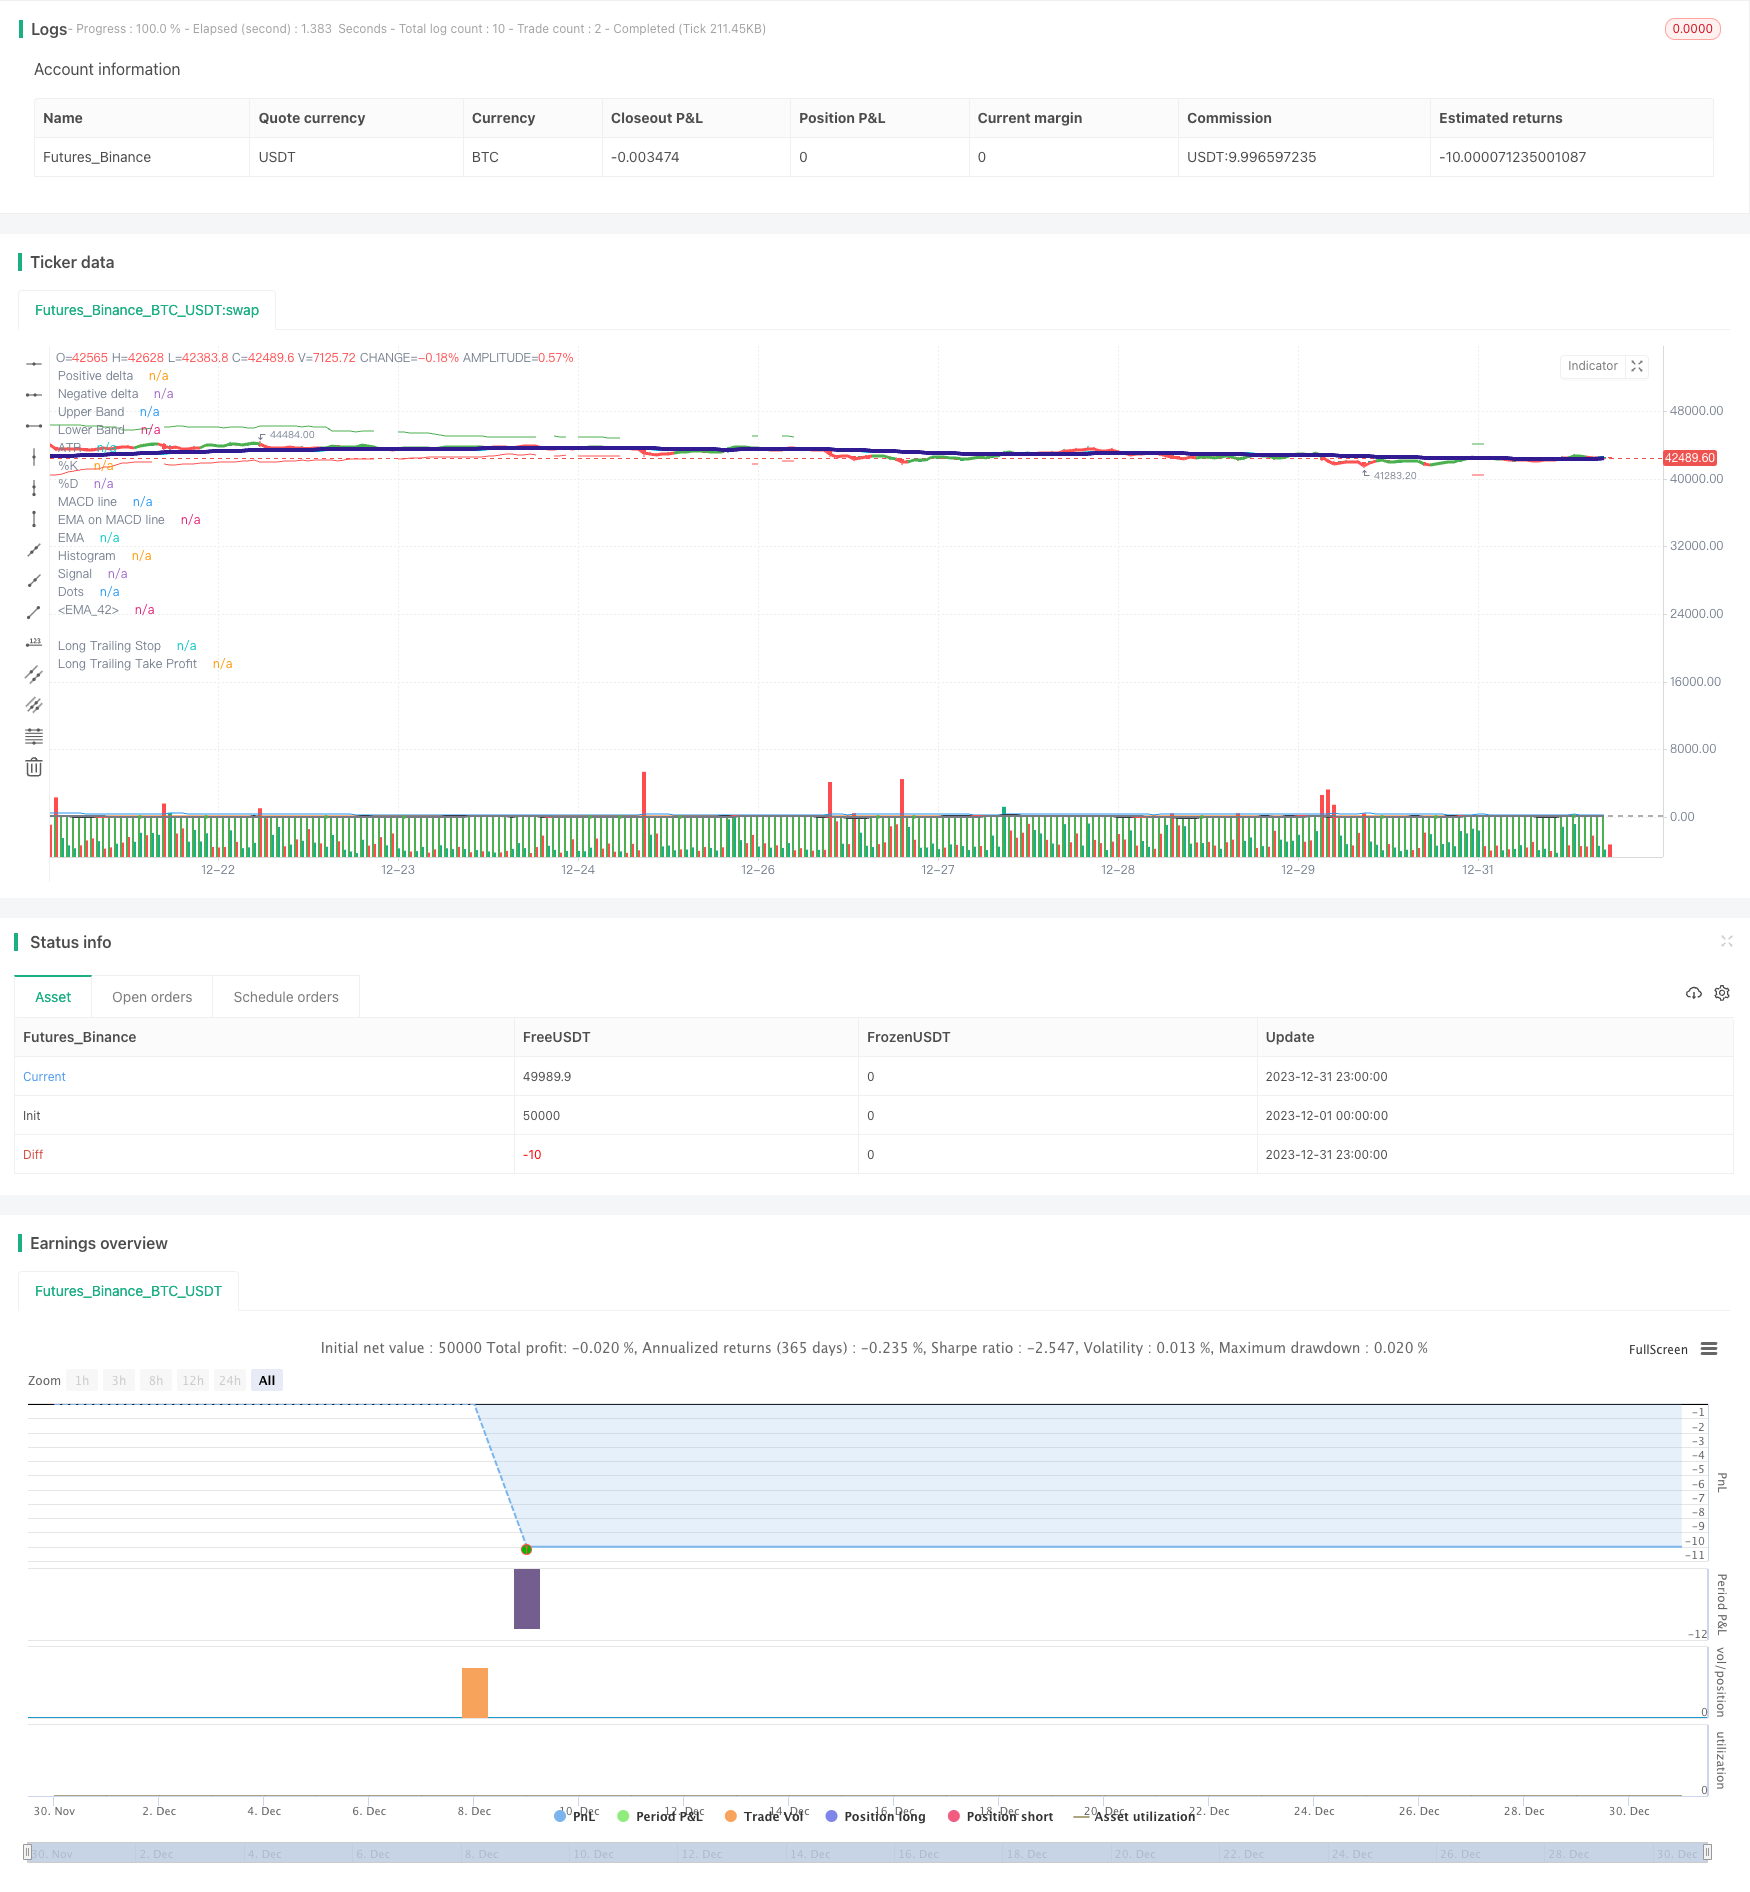
start: 2023-12-01 00:00:00
end: 2023-12-31 23:59:59
period: 1h
basePeriod: 15m
exchanges: [{"eid":"Futures_Binance","currency":"BTC_USDT"}]
*/
// This source code is subject to the terms of the Mozilla Public License 2.0 at https://mozilla.org/MPL/2.0/
// © Steven A. Zmuda Burke / stevenz17
//@version=4
// From Date Inputs
fromDay = input(defval = 01, title = "From Day", minval = 1, maxval = 31)
fromMonth = input(defval = 04, title = "From Month", minval = 1, maxval = 12)
fromYear = input(defval = 2022, title = "From Year", minval = 1970)
// To Date Inputs
toDay = input(defval = 01, title = "To Day", minval = 1, maxval = 31)
toMonth = input(defval = 05, title = "To Month", minval = 1, maxval = 12)
toYear = input(defval = 2022, title = "To Year", minval = 1970)
// Calculate start/end date and time condition
startDate = timestamp(fromYear, fromMonth, fromDay, 00, 00)
finishDate = timestamp(toYear, toMonth, toDay, 00, 00)
time_cond = true
// Input
strategy("LONG", overlay=true, initial_capital=1000, default_qty_type=strategy.percent_of_equity, default_qty_value=100, slippage=1, commission_type=strategy.commission.percent,
commission_value=0.015)
SOURCE = input(title = "═════════════════════ SOURCE ═════════════════════", defval = false, type = input.bool)
sourcehl2 = input(title="Source hl2 or (open+close)/2 ?",type=input.bool,defval=true)
source = sourcehl2 ? hl2 : ((open+close)/2)
//MTF EMA
MTFEMA = input(title = "════════════════════ MTF EMA ════════════════════", defval = false, type = input.bool)
res1=input(title="MTF EMA 1", type=input.resolution, defval="60")
len1 = input(title = "EMA Period 1", type=input.integer, defval=70, minval=1)
ema1 = ema(source, len1)
emaStep1 = security (syminfo.tickerid, res1, ema1, barmerge.gaps_off, barmerge.lookahead_off)
mtf1 = emaStep1
res2=input(title="MTF EMA 2", type=input.resolution, defval="15")
len2 = input(title = "EMA Period 2", type=input.integer, defval=68, minval=1)
ema2 = ema(source, len2)
emaStep2 = security (syminfo.tickerid, res2, ema2, barmerge.gaps_off, barmerge.lookahead_off)
mtf2 = emaStep2
t1 = plot(mtf1, linewidth=4, color= color.aqua, title="EMA")
t2 = plot(mtf2, linewidth=4, color= color.navy, title="EMA")
fill(t1, t2, transp = 70, color = mtf1 > mtf2 ? color.red : color.green)
///MACD
MACD= input(title = "═════════════════════ MACD ══════════════════════", defval = false, type = input.bool)
MACDsource=close
fastLength = input(13, minval=1, title="MACD fast moving average")
slowLength=input(18,minval=1, title="MACD slow moving average")
signalLength=input(24,minval=1, title="MACD signal line moving average")
MacdEmaLength =input(9, title="MACD EMA period", minval=1)
useEma = input(true, title="Use EMA (otherwise SMA)")
useOldAlgo = input(false, title="Use normal MACD")
Lmacsig=input(title="LONG MACD and signal crossover limit",type=input.integer,defval=180)
// Fast line
ma1= useEma ? ema(MACDsource, fastLength) : sma(MACDsource, fastLength)
ma2 = useEma ? ema(ma1,fastLength) : sma(ma1,fastLength)
fastMA = ((2 * ma1) - ma2)
// Slow line
mas1= useEma ? ema(MACDsource , slowLength) : sma(MACDsource , slowLength)
mas2 = useEma ? ema(mas1 , slowLength): sma(mas1 , slowLength)
slowMA = ((2 * mas1) - mas2)
// MACD line
macd = fastMA - slowMA
// Signal line
emasig1 = ema(macd, signalLength)
emasig2 = ema(emasig1, signalLength)
signal = useOldAlgo ? sma(macd, signalLength) : (2 * emasig1) - emasig2
hist = macd - signal
histline = hist > 0 ? color.green : color.red
//MACD ribbon
macdribbon=input(title="Show MACD ribbon?",type=input.bool,defval=false)
macdx=input(title="MACD ribbon multiplier", type=input.integer, defval=3, minval=1)
leadLine1 = macdribbon ? macd*macdx + source : na
leadLine2 = macdribbon ? signal*macdx + source : na
leadLine3 = hist + source
//MACD plot
p3 = plot(leadLine1, color= color.green, title="MACD", transp = 100, linewidth = 8)
p4 = plot(leadLine2, color= color.red, title="Signal", transp = 100, linewidth = 8)
fill(p3, p4, transp = 20, color = leadLine1 > leadLine2 ? #53b987 : #eb4d5c)
plot((leadLine3), color = histline, title="Histogram", linewidth = 3)
l="TEst"
upHist = (hist > 0) ? hist : 0
downHist = (hist <= 0) ? hist : 0
p1 = plot(upHist, color=color.green, transp=40, style=plot.style_columns, title='Positive delta')
p2 = plot(downHist, color=color.green, transp=40, style=plot.style_columns, title='Negative delta')
zeroLine = plot(macd, color=color.black, transp=0, linewidth=2, title='MACD line')
signalLine = plot(signal, color=color.gray, transp=0, linewidth=2, title='Signal')
ribbonDiff = color.green
fill(zeroLine, signalLine, color=ribbonDiff)
circleYPosition = signal
plot(ema(macd,MacdEmaLength) , color=color.red, transp=0, linewidth=2, title='EMA on MACD line')
ribbonDiff2 = hist > 0 ? color.green : color.red
plot(crossunder(signal,macd) ? circleYPosition : na,style=plot.style_circles, linewidth=4, color=ribbonDiff, title='Dots')
//STOCHASTIC
stochchch= input(title = "═══════════════════ STOCHASTIC ════════════════════", defval = false, type = input.bool)
StochOn = input(title="Stochastic On?",type=input.bool,defval=true)
periodK = input(10, title="K", minval=1)
periodD = input(1, title="D", minval=1)
smoothK = input(3, title="Smooth", minval=1)
stochlimit = input(30, title="Stoch value crossover", minval=1)
k = sma(stoch(close, high, low, periodK), smoothK)
d = sma(k, periodD)
stochSignal = StochOn ? (d < stochlimit ? true : false) : true
pp= input(1, title="avg price length", minval=1)
p = ema (source, pp)
K = k + p
plot(k, title="%K", color=#0094FF)
plot(d, title="%D", color=#FF6A00)
h0 = hline(72, "Upper Band", color=#606060)
h1 = hline(20, "Lower Band", color=#606060)
fill(h0, h1, color=#9915FF, transp=80, title="Background")
//Long
LS= "════════════════════════════════ LONG CONDITIONS ═══════════════════════════"
uptrend = close > mtf1 and mtf1 < mtf2
downtrend = close < mtf1 and mtf1 > mtf2
crossMACD = crossunder(macd,signal)
LongBuy = uptrend and stochSignal? crossMACD and signal < Lmacsig and macd < Lmacsig : na
LONG = strategy.position_size > 0
SHORT = strategy.position_size < 0
FLAT = strategy.position_size == 0
plotshape(LongBuy, style=shape.xcross, text="LONG", color=color.green)
//ATR & TP/SL
ATRTPSLX= input(title = "═════════════════ LONG SL ═════════════════", defval = false, type = input.bool)
maxIdLossPcnt = input(5, "Max Intraday Loss(%)", type=input.float, minval=0.0, step=0.1)
// strategy.risk.max_intraday_loss(maxIdLossPcnt, strategy.percent_of_equity)
SSL2=input(title="Long Stop Loss when MTF EMA cross?",type=input.bool,defval=false)
SSLOP = LONG and crossunder(source, mtf1)
SlossPercOn = input(title="Long Stop Loss (%) on?",type=input.bool,defval=false)
SlossPerc = input(title="Long Stop Loss (%)", type=input.float, minval=0.0, step=0.1, defval=4.7) * 0.01
SSpricePerc = LONG and SlossPercOn? strategy.position_avg_price * (-1 - SlossPerc) : na
plot(series = SSpricePerc, linewidth=2, color= color.maroon,style=plot.style_linebr, title="Long Stop Loss %")
SSLX = LONG and crossunder(source, SSpricePerc)
SSLatr= input(title="Long Stop Loss ATR?",type=input.bool,defval=true)
useStructure=input(title="Look back for High/Lows?",type=input.bool,defval=true)
Slookback=input(title="How far to look back for High/Lows:",type=input.integer,defval=18,minval=1)
SatrLenghth=input(title="Long ATR Lenghth",type=input.integer,defval=9,minval=1)
SatrStopMultiplier=input(title="Long ATR Stop x ?", type=input.float,defval=4.3, minval=0.1,step=0.1)
Satr = atr(SatrLenghth)
LongStop = SSLatr ? ((useStructure ? lowest(low, Slookback) : source) - Satr * SatrStopMultiplier) : na
SStop = crossunder(source,LongStop)
plot(Satr, color=color.blue, title="ATR", transp=100)
plot(series = uptrend ? LongStop : na, color=color.red, style=plot.style_linebr, title="Long Trailing Stop", transp=0)
ATRTPSLXX= input(title = "═════════════════ LONG TP ═════════════════", defval = false, type = input.bool)
TpPercOn = input(title="Long Take Profit (%) on?",type=input.bool,defval=true)
TpPerc = input(title="Long Take Profit (%)", type=input.float, minval=0.0, step=0.1, defval=5.3) * 0.01
TppricePerc = LONG and TpPercOn? strategy.position_avg_price * (-1 + TpPerc) : na
plot(series = TppricePerc, linewidth=2, color= color.lime,style=plot.style_linebr, title="Long Take Profit %")
TPLX = LONG and crossunder(source, TppricePerc)
TP1=input(title="1 Long Take Profit On?",type=input.bool,defval=true)
useStructure1=input(title="Look back for High/Lows?",type=input.bool,defval=true)
STplookback=input(title="How far to look back for High/Lows for 1 TP",type=input.integer,defval=12,minval=1)
STpatrLenghth=input(title="Long ATR Lenghth 1 TP",type=input.integer,defval=24,minval=1)
SatrProfitMultiplier = input(title="First Long ATR Take Profit x ?", type=input.float,defval=5.5, minval=0.1,step=0.1)
STpatr = atr(STpatrLenghth)
LongTakeProfit = (useStructure1 ? highest(high, STplookback) : source) + STpatr * SatrProfitMultiplier
LongTP = TP1 ? crossover(source, LongTakeProfit): false
plot(series = uptrend ? LongTakeProfit: na , color=color.green, style=plot.style_linebr, title="Long Trailing Take Profit", transp=0)
// Bar color
barcolor(cross(macd, signal) ? (macd - signal > 0 ? (uptrend and macd < 0 and signal < 0 ? color.yellow : na) : (downtrend and macd > 0 and signal > 0 ? color.blue : na)) : na)
// Strategy ATR
GOLONG = LongBuy and SSLatr and FLAT
if GOLONG and TP1
strategy.entry(id="Entry LONG 1TP", long=true,comment="Entry Long")
strategy.exit("Long Profit or Loss 1TP","Entry LONG 1TP", limit=LongTakeProfit, stop=LongStop)
if SSLX
strategy.close(id="Entry LONG 1TP", comment="% Long SL EXIT")
if TPLX
strategy.close(id="Entry LONG 1TP", comment="% Long TP EXIT")
if SSLOP and SSL2
strategy.close(id="Entry LONG 1TP", comment="MTF EMA cross EXIT")
if (not time_cond)
strategy.close_all()
strategy.cancel_all()
//plot(strategy.equity, title="equity", color=red, linewidth=2, style=areabr)
//@version=4