개요
광대역 돌파 전략은 트렌드 추적 전략이다. 그것은 진입과 진출의 시기를 결정하기 위해 변동률 범위를 사용합니다. 구체적으로, 그것은 가격의 돌파를 판단하기 위해 브린 밴드의 상승과 하락을 사용합니다. 가격이 상승할 때 더 많은 것을하고, 가격이 하락할 때 평지합니다.
전략 원칙
이 전략은 브린 띠 지표에 기초한다. 브린 띠는 세 개의 선을 포함한다:
- 중간선 - n일 간편 이동 평균
- 상도 - 중도 + k * n 일 표준차
- 하도선 - 중도선 - k * n 일 표준차
여기서 k의 값은 일반적으로 1.5 또는 2을 니다. 가격이 궤도를 돌파할 때, 주식이 강점 영역에 들어간다는 것을 나타냅니다. 더 많이; 가격이 궤도를 내려갈 때, 주식이 약점 영역에 들어간다는 것을 나타냅니다.
이 전략은 20일 중선과 1.5배의 표준 차점을 사용하여 브린 대역을 구성한다. 가격이 상회할 때 더 많이 할 때, exited는 두 가지 선택이 있습니다:
- 하계 손실 사용
- 중선 상쇄를 사용
높은 변동성이 있는 주식이라면, 하단 궤도 중지 효과를 사용하는 것이 더 낫다.
우위 분석
이 전략은 다음과 같은 장점을 가지고 있습니다.
- 가격 동향을 효과적으로 추적하고, 돌파 신호를 적시에 잡을 수 있습니다.
- 진동률 범위를 사용하여 진입 지점을 결정하여 소음을 효과적으로 필터링 할 수 있습니다.
- prebuiltr 두가지의 손실방법, 주식의 특성에 따라 최적의 옵션을 선택할 수 있다
위험 분석
이 전략에는 몇 가지 위험도 있습니다.
- 브레이크 신호는 가짜 브레이크가 될 수 있고, 트렌드를 효과적으로 추적할 수 없습니다.
- 부적절한 스톱포인트 설정으로 과도한 스톱포드가 발생할 수 있습니다.
- 시장의 정리를 효율적으로 처리할 수 없습니다.
이러한 위험은 최적화 변수와 다른 지표와 결합하여 줄일 수 있습니다.
최적화 방향
이 전략은 다음과 같은 부분에서 최적화될 수 있습니다.
- 부린 띠의 변수를 최적화하여 최적의 변수 조합을 찾습니다.
- 거래량과 같은 지표와 결합하여 브레이크 신호의 신뢰성을 검증합니다.
- 다른 지표들을 사용하여 필터링 메커니즘을 구축하여 가짜 침입을 방지합니다.
- 동적으로 스톱 포지션을 조정하여 스톱 리스크를 감소시킵니다.
요약하다
광대역 돌파구 전략은 전체적으로 고전적인 트렌드 추적 전략이다. 그것은 변수 최적화 및 규칙 최적화를 통해 개선되어 다른 시장 환경에 더 잘 적응할 수 있다. 이 전략은 이해하기 쉽고 구현할 수 있으며, 양적 거래를 위한 훌륭한 입문 전략이다.
전략 소스 코드
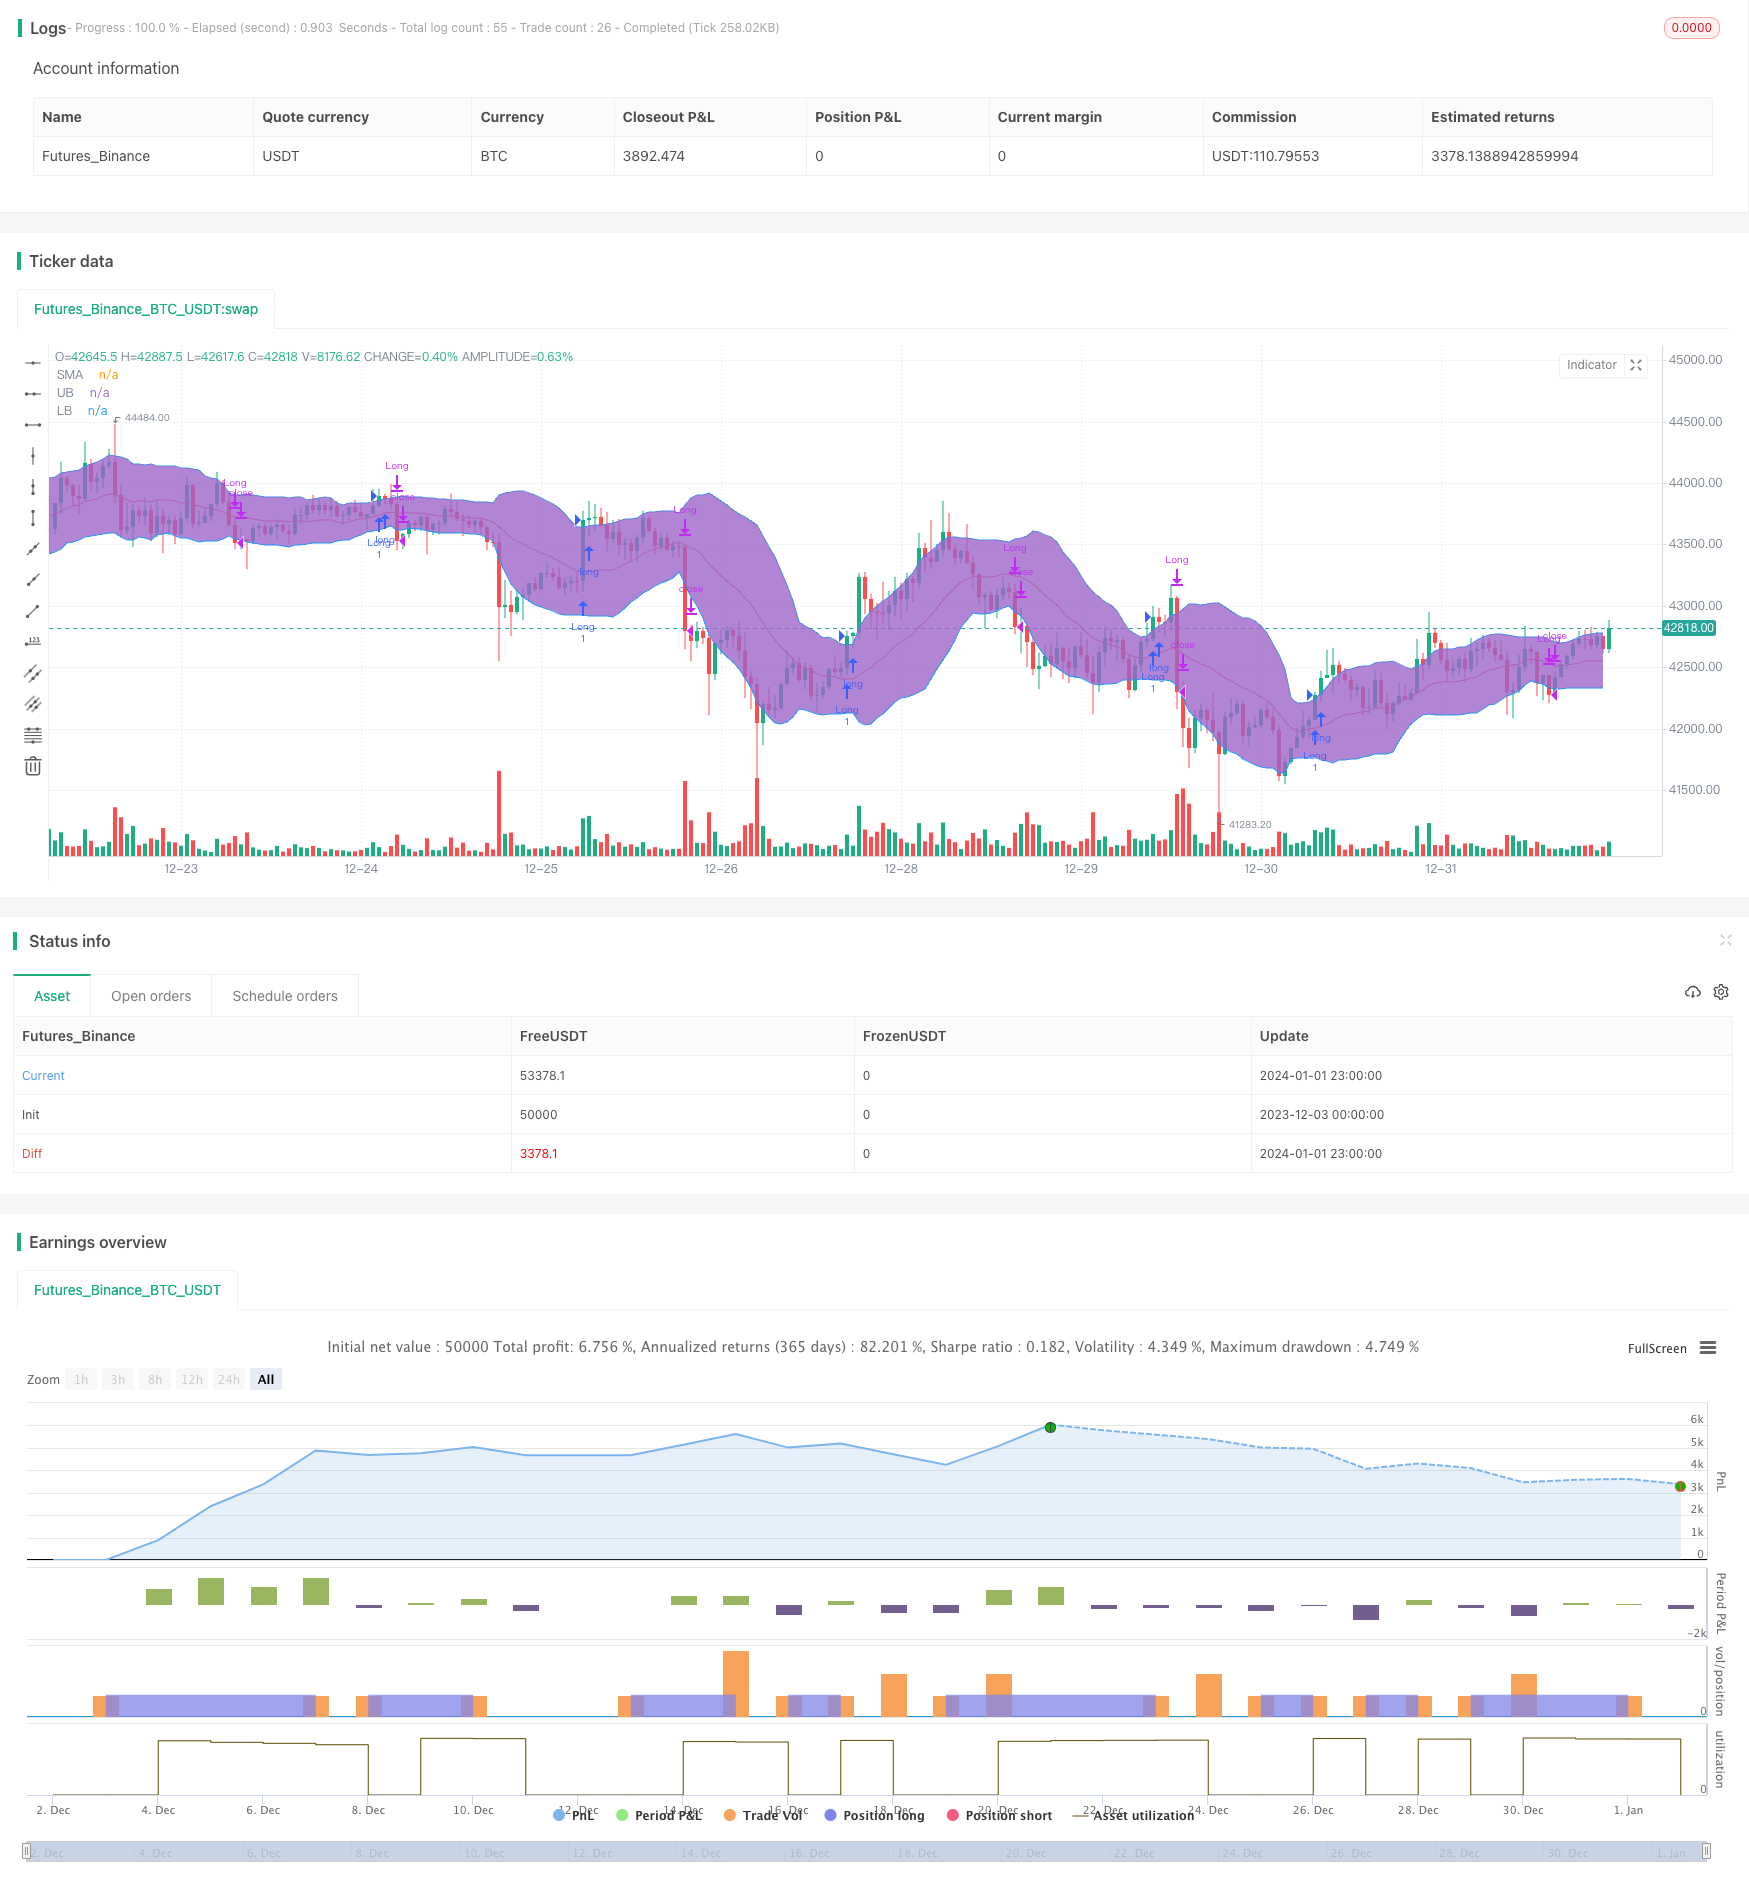
/*backtest
start: 2023-12-03 00:00:00
end: 2024-01-02 00:00:00
period: 1h
basePeriod: 15m
exchanges: [{"eid":"Futures_Binance","currency":"BTC_USDT"}]
*/

// This source code is subject to the terms of the Mozilla Public License 2.0 at https://mozilla.org/MPL/2.0/
// © Senthaamizh

//@version=4
strategy(title="Bollinger Band Breakout", shorttitle = "BB-BO", overlay=true)
source = close
length = input(20, minval=1, title = "Period") //Length of the Bollinger Band
mult = input(1.5, minval=0.001, maxval=50, title = "Standard Deviation") // Use 1.5 SD for 20 period MA; Use 2 SD for 10 period MA
exit = input(1, minval=1, maxval=2,title = "Exit Option") // Use Option 1 to exit using lower band; Use Option 2 to exit using moving average

basis = sma(source, length)
dev = mult * stdev(source, length)

upper = basis + dev
lower = basis - dev

if (crossover(source, upper))
    strategy.entry("Long", strategy.long, qty=1)

if(exit==1)
    if (crossunder(source, lower))
        strategy.close("Long")

if(exit==2) //basis is good for N50 but lower is good for BN (High volatility)
    if (crossunder(source, basis))
        strategy.close("Long")

plot(basis, color=color.red,title= "SMA")
p1 = plot(upper, color=color.blue,title= "UB")
p2 = plot(lower, color=color.blue,title= "LB")
fill(p1, p2)