개요
정량적 추적 황소 시장 전략은 EMA 평균선과 ATR 스톱을 기반으로 한 트렌드 추적 전략이다. 그것은 EMA 평균선을 사용하여 큰 트렌드 방향을 판단하고, ATR 동적 추적 스톱을 사용하여 트렌드 수익을 잠금하여 수익을 극대화한다.
전략 원칙
이 전략은 다음과 같은 부분들로 구성됩니다.
- EMA의 평평한 판단
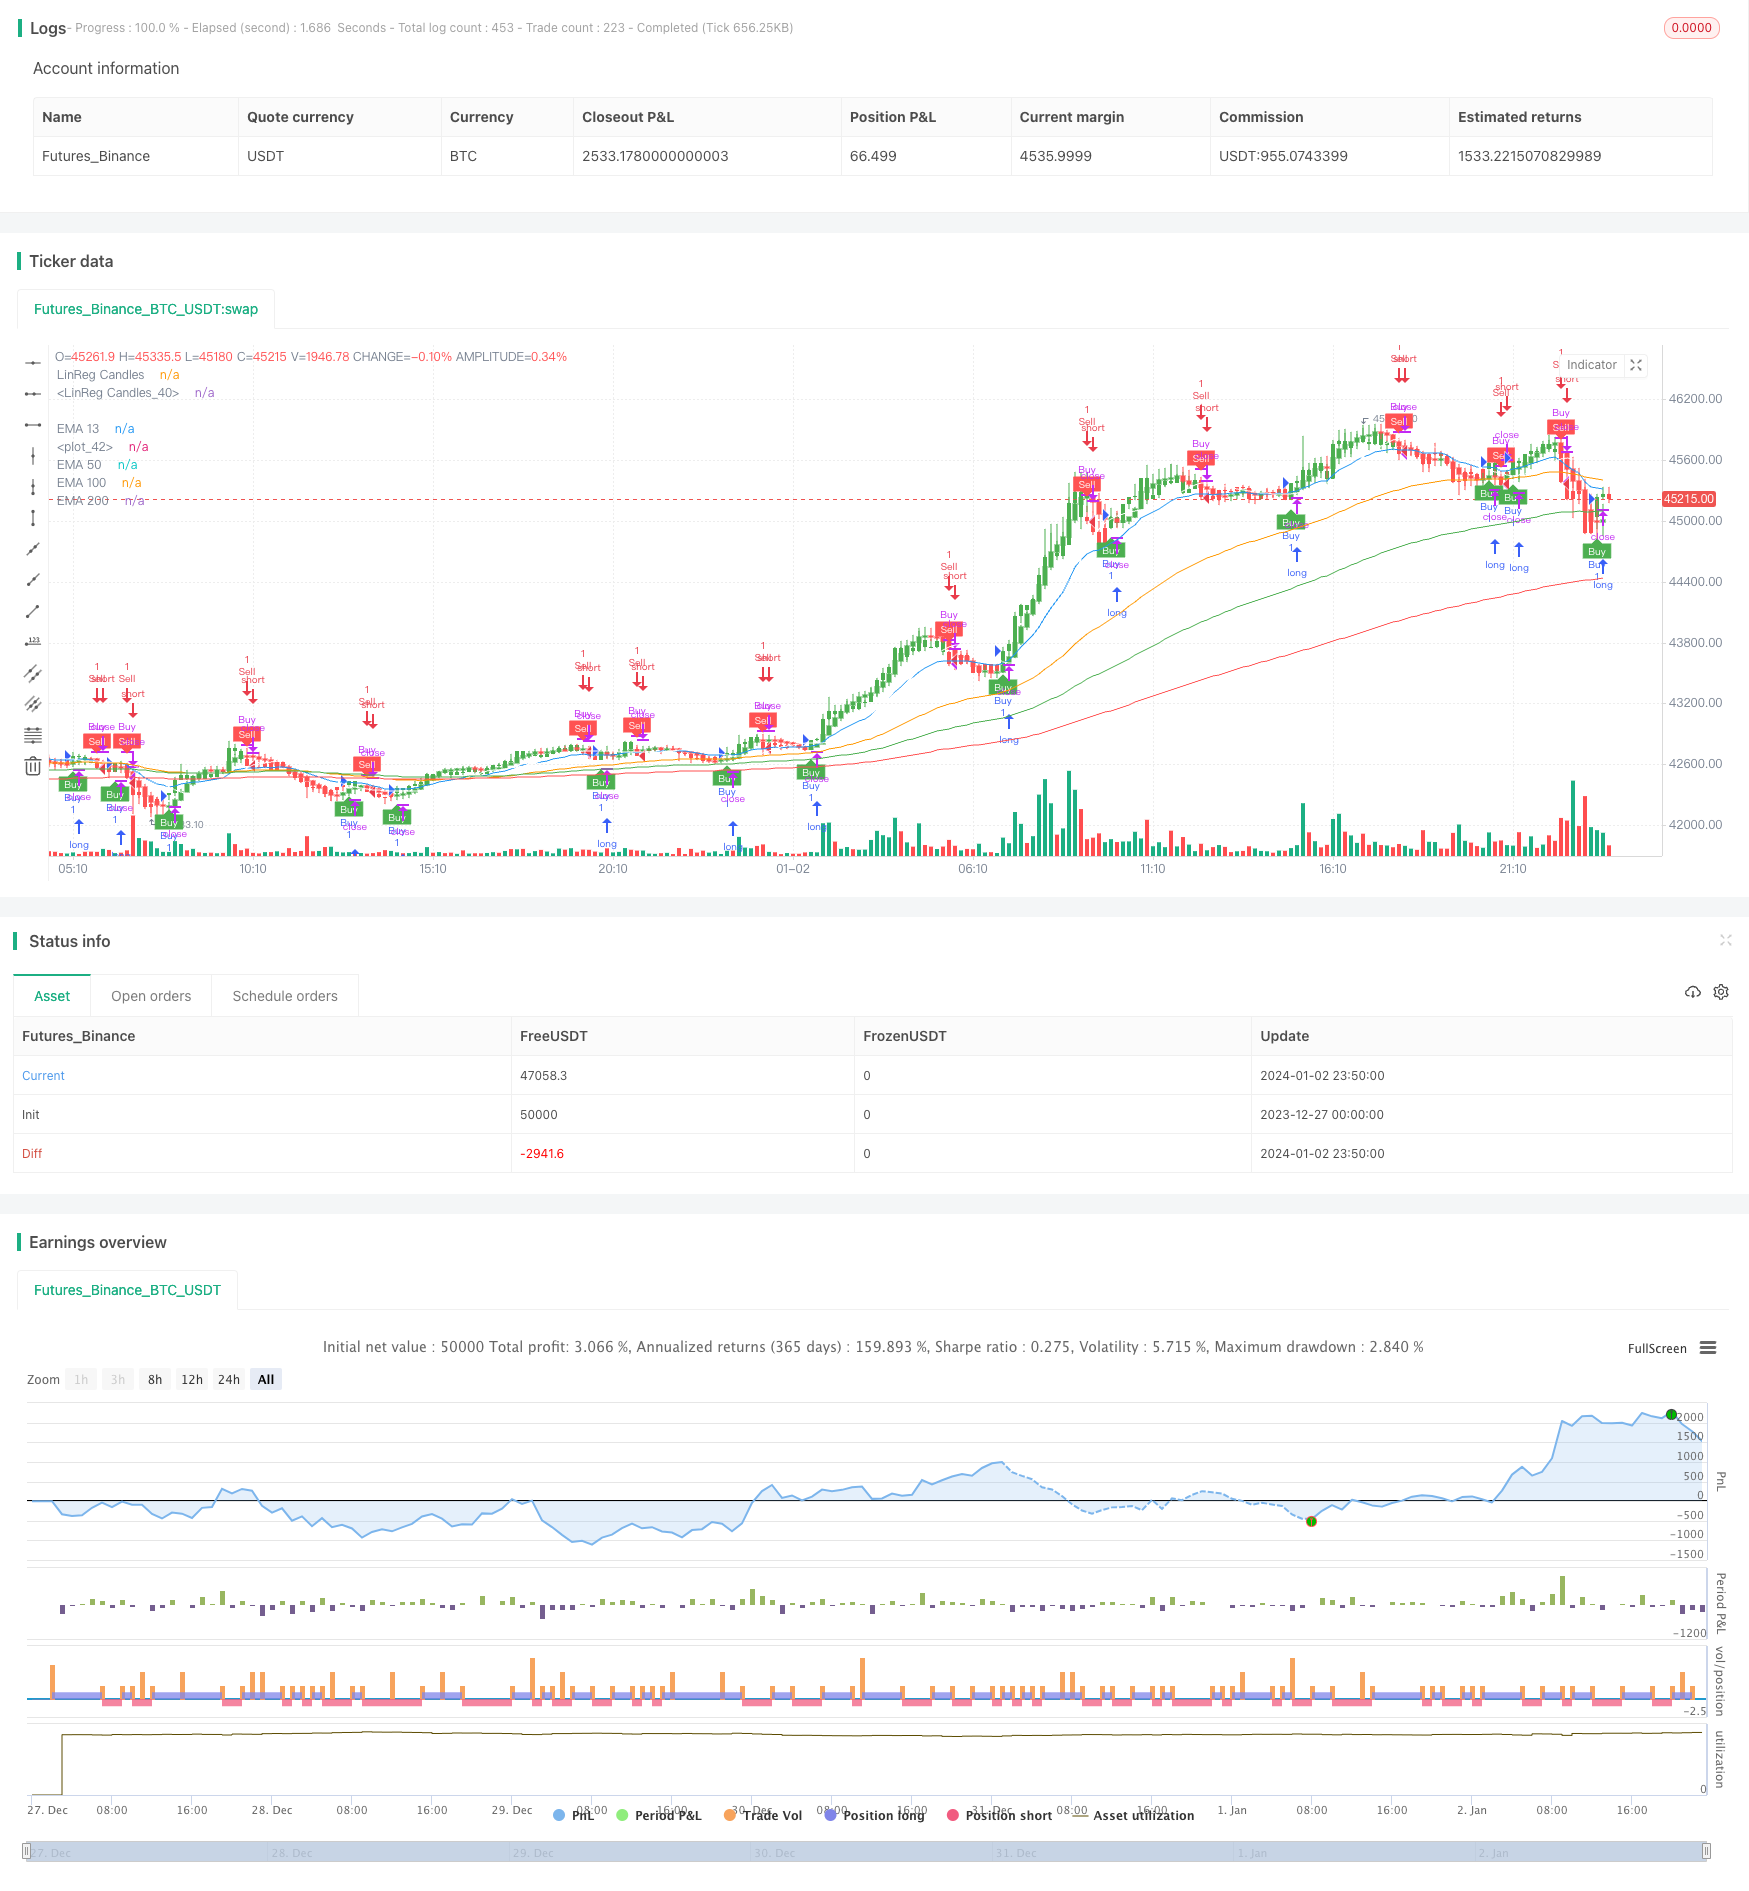
13일선, 50일선 및 100일선으로 다공간 관점을 구성하여 주요 트렌드 방향을 판단한다.
- ATR 동적 상쇄
ATR 지표를 사용하여 이 주기의 가격 변화 범위를 계산하여 스톱로스를 설정하여 스톱로스를 달성하십시오.
- 신호가 평평하다
K선 종전 가격에 대해 일정한 주기의 SMA를 부드럽게 하여 잘못된 신호를 피한다.
- 다공지 신호
가격이 EMA 평균선을 상회할 때 더 많이 하고, EMA 평균선을 상회할 때 더 적게 한다. 그리고 ATR 동적 추적 스톱로스를 설정한다.
우위 분석
이 전략은 다음과 같은 장점을 가지고 있습니다.
- 회귀 제어 우수하고 최대 회귀가 160% 내로 제어할 수 있다.
- 고정된 스톱보다 스톱 트래킹이 더 똑똑하고, 더 많은 트렌드 수익을 얻을 수 있다.
- EMA를 사용하여 주요 트렌드 방향을 판단하여 역전작전을 피하십시오.
- 평평한 K선, 가짜 신호를 필터링, 승률을 높인다.
위험 분석
이 전략에는 위험도 있습니다.
- 고정 매개 변수 설정은 다른 품종에 적합하지 않을 수 있으며, 최적화가 필요합니다.
- 진동상태에서 스톱데일리프가 발생할 수 있다.
- 서버 안정성 지원이 필요합니다. 신호를 놓치지 않도록 하세요.
변수 최적화, 적응성 테스트 등의 방법으로 위와 같은 위험을 줄일 수 있다.
최적화 방향
이 전략은 다음과 같은 방향으로 최적화될 수 있습니다.
- 기계 학습 알고리즘을 사용하여 자동 최적화 파라미터.
- 시장 상황에 맞게 조정할 수 있는 자율적 손해 방지 장치를 추가하십시오.
- 복합 필터링 조건을 늘리고, 전략의 안정성을 높여라.
- 다양한 종을 대상으로 한 테스트를 고려하여 전략의 적합성을 높여라.
요약하다
이 전략은 전반적으로 트렌드 추적 아이디어에 기반한 양적 전략이다. 트렌드 방향을 판단하는 데에 EMA를 사용하며, ATR을 사용하여 지능적인 스톱로스를 수행한다. 회귀를 효과적으로 제어하면서 트렌드 수익을 얻는다. 지속적인 최적화 반복을 통해 더 나은 전략 효과를 얻을 수 있다.
전략 소스 코드
/*backtest
start: 2023-12-27 00:00:00
end: 2024-01-03 00:00:00
period: 10m
basePeriod: 1m
exchanges: [{"eid":"Futures_Binance","currency":"BTC_USDT"}]
*/

//@version=4
strategy("Combined Strategy", overlay=true)

// Input variables for EMA Crossover
ema13_length = input(13, title="EMA 13 Length")
ema50_length = input(50, title="EMA 50 Length")
ema100_length = input(100, title="EMA 100 Length")
ema200_length = input(200, title="EMA 200 Length")

// Calculate EMAs for EMA Crossover
ema13 = ema(close, ema13_length)
ema50 = ema(close, ema50_length)
ema100 = ema(close, ema100_length)
ema200 = ema(close, ema200_length)

// Plot EMAs for EMA Crossover
plot(ema13, color=color.blue, title="EMA 13")
plot(ema50, color=color.orange, title="EMA 50")
plot(ema100, color=color.green, title="EMA 100")
plot(ema200, color=color.red, title="EMA 200")

// Input variables for LinReg Candles
signal_length = input(title="Signal Smoothing", type=input.integer, minval=1, maxval=200, defval=11)
sma_signal = input(title="Simple MA (Signal Line)", type=input.bool, defval=true)

lin_reg = input(title="Lin Reg", type=input.bool, defval=true)
linreg_length = input(title="Linear Regression Length", type=input.integer, minval=1, maxval=200, defval=11)

// Calculate LinReg Candles
bopen = lin_reg ? linreg(open, linreg_length, 0) : open
bhigh = lin_reg ? linreg(high, linreg_length, 0) : high
blow = lin_reg ? linreg(low, linreg_length, 0) : low
bclose = lin_reg ? linreg(close, linreg_length, 0) : close

r = bopen < bclose

signal = sma_signal ? sma(bclose, signal_length) : ema(bclose, signal_length)

plotcandle(r ? bopen : na, r ? bhigh : na, r ? blow: na, r ? bclose : na, title="LinReg Candles", color=color.green, wickcolor=color.green, bordercolor=color.green, editable=true)
plotcandle(r ? na : bopen, r ? na : bhigh, r ? na : blow, r ? na : bclose, title="LinReg Candles", color=color.red, wickcolor=color.red, bordercolor=color.red, editable=true)

plot(signal, color=color.white)

// Input variables for UT Bot Alerts
a = input(1, title="Key Value. 'This changes the sensitivity'")
c = input(10, title="ATR Period")
h = input(false, title="Signals from Heikin Ashi Candles")

// Calculate UT Bot Alerts
xATR = atr(c)
nLoss = a * xATR

src = h ? security(heikinashi(syminfo.tickerid), timeframe.period, close, lookahead=false) : close

xATRTrailingStop = 0.0
xATRTrailingStop := iff(src > nz(xATRTrailingStop[1], 0) and src[1] > nz(xATRTrailingStop[1], 0), max(nz(xATRTrailingStop[1]), src - nLoss),
   iff(src < nz(xATRTrailingStop[1], 0) and src[1] < nz(xATRTrailingStop[1], 0), min(nz(xATRTrailingStop[1]), src + nLoss),
   iff(src > nz(xATRTrailingStop[1], 0), src - nLoss, src + nLoss)))

pos = 0
pos := iff(src[1] < nz(xATRTrailingStop[1], 0) and src > nz(xATRTrailingStop[1], 0), 1,
   iff(src[1] > nz(xATRTrailingStop[1], 0) and src < nz(xATRTrailingStop[1], 0), -1, nz(pos[1], 0)))

xcolor = pos == -1 ? color.red: pos == 1 ? color.green : color.blue

ema = ema(src,1)
above = crossover(ema, xATRTrailingStop)
below = crossover(xATRTrailingStop, ema)

buy = src > xATRTrailingStop and above
sell = src < xATRTrailingStop and below

barbuy = src > xATRTrailingStop
barsell = src < xATRTrailingStop

strategy.entry("Buy", strategy.long, when=buy)
strategy.close("Buy", when=sell)
strategy.entry("Sell", strategy.short, when=sell)
strategy.close("Sell", when=buy)

plotshape(buy, title="Buy", text='Buy', style=shape.labelup, location=location.belowbar, color=color.green, textcolor=color.white, transp=0, size=size.tiny)
plotshape(sell, title="Sell", text='Sell', style=shape.labeldown, location=location.abovebar, color=color.red, textcolor=color.white, transp=0, size=size.tiny)

barcolor(barbuy ? color.green : na)
barcolor(barsell ? color.red : na)

alertcondition(buy, "UT Long", "UT Long")
alertcondition(sell, "UT Short", "UT Short")