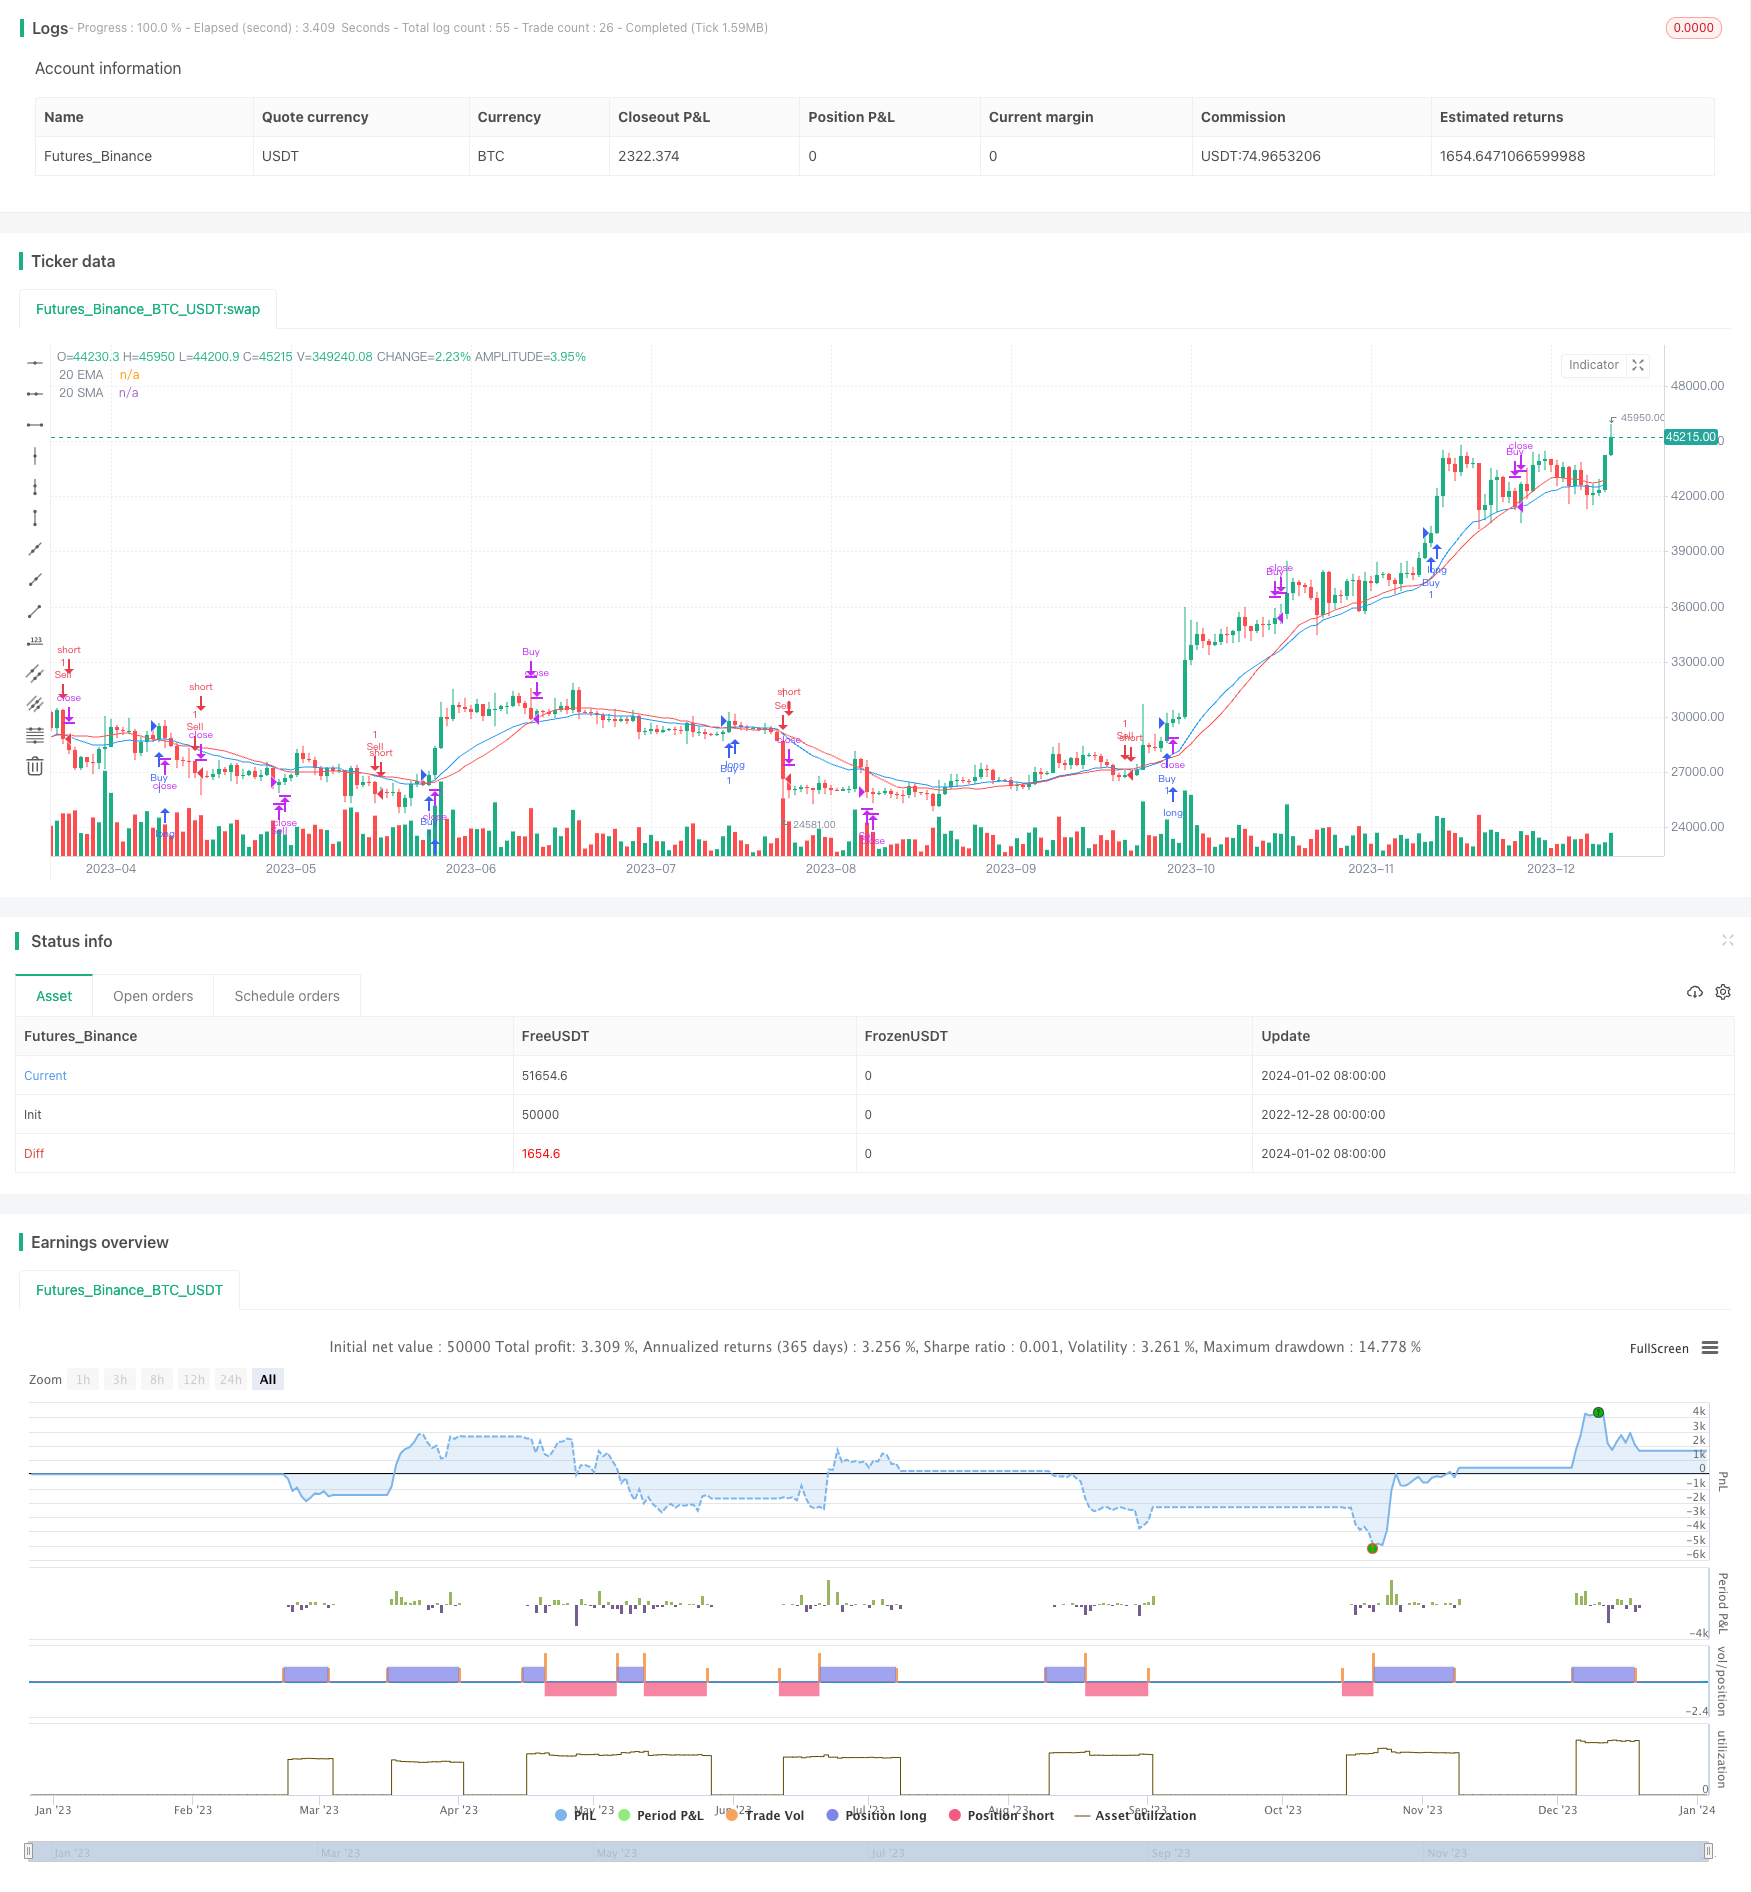
개요
이 전략의 목적은 20주기 지수 이동 평균 ((EMA) 과 20주기 간단한 이동 평균 ((SMA) 의 교차로 잠재적인 트렌드 역점을 식별하는 것이다. 교차의 방향에 따라 더 많은 또는 더 적은 기회를 결정한다.
전략 원칙
- 20주기 EMA가 20주기 SMA를 아래에서 뚫고 20주기 EMA보다 클로즈가 높을 때 더 많이 한다.
- 20주기 EMA가 20주기 SMA를 상단에서 아래로 뚫고 20주기 EMA보다 낮은 가격으로 종결될 때, 공백한다.
- 과잉 주문을 위해, 20주기 EMA 아래 20주기 SMA를 통과할 때 평점.
- 코스피의 경우, 20주기 EMA에 20주기 SMA를 뚫을 때 평지한다.
이 전략은 ta의 크로스오버와 크로스언더 함수를 사용하여 평행선의 교차를 검출한다.
우위 분석
이 전략은 이동 평균의 트렌드 추적 기능과 평균선 교차의 신호 생성을 결합하여 다음과 같은 장점을 가지고 있다:
- 이동 평균은 시장의 일부 소음을 효과적으로 필터링하여 중·장기 추세를 식별합니다.
- 평행선 교차는 조작이 쉽고 시장의 전환점을 명확하게 판단할 수 있다.
- 20주기 파라미터 설정은 대부분의 주식과 시간 주기에서 유효하며, 자주 조정할 필요가 없다.
- 마감 가격과 EMA의 관계를 활용하여 일부 잘못된 신호를 피했다.
- 규칙은 명확하고 간단하며, 이해하기 쉽고 실행이 용이하며, 낮은 수준의 투자자에게 적합합니다.
위험 분석
이 전략에는 다음과 같은 위험도 있습니다.
- 이동 평균은 지연성이 있으며, 단기 및 급격한 추세 반전을 놓칠 수 있다.
- 평균선 교차는 노이즈 신호를 발생시키며 전략의 안정성에 영향을 준다.
- 고정 20주기 파라미터 설정은 일부 주식에는 적합하지 않을 수 있으며, 조정할 필요가 있다.
- 단독 손실이 더 커질 수 있습니다.
대책:
- 평균주기를 적절히 줄여서 반응 속도를 높여라.
- 다른 필터링 조건을 추가하여 잘못된 신호를 방지하십시오.
- 매개 변수와 주식 범주를 테스트하고 최적화한다.
- 위험 조절을 위해 손해배상 제도를 추가합니다.
최적화 방향
이 전략은 다음과 같은 측면에서 최적화될 수 있습니다.
- 다른 지표 판단을 추가하고, 거래량, RSI 등과 같은 지표를 추가하여 복합 전략을 구축합니다.
- 평균선 주기 및 거래 품종에 대한 테스트 최적화, 적응 파라미터를 설정한다.
- 동적 탈퇴 메커니즘을 구축합니다. 트렌드 트래킹 스톱, 시간 스톱 등등
- 알고리즘 거래 기능을 추가하여 자동 거래가 가능합니다.
- 기계 학습 알고리즘을 추가하여 전략의 적응과 최적화를 구현합니다.
요약하다
이 전략은 전체적으로 간단하고 실용적이며, 평선 교차 이론을 사용하여 잠재적인 트렌드 역점을 식별하는 것이 일반적이고 효과적인 전략 아이디어입니다. 그러나 다른 기술 지표, 동적 파라미터 설정, 스톱로드 방식 및 알고리즘 거래 방식 등을 추가함으로써 전략을 개선 할 수있는 여지가 있습니다.
전략 소스 코드
/*backtest
start: 2022-12-28 00:00:00
end: 2024-01-03 00:00:00
period: 1d
basePeriod: 1h
exchanges: [{"eid":"Futures_Binance","currency":"BTC_USDT"}]
*/

//@version=5
strategy("EMA-SMA Crossover Strategy", overlay=true)

// Define the length of the moving averages
emaLength = 20
smaLength = 20

// Calculate moving averages
emaValue = ta.ema(close, emaLength)
smaValue = ta.sma(close, smaLength)

// Buy condition
buyCondition = ta.crossover(emaValue, smaValue) and close > emaValue

// Short sell condition
sellCondition = ta.crossunder(emaValue, smaValue) and close < emaValue

// Exit conditions for both Buy and Short sell
exitBuyCondition = ta.crossunder(emaValue, smaValue)
exitSellCondition = ta.crossover(emaValue, smaValue)

// Strategy logic
if (buyCondition)
    strategy.entry("Buy", strategy.long)

if (sellCondition)
    strategy.entry("Sell", strategy.short)

if (exitBuyCondition)
    strategy.close("Buy")

if (exitSellCondition)
    strategy.close("Sell")

// Plot the moving averages
plot(emaValue, color=color.blue, title="20 EMA")
plot(smaValue, color=color.red, title="20 SMA")