개요
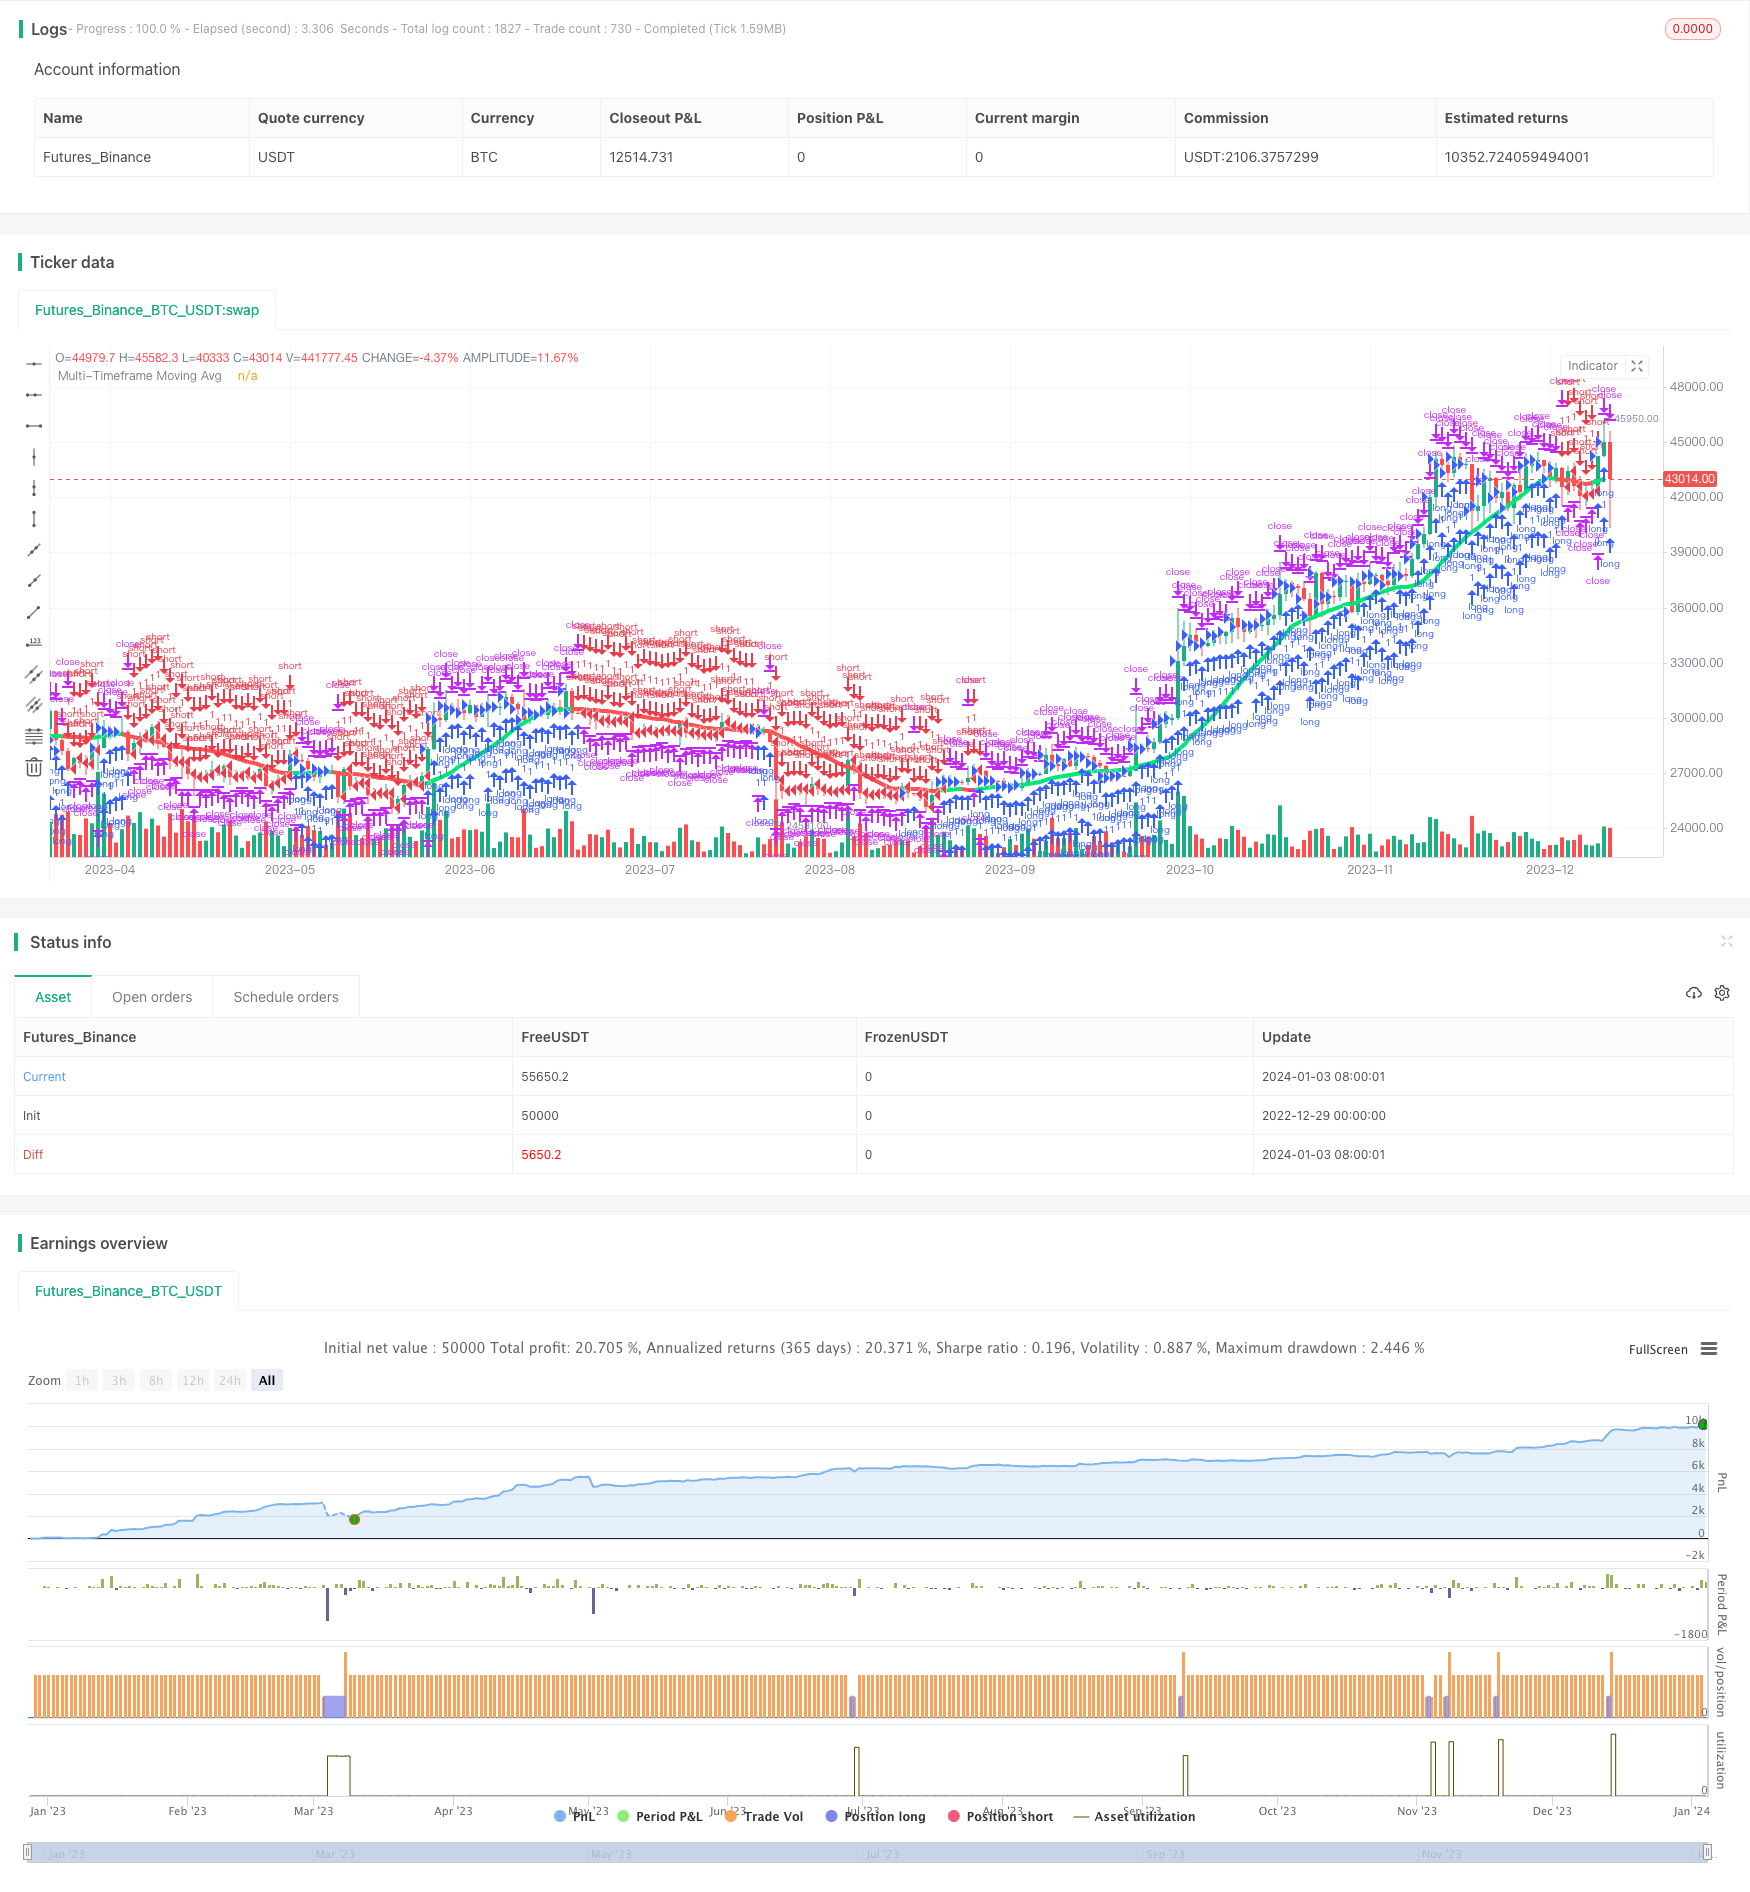
이 전략은 유명한 지표 CM_Ultimate_MA_MTF를 기반으로 하고 있으며, 여러 시간 스케일에서 이동 평균을 도출할 수 있으며, 다른 시간 주기의 MA의 교차 작업을 가능하게 한다. 전략은 동시에 트래킹 스톱 손실 기능을 갖는다.
전략 원칙
- 사용자 선택에 따라, 다른 유형의 MA 지표를 통해 메인 그래프 주기 및 더 높은 주기에서 각각 MA 선을 그리기.
- 빠른 주기 MA 선에서 느린 주기 MA 선을 통과할 때, 더 많은 것을 하고, 빠른 주기 MA 선 아래에서 느린 주기 MA 선을 통과할 때, 공백을 한다.
- 추적할 수 있는 스톱로스 메커니즘을 추가하여 위험을 더욱 통제할 수 있습니다.
우위 분석
- 다중 시간 스케일 MA 교차, 신호 품질을 향상시키고, 가짜 신호를 줄일 수 있다.
- 다양한 유형의 MA의 조합은 각 지표의 장점을 발휘하여 안정성을 높일 수 있습니다.
- 손해 추적은 적시에 손해를 막고 큰 손실을 줄이는 데 도움이 됩니다.
위험 분석
- MA 지표가 지연되어 단선 조작 기회를 놓칠 수 있다.
- MA 주기 파라미터를 적절하게 최적화해야 하며, 그렇지 않으면 너무 많은 가짜 신호가 발생할 수 있다.
- 부적절한 스톱포인트 설정으로 불필요한 스톱포인트 손실이 발생할 수 있습니다.
최적화 방향
- 다양한 매개 변수들의 MA 조합을 테스트하여 최적의 매개 변수를 찾습니다.
- 다른 지표 필터를 추가하여 신호 품질을 향상시킬 수 있습니다.
- 시장 특성에 맞게 손실을 막는 전략을 최적화 할 수 있습니다.
요약하다
이 전략은 이동 평균의 다중 시간 프레임 분석과 스톱 로스를 추적하는 방법을 통합하여 신호 품질을 향상시키고 위험 수준을 제어합니다. 파라미터를 최적화하고 다른 지표를 추가함으로써 전략의 효과를 더욱 강화 할 수 있습니다.
전략 소스 코드
/*backtest
start: 2022-12-29 00:00:00
end: 2024-01-04 00:00:00
period: 1d
basePeriod: 1h
exchanges: [{"eid":"Futures_Binance","currency":"BTC_USDT"}]
*/

//@version=2

strategy(title = "Ultimate Moving Average Strategy", shorttitle = "UMA Strategy", overlay = true)

//Created by user ChrisMoody 4-24-2014
//Converted to strategy by Virtual_Machinist 7-11-2018
//Plots The Majority of Moving Averages
//Defaults to Current Chart Time Frame --- But Can Be Changed to Higher Or Lower Time Frames
//2nd MA Capability with Show Crosses Feature

//inputs
src = close
useCurrentRes = input(true, title="Use Current Chart Resolution?")
resCustom = input(title="Use Different Timeframe? Uncheck Box Above",  defval="D")
len = input(20, title="Moving Average Length - LookBack Period")
atype = input(1,minval=1,maxval=7,title="1=SMA, 2=EMA, 3=WMA, 4=HullMA, 5=VWMA, 6=RMA, 7=TEMA")
cc = input(true,title="Change Color Based On Direction?")
smoothe = input(2, minval=1, maxval=10, title="Color Smoothing - 1 = No Smoothing")
doma2 = input(false, title="Optional 2nd Moving Average")
len2 = input(50, title="Moving Average Length - Optional 2nd MA")
atype2 = input(1,minval=1,maxval=7,title="1=SMA, 2=EMA, 3=WMA, 4=HullMA, 5=VWMA, 6=RMA, 7=TEMA")
cc2 = input(true,title="Change Color Based On Direction 2nd MA?")
warn = input(false, title="***You Can Turn On The Show Dots Parameter Below Without Plotting 2nd MA to See Crosses***")
warn2 = input(false, title="***If Using Cross Feature W/O Plotting 2ndMA - Make Sure 2ndMA Parameters are Set Correctly***")
sd = input(false, title="Show Dots on Cross of Both MA's")

useStop     = input(defval = true, title = "Use Trailing Stop?")
slPoints    = input(defval = 200, title = "Stop Loss Trail Points", minval = 1)
slOffset    = input(defval = 400, title = "Stop Loss Trail Offset", minval = 1)

res = useCurrentRes ? timeframe.period : resCustom
//hull ma definition
hullma = wma(2*wma(src, len/2)-wma(src, len), round(sqrt(len)))
//TEMA definition
ema1 = ema(src, len)
ema2 = ema(ema1, len)
ema3 = ema(ema2, len)
tema = 3 * (ema1 - ema2) + ema3

avg = atype == 1 ? sma(src,len) : atype == 2 ? ema(src,len) : atype == 3 ? wma(src,len) : atype == 4 ? hullma : atype == 5 ? vwma(src, len) : atype == 6 ? rma(src,len) : tema
//2nd Ma - hull ma definition
hullma2 = wma(2*wma(src, len2/2)-wma(src, len2), round(sqrt(len2)))
//2nd MA TEMA definition
sema1 = ema(src, len2)
sema2 = ema(sema1, len2)
sema3 = ema(sema2, len2)
stema = 3 * (sema1 - sema2) + sema3

avg2 = atype2 == 1 ? sma(src,len2) : atype2 == 2 ? ema(src,len2) : atype2 == 3 ? wma(src,len2) : atype2 == 4 ? hullma2 : atype2 == 5 ? vwma(src, len2) : atype2 == 6 ? rma(src,len2) : tema

out = avg
out_two = avg2

out1 = request.security(syminfo.tickerid, res, out)
out2 = request.security(syminfo.tickerid, res, out_two)

ma_up = out1 >= out1[smoothe]
ma_down = out1 < out1[smoothe]

col = cc ? ma_up ? lime : ma_down ? red : aqua : aqua
col2 = cc2 ? ma_up ? lime : ma_down ? red : aqua : aqua

circleYPosition = out2

plot(out1, title="Multi-Timeframe Moving Avg", style=line, linewidth=4, color = col)
plot(doma2 and out2 ? out2 : na, title="2nd Multi-TimeFrame Moving Average", style=circles, linewidth=4, color=col2)
plot(sd and cross(out1, out2) ? circleYPosition : na,style=cross, linewidth=5, color=yellow)

// Strategy conditions

longCond    = ma_up
shortCond   = ma_down
// entries and base exit
strategy.entry("long", strategy.long, when = longCond)
strategy.entry("short", strategy.short, when = shortCond)

if (useStop)
    strategy.exit("XL", from_entry = "long", trail_points = slPoints, trail_offset = slOffset)
    strategy.exit("XS", from_entry = "short", trail_points = slPoints, trail_offset = slOffset)
// not sure needed, but just incase..
strategy.exit("XL", from_entry = "long", when = shortCond)
strategy.exit("XS", from_entry = "short", when = longCond)