개요
이 전략은 1시간 지연된 자정 색깔을 기반으로 거래하고, 전날 자정 0시의 색을 분석하여 다음 날 1시의 거래 방향을 판단한다. 0시이 초록할 때 더하고, 빨간할 때 공백을 한다. 동시에 스톱로스와 스톱 포지션을 설정한다.
전략 원칙
이 전략의 핵심 논리는 시장의 중간에 있는 12시의 매혹적 효과에 기초하고 있는데, 즉 전날의 12시 0시 색은 그 날의 전체 시장 분위기를 대표하며, 다음 날의 상장 후 시장 방향을 판단할 수 있다.
구체적으로, 전략은 먼저 현재의 K선이 0점인지 판단하고, 만약 그렇다면, 그 종식값이 개시값보다 높다고 녹색으로 기록하고, 그렇지 않으면 빨간색으로 기록한다. 다음 바, 즉 1점 K선에서, 전날의 0점의 색깔에 따라 해당 방향의 여분의 공백을 하고, 손해 중지 위치를 설정한다.
0시의 급격한 변동이 입시에 영향을 미치지 않도록 지연된 포지션 개시 방식을 사용하십시오.
전략적 이점
- 0점 선의 색을 사용하여 시장 방향을 판단하는 전략은 간단하고 이해하기 쉽고, 논리가 명확합니다.
- 1시간 늦추면 0점 가격의 급격한 변동의 위험을 피할 수 있다.
- 손실을 제한하고 수익을 보장하기 위해 스톱 스톱을 설정합니다.
전략적 위험
- 0점 오렌지색은 반드시 다음 날 시장의 움직임을 완전히 나타낼 수 없습니다. 불확실성이 있습니다.
- 주요 경제 사건 등의 상황에서 시장의 급격한 큰 변동의 위험을 고려하지 않고
- 손실을 막는 포지션의 설정은 지속적으로 최적화 및 테스트를 필요로 하며, 그렇지 않으면 고정되거나 수익성이 제한될 수 있습니다.
전략 최적화 방향
- 0점 진동의 지표 효용은 더 많은 요소와 결합하여 판단할 수 있습니다.
- 2시간, 3시간 등 다양한 연장 시간을 테스트할 수 있습니다.
- 시장의 변동에 더 잘 적응할 수 있도록 역동적으로 정지 지점을 조정합니다.
요약하다
이 전략의 전체적인 아이디어는 명확하고 간단하며, 0점의 선 색깔을 통해 다음 날 방향을 판단하고, 스톱 스톱 제어 위험을 설정하는 것은 초보자에게 적합한 입문 쇼트라인 전략이다. 그러나 또한 약간의 불확실성이 있으며, 이후 지속적으로 최적화하고 검증해야 실제 전투가 될 수 있다.
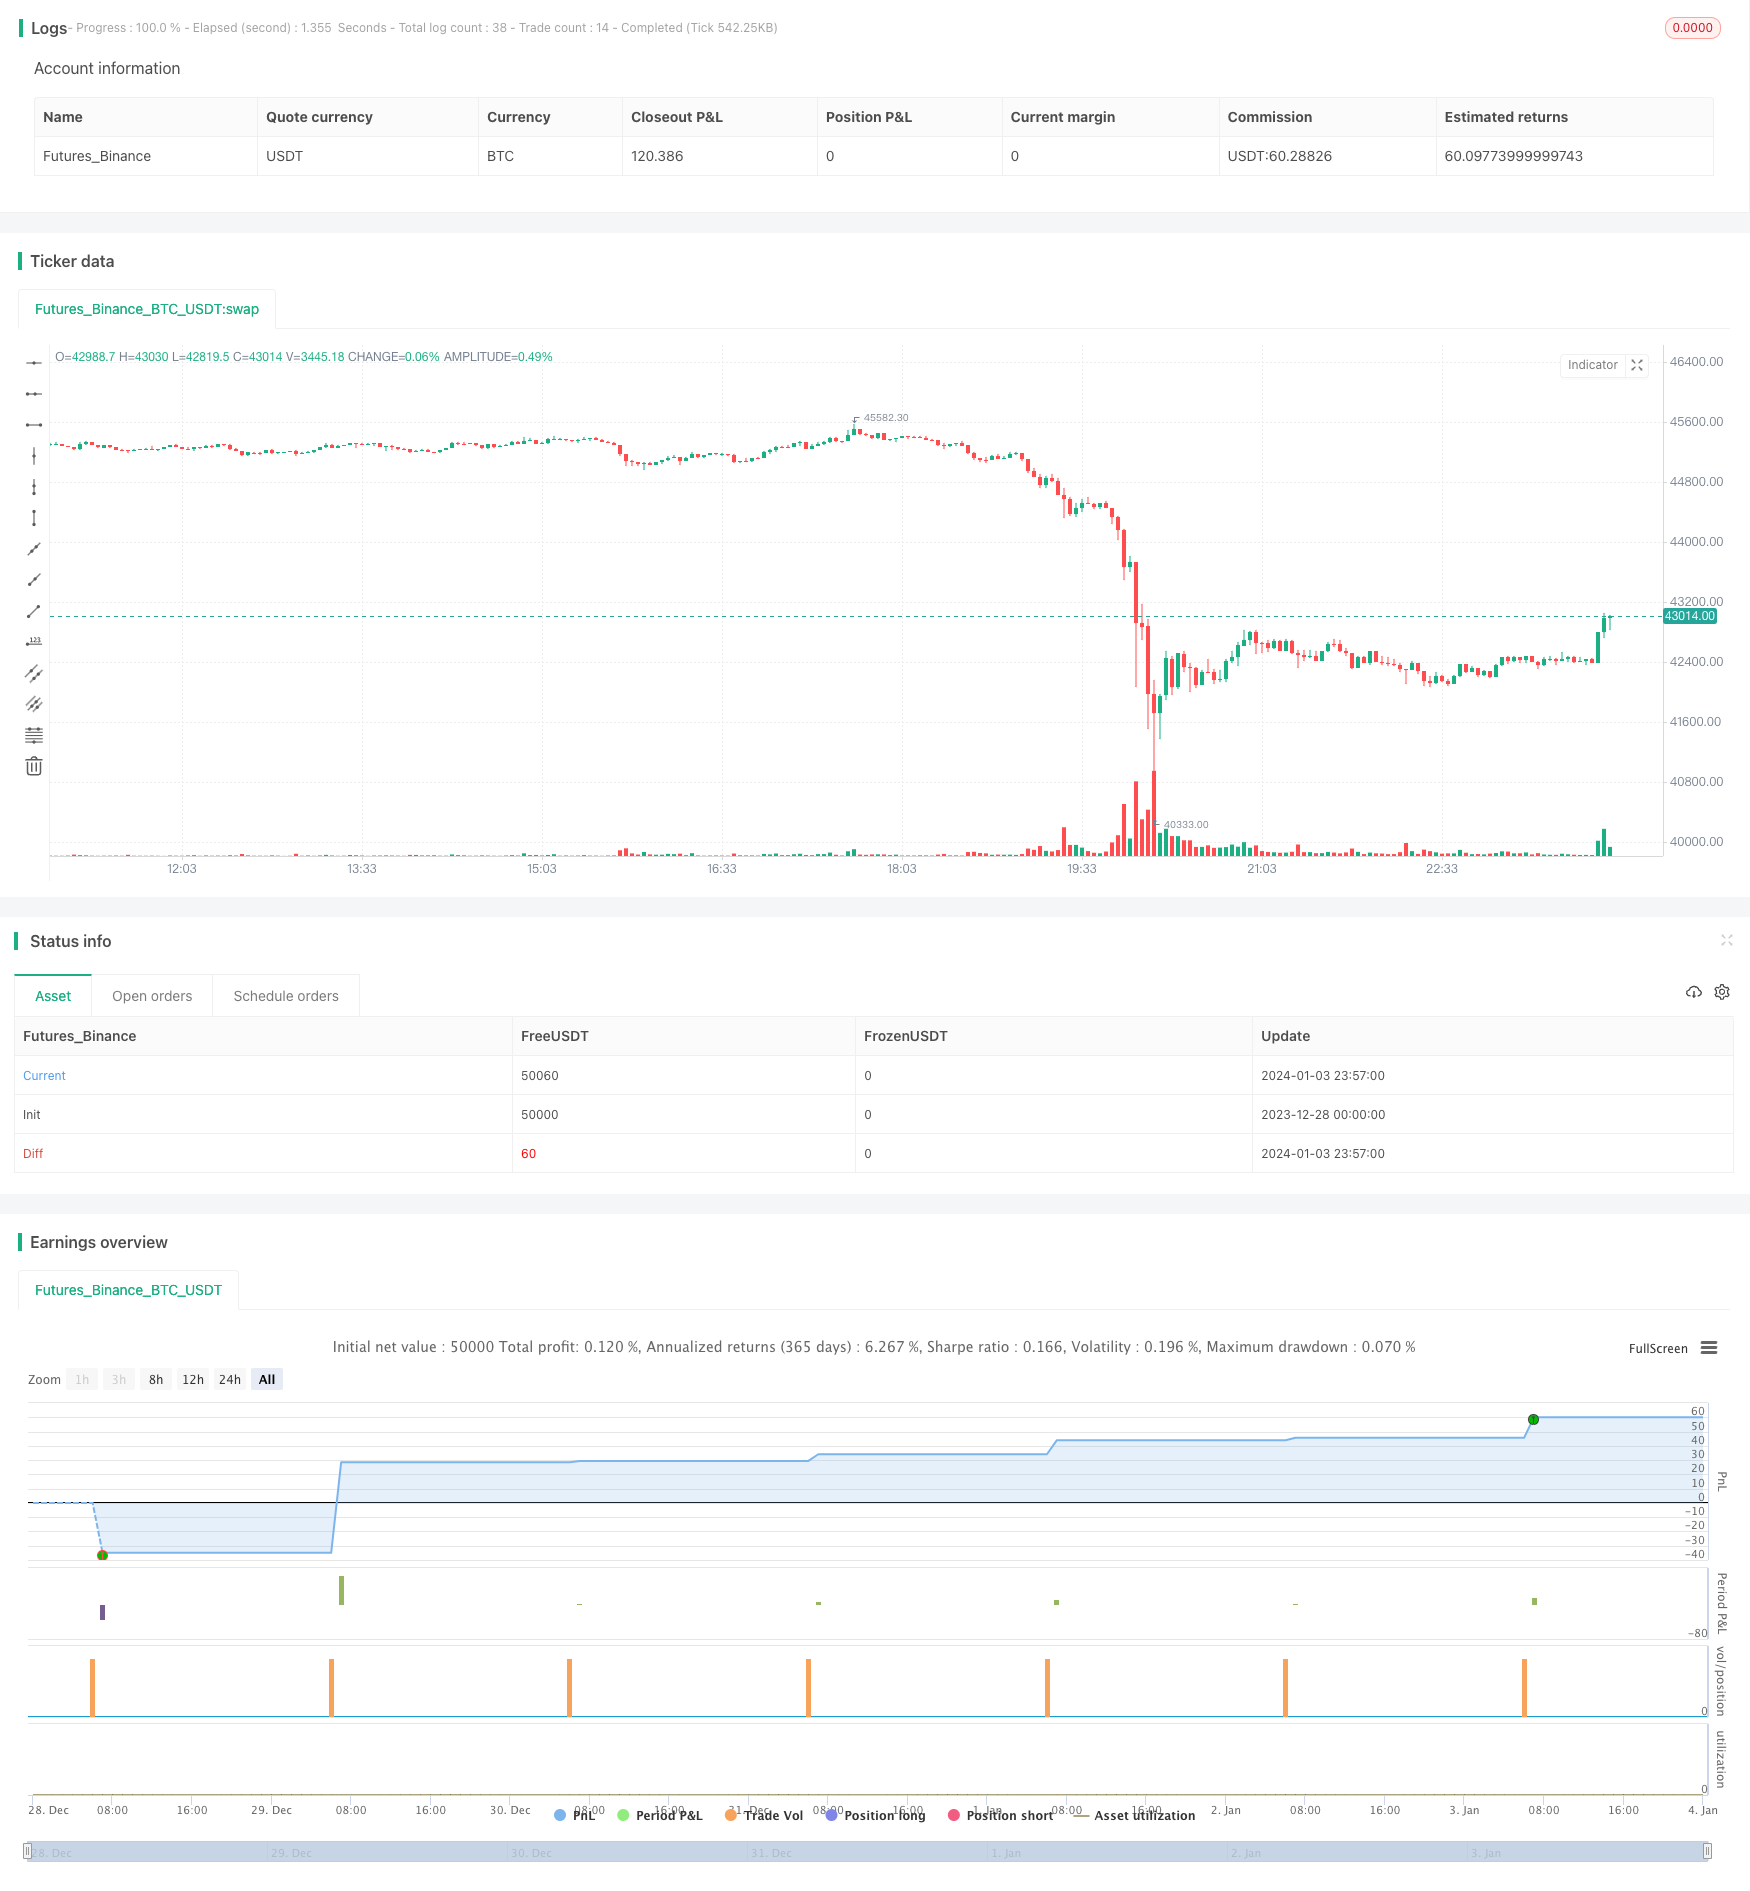
전략 소스 코드
/*backtest
start: 2023-12-28 00:00:00
end: 2024-01-04 00:00:00
period: 3m
basePeriod: 1m
exchanges: [{"eid":"Futures_Binance","currency":"BTC_USDT"}]
*/

//@version=4
strategy("Midnight Candle Color Strategy with 1-Hour Delay and SL/TP", shorttitle="12AM +1H SL/TP Strat", overlay=true)

// Adjust for New York time (UTC-5 or UTC-4 for Daylight Saving Time)
// Assuming UTC-5 for now; adjust as necessary for Daylight Saving Time
nyHour(hour) => (hour - 5) % 24

// Function to check if the current bar is the 12:00 AM New York time bar
isMidnightBar() =>
    nyHour(hour) == 0 and minute == 0

// Function to check if the current bar is the 1:00 AM New York time bar (1 hour after midnight)
is1AMBar() =>
    nyHour(hour) == 1 and minute == 0

// Variable to store the color of the previous day's midnight candle
var color midnightCandleColorPrevDay = na

// Determine the color of the previous day's midnight candle
if isMidnightBar()
    midnightCandleColorPrevDay := close[1] > open[1] ? color.green : color.red

// Strategy execution at 1:00 AM based on the color of the previous day's midnight candle
if is1AMBar()
    if midnightCandleColorPrevDay == color.green
        strategy.entry("Long", strategy.long)
        strategy.exit("Take Profit", "Long", limit=close + 57 * syminfo.mintick, stop=close - 200 * syminfo.mintick)
    if midnightCandleColorPrevDay == color.red
        strategy.entry("Short", strategy.short)
        strategy.exit("Take Profit", "Short", limit=close - 50 * syminfo.mintick, stop=close + 200 * syminfo.mintick)

// Optional: Plot a marker for visualization
plotshape(series=isMidnightBar(), style=shape.triangleup, location=location.belowbar, color=color.new(midnightCandleColorPrevDay, 90), size=size.small)
plotshape(series=is1AMBar(), style=shape.triangledown, location=location.abovebar, color=color.blue, size=size.small)