개요
슈퍼 트렌드 진전 전략은 클래식 슈퍼 트렌드 지표의 기초에서 최적화 및 업그레이드하는 전략입니다. 그것은 가격 움직임, 변동률 및 여러 가지 기술 지표를 결합하여 신호 품질을 향상시키고, 소음을 줄이고, 시장 추세의 변화를 더 정확하게 캡처합니다.
전략 원칙
초 트렌드 선진 전략의 핵심은 초 트렌드 라인이다. 그것은 실제 변동 범위와 가격 운동에 따라 계산되어 잠재적인 가격 추세와 전환점을 판단합니다. 가격이 초 트렌드 라인 위에있을 때 상승 추세를 나타냅니다. 반대로 하락 추세를 나타냅니다.
전통적인 초 트렌드 지표가 종점 가격과 실제 변동 범위를 고려하는 것과는 달리, 진전 전략은 거래량, 동력 흔들기 및 기본 데이터와 같은 여러 차원을 통합하여 신호의 신뢰성을 검증합니다. 이러한 다 변수 방법은 생성 된 거래 신호가 더 정확하고 신뢰할 수 있으며 시장 소음에 영향을 받지 않도록합니다.
우위 분석
트렌드 상의 진보 전략의 주요 장점은 다음과 같습니다.
시장의 움직임을 더 정확하게 판단하고, 가짜 브레이크를 필터링한다. 이 전략은 여러 요소 지표가 일치한 후에 거래 신호를 생성하기 위해 기다린다. 이는 정확도를 크게 향상시킬 수 있다.
시장 소음의 방해를 줄여줍니다. 필터를 조합하여 많은 중요하지 않은 시장 데이터를 차단하여 판단을 더 명확하게 할 수 있습니다.
위험 관리를 최적화한다. 명확한 거래 신호는 거래자가 더 나은 위험을 통제할 수 있도록 스톱로스와 스톱포트를 더 잘 계획할 수 있도록 도와준다.
적응력: 이 전략은 트렌드를 식별하는 것 외에도, 포괄적이고 효율적인 거래 시스템을 구축하기 위해 다른 기술 도구와 함께 사용할 수 있습니다.
위험 분석
트렌드 상의 진보 전략에는 다음과 같은 주요 위험도 있습니다.
매개 변수 설정 위험. 잘못된 지표 매개 변수 조합은 전략이 실패하거나 너무 많은 잘못된 신호를 생성할 수 있습니다.
트렌드 오판의 위험. 어떤 전략도 완전히 오판의 위험을 피할 수 없으며, 트렌드가 갑자기 변하면 손실이 발생할 수 있다.
과도한 최적화 위험. 변수가 매우 정밀하게 조정되면, 시장 변화에 적응할 수 없는 역사적 데이터에 너무 의존할 수 있다.
거래 비용 위험. 거래의 횟수가 증가하면, 수수료와 슬라이드 포인트와 같은 거래 비용도 눈에 띄게 증가합니다.
대응방법:
최적화 파라미터 설정, 주기적으로 테스트 파라미터의 안정성을 재검토한다.
단기 손실을 제어하기 위해 Stop Loss Stopper를 설정하십시오.
과잉 최적화를 피하고, 변수의 일반화 능력을 유지한다.
신호의 리스크/이익 비율을 계산하고 거래 비용을 제어한다.
최적화 방향
트렌드 상의 진보 전략은 다음과 같은 측면에서 최적화 될 수 있습니다.
다른 시장에 따라 매개 변수를 조정하여 그 시장의 특성에 더 적합하게 만듭니다. 예를 들어, 변동하는 시장은 계산 주기를 줄일 수 있습니다.
적응 필터링 메커니즘을 추가한다. 시장이 특정 상태로 들어가면 지표 파라미터를 자동으로 조정하거나 특정 필터를 비활성화한다.
기계학습 방법을 탐색하고, 신경망과 같은 훈련 모델의 동적 최적화 파라미터를 활용한다.
감정 지표와 뉴스 정보와 결합하여, 비구조화된 데이터를 활용하여 효율성을 높여라.
목표 위치 규모 기능을 추가한다. 승률이 높을 때, 상장함으로써 더 높은 수익을 얻을 수 있다.
요약하다
트렌드 선진 전략은 여러 필터와 확인 지표를 도입하여 고전 트렌드 선진 지표를 최적화하고 개선하여 시장 움직임을 더 정확하게 판단하고 신호의 질을 향상시킵니다. 이 전략은 단일 지표에 비해 더 안정적이고 포괄적이며 효율적인 거래 프로그램을 제공합니다. 그러나 동시에 부적절한 변수 조정과 잘못된 판단의 위험을 경계하고 적절한 위험 제어 조치를 취해야합니다.
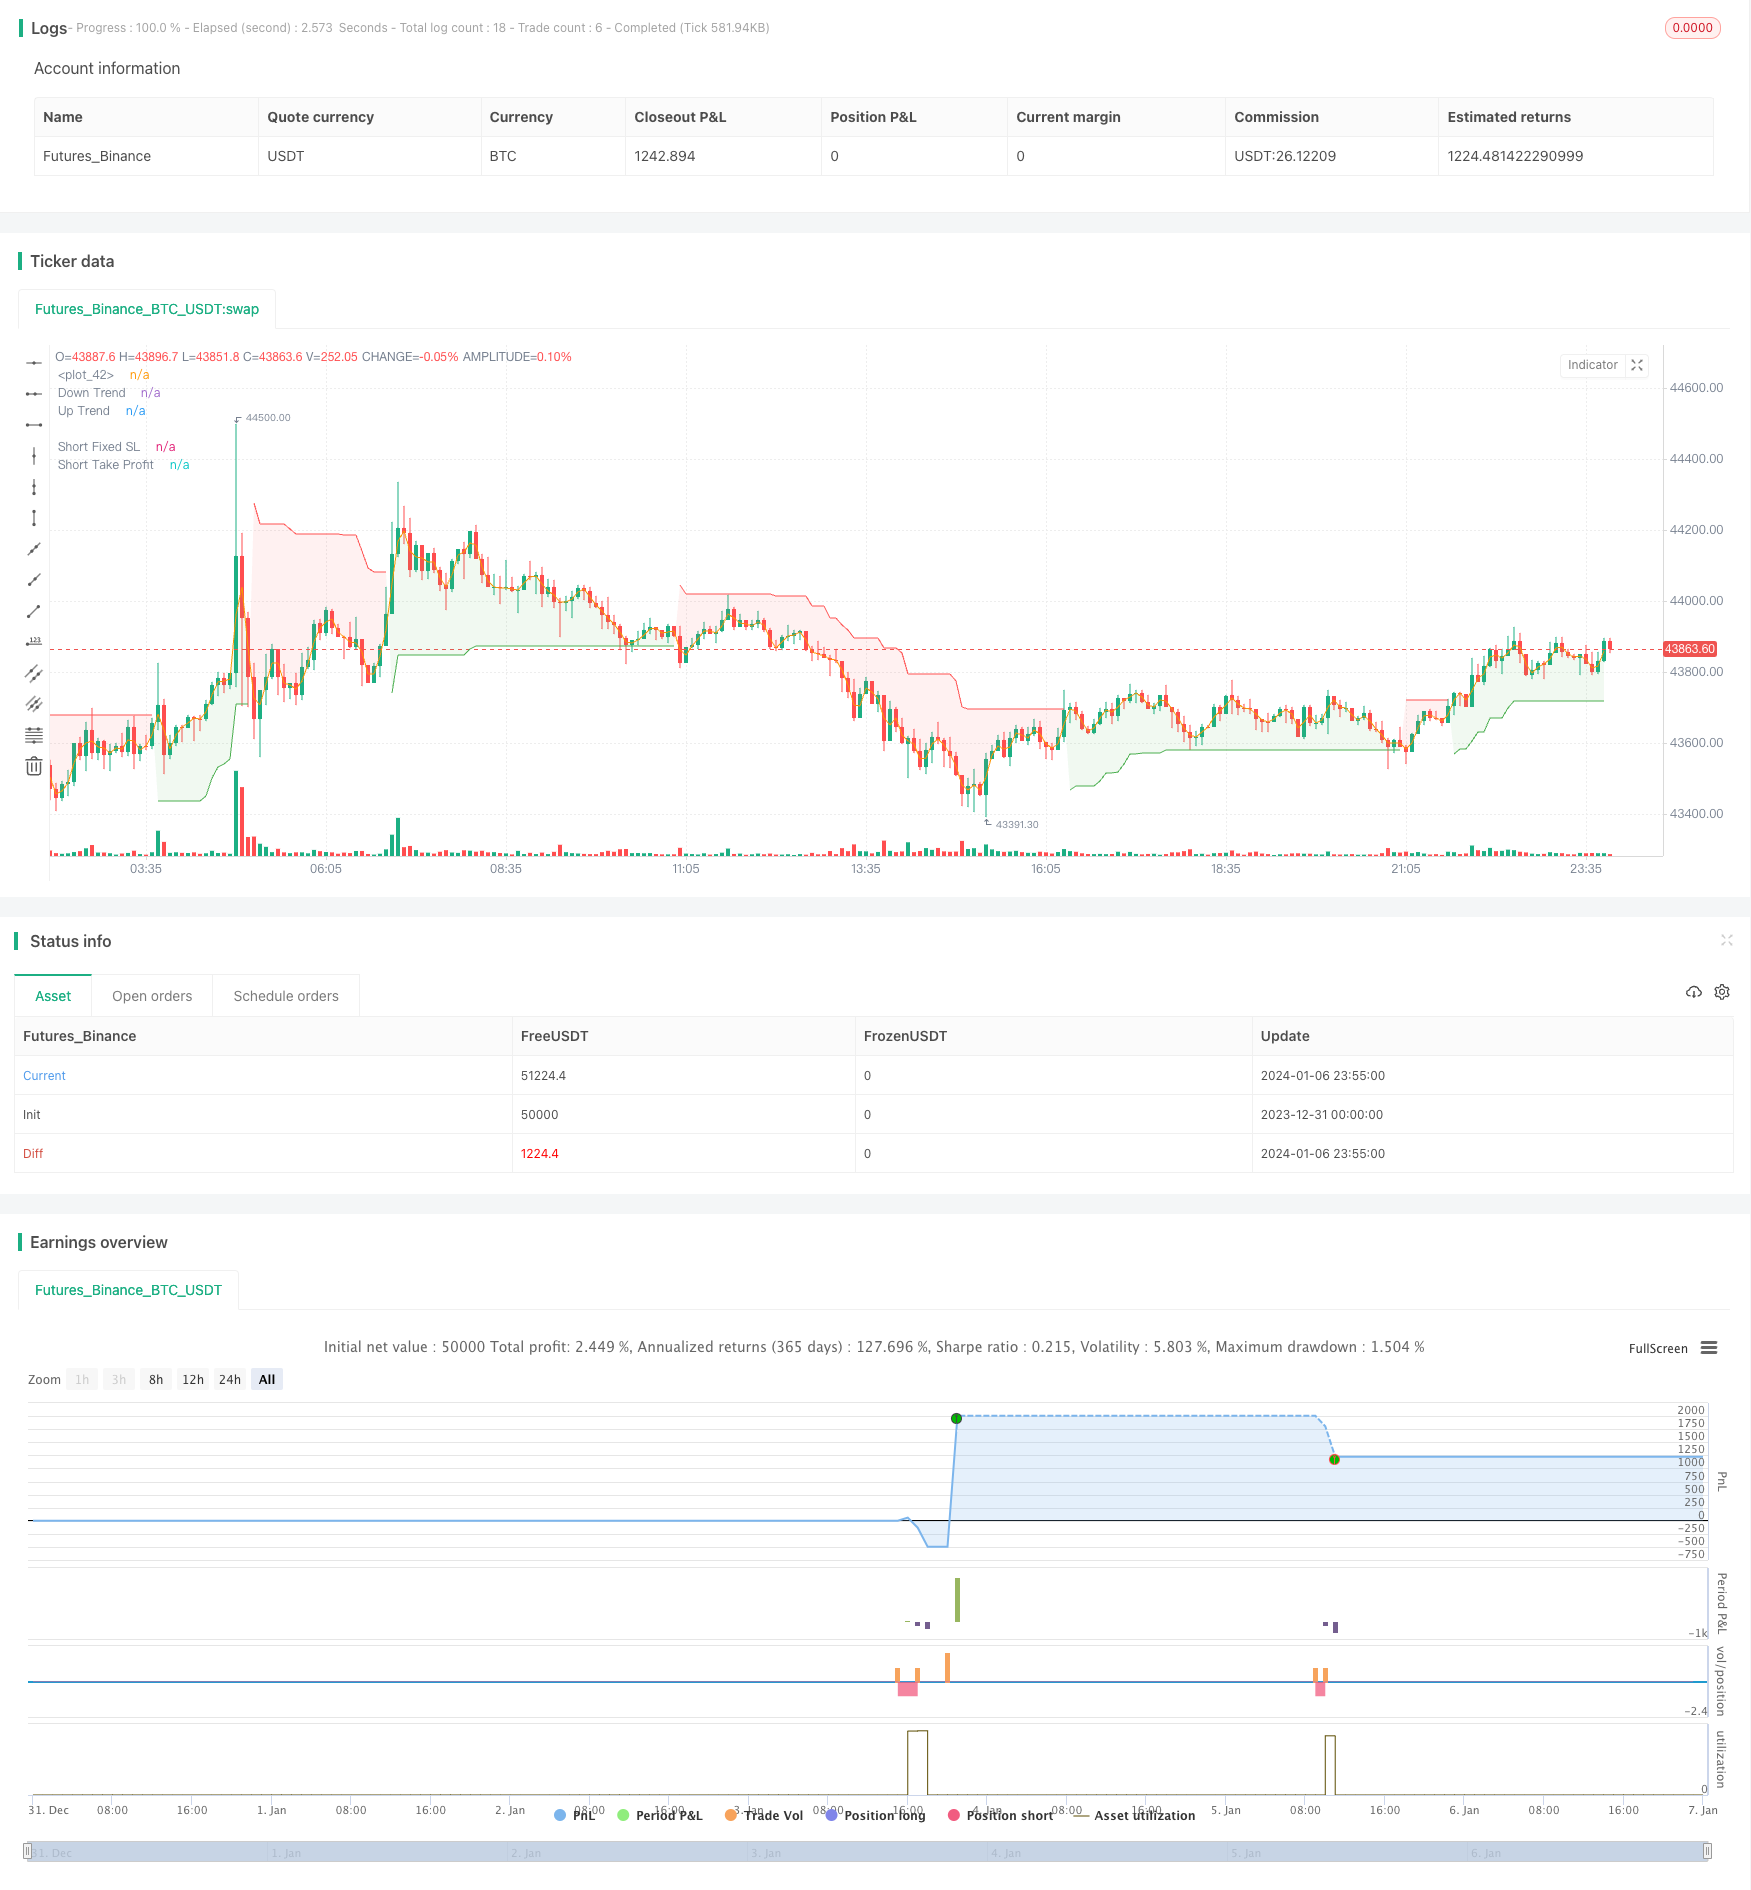
/*backtest
start: 2023-12-31 00:00:00
end: 2024-01-07 00:00:00
period: 5m
basePeriod: 1m
exchanges: [{"eid":"Futures_Binance","currency":"BTC_USDT"}]
*/

// This Pine Script™ code is subject to the terms of the Mozilla Public License 2.0 at https://mozilla.org/MPL/2.0/
// © JS_TechTrading

//@version=5
strategy("Supertrend advance", overlay=true,default_qty_type =strategy.percent_of_equity,default_qty_value = 1,process_orders_on_close = false)

// group string////
var string group_text000="Choose Strategy"
var string group_text0="Supertrend Settings"
var string group_text0000="Ema Settings"
var string group_text00="Rsi Settings"
var string group_text1="Backtest Period"
var string group_text2="Trade Direction"
var string group_text3="Quantity Settings"
var string group_text4="Sl/Tp Settings"
var string group_text5="Enable/Disable Condition Filter"
var string group_macd="Macd Set"
var group_cci="Cci Set"
var string group_text6="Choose Sl/Tp"
var string group_text7="Percentage Sl/Tp"
var string group_text9="Atr SL/Tp"
var string group_text8='Swing Hl & Supertrend Sl/Tp'


// filter enable and disbale
on_ma  =input.bool(true,"Ema Condition On/Off",group=group_text5,inline = "CL")
en_rsi = input.bool(true,"Rsi Condition On/Off",group = group_text5,inline = "CL")
en_macd=input.bool(true,title ="Enable Macd Condition",group =group_text5,inline = "CS")
en_cci=input.bool(true,title ="Enable/Disable CCi Filter",group =group_text5,inline = "CS")

////////////////////
option_ch=input.string('Pullback',title = "Type Of Stratgey",options =['Pullback','Simple'],group = "Choose Strategy Type")

// option for stop loss and take profit
option_ts=input.string("Percentage","Chosse Type Of Sl/tp",["Percentage","Supertrend","Swinghl","Atr"],group=group_text6)
//atr period input supertrend
atrPeriod = input(10, "ATR Length",group = group_text0)
factor = input.float(3.0, "Factor", step = 0.01,group=group_text0)

[supertrend, direction] = ta.supertrend(factor, atrPeriod)

bodyMiddle = plot((open + close) / 2, display=display.none)
upTrend = plot(direction < 0 ? supertrend : na, "Up Trend", color = color.green, style=plot.style_linebr)
downTrend = plot(direction < 0? na : supertrend, "Down Trend", color = color.red, style=plot.style_linebr)

fill(bodyMiddle, upTrend, color.new(color.green, 90), fillgaps=false)
fill(bodyMiddle, downTrend, color.new(color.red, 90), fillgaps=false)

long=direction < 0 ? supertrend : na
short=direction < 0? na : supertrend

longpos=false
shortpos=false

longpos :=long?true :short?false:longpos[1]
shortpos:=short?true:long?false:shortpos[1]

fin_pullbuy= (ta.crossunder(low[1],long) and long and high>high[1])
fin_pullsell=(ta.crossover(high[1],short) and short and low<low[1])

//Ema 1

ma_len= input.int(200, minval=1, title="Ema Length",group = group_text0000)
ma_src = input.source(close, title="Ema Source",group = group_text0000)
ma_out = ta.ema(ma_src, ma_len)

ma_buy=on_ma?close>ma_out?true:false:true
ma_sell=on_ma?close<ma_out?true:false:true

// rsi indicator and condition
// Get user input
rsiSource = input(title='RSI Source', defval=close,group = group_text00)
rsiLength = input(title='RSI Length', defval=14,group = group_text00)
rsiOverbought = input(title='RSI BUY Level', defval=50,group = group_text00)
rsiOversold   = input(title='RSI SELL Level', defval=50,group = group_text00)

// Get RSI value
rsiValue = ta.rsi(rsiSource, rsiLength)

rsi_buy=en_rsi?rsiValue>=rsiOverbought ?true:false:true
rsi_sell=en_rsi?rsiValue<=rsiOversold?true:false:true


// Getting inputs macd

fast_length = input(title="Fast Length", defval=12,group =group_macd)
slow_length = input(title="Slow Length", defval=26,group =group_macd)
macd_src = input(title="Source", defval=close,group =group_macd)
signal_length = input.int(title="Signal Smoothing",  minval = 1, maxval = 50, defval = 9,group =group_macd)

[macdLine, signalLine, histLine] = ta.macd(macd_src, fast_length ,slow_length,signal_length)

buy_macd=en_macd?macdLine>0?true:false:true
sell_macd=en_macd?macdLine<0?true:false:true


// CCI indicator
length_cci = input.int(20, minval=1,group = group_cci)
src_cci = input(hlc3, title="Source",group = group_cci)
cci_gr=input.int(200,title = "CCi > Input",group = group_cci,tooltip ="CCi iS Greater thn 100 buy")
cci_ls=input.int(-200,title = "CCi < -Input",group = group_cci,tooltip  ="CCi iS Less thn -100 Sell")

ma = ta.sma(src_cci, length_cci)
cci = (src_cci - ma) / (0.015 * ta.dev(src_cci, length_cci))

//cci buy and sell
buy_cci=en_cci?cci>cci_gr?true:false:true
sell_cci=en_cci?cci<cci_ls?true:false:true

// final condition
buy_cond=option_ch=='Simple'?long and not(longpos[1]) and rsi_buy and ma_buy and buy_macd and buy_cci:option_ch=='Pullback'?fin_pullbuy and rsi_buy and ma_buy and buy_macd and buy_cci:na
sell_cond=option_ch=='Simple'?short and not(shortpos[1]) and rsi_sell and ma_sell and sell_macd and sell_cci:option_ch=='Pullback'?fin_pullsell and rsi_sell and ma_sell and sell_macd and sell_cci:na

//backtest engine
start = input(timestamp('2005-01-01'), title='Start calculations from',group=group_text1)
end=input(timestamp('2045-03-01'), title='End calculations',group=group_text1)

time_cond = true

// Make input option to configure trade direction

tradeDirection = input.string(title='Trade Direction', options=['Long', 'Short', 'Both'], defval='Both',group = group_text2)

// Translate input into trading conditions
longOK  = (tradeDirection == "Long") or (tradeDirection == "Both")
shortOK = (tradeDirection == "Short") or (tradeDirection == "Both")

// quantity
qty_new=input.float(1.0,step =0.10,title ="Quantity",group =group_text3)

// supertrend and swing high and low

tpnewf = input.float(title="take profit swinghl||supertrend ", step=0.1, defval=1.5, group=group_text8)
hiLen = input.int(title='Highest High Lookback', defval=6, minval=2, group=group_text8)
loLen = input.int(title='Lowest Low Lookback', defval=6, minval=2, group=group_text8)


globl = option_ts=="Swinghl"? nz(ta.lowest(low, loLen),low[1]):option_ts=="Supertrend"?nz(supertrend,low[1]):na
globl2=option_ts=="Swinghl"? nz(ta.highest(high, hiLen),high[1]) :option_ts=="Supertrend"?nz(supertrend,high[1]):na

var store = float(na)
var store2=float(na)

// strategy start
if buy_cond and longOK and time_cond and strategy.position_size==0
    strategy.entry("enter long",direction = strategy.long,qty =qty_new)
    store:=globl

if sell_cond and shortOK and time_cond and strategy.position_size==0
    strategy.entry("enter short",direction =strategy.short,qty =qty_new)
    store2:=globl2


//stop loss and take profit

enable_trail=input.bool(false,"Enable Trail",group =group_text7)
stopPer = input.float(1.0,step=0.10,title='Stop Loss %',group=group_text7)* 0.01
takePer = input.float(2.0,step=0.10, title='Take Profit %',group=group_text7)* 0.01

//TRAILING STOP CODE
trailStop = input.float(title='Trailing Stop (%)', minval=0.0, step=0.1, defval=1,group=group_text7) * 0.01


longStopPrice = 0.0
shortStopPrice = 0.0
longStopPrice := if strategy.position_size > 0
    stopValue = close * (1 - trailStop)
    math.max(stopValue, longStopPrice[1])
else
    0
shortStopPrice := if strategy.position_size < 0
    stopValue = close * (1 + trailStop)
    math.min(stopValue, shortStopPrice[1])
else
    999999

// Determine where you've entered and in what direction
longStop = 0.0
shortStop =0.0
shortTake =0.0
longTake = 0.0

if (option_ts=="Percentage" )
    // Determine where you've entered and in what direction
    longStop  := strategy.position_avg_price * (1 - stopPer)
    shortStop := strategy.position_avg_price * (1 + stopPer)
    shortTake := strategy.position_avg_price * (1 - takePer)
    longTake  := strategy.position_avg_price * (1 + takePer)
if enable_trail and (option_ts=="Percentage" )
    longStop  := longStopPrice
    shortStop := shortStopPrice
//single take profit exit position

if strategy.position_size > 0 and option_ts=="Percentage"
    strategy.exit(id='Close Long',from_entry = "enter long", stop=longStop, limit=longTake)

if strategy.position_size < 0 and option_ts=="Percentage"
    strategy.exit(id='Close Short',from_entry = "enter short", stop=shortStop, limit=shortTake)

//PLOT FIXED SLTP LINE
plot(strategy.position_size > 0 and option_ts=="Percentage" ? longStop : na, style=plot.style_linebr, color=enable_trail?na:color.new(#c0ff52, 0), linewidth=1, title='Long Fixed SL')
plot(strategy.position_size < 0 and option_ts=="Percentage"? shortStop : na, style=plot.style_linebr, color=enable_trail?na:color.new(#5269ff, 0), linewidth=1, title='Short Fixed SL')
plot(strategy.position_size  > 0 and option_ts=="Percentage"? longTake : na, style=plot.style_linebr, color=color.new(#5e6192, 0), linewidth=1, title='Long Take Profit')
plot(strategy.position_size < 0 and option_ts=="Percentage"? shortTake : na, style=plot.style_linebr, color=color.new(#dcb53d, 0), linewidth=1, title='Short Take Profit')


//PLOT TSL LINES
plot(series=strategy.position_size > 0 and option_ts=="Percentage" and enable_trail ? longStopPrice : na, color=color.new(color.red, 0), style=plot.style_linebr, linewidth=1, title='Long Trail Stop', offset=1)
plot(series=strategy.position_size < 0 and option_ts=="Percentage" and enable_trail ? shortStopPrice : na, color=color.new(color.red, 0), style=plot.style_linebr, linewidth=1, title='Short Trail Stop', offset=1)


// swing high and low

//take profit
takeProfit_buy = strategy.position_avg_price - ((store - strategy.position_avg_price) * tpnewf)
takeProfit_sell = strategy.position_avg_price - ((store2  - strategy.position_avg_price) * tpnewf)


// Submit stops based on highest high and lowest low
if strategy.position_size >= 0 and (option_ts=="Swinghl" or option_ts=="Supertrend")
    strategy.exit(id='XL HH',from_entry = "enter long", stop=store,limit=takeProfit_buy,comment ="Long Exit")

if strategy.position_size <= 0 and (option_ts=="Swinghl" or option_ts=="Supertrend")
    strategy.exit(id='XS LL',from_entry = "enter short", stop=store2,limit=takeProfit_sell,comment = "Short Exit")


// plot take profit
plot(series=strategy.position_size < 0 and (option_ts=="Swinghl" or option_ts=="Supertrend")? takeProfit_sell : na, style=plot.style_circles, color=color.orange, linewidth=1, title="take profit sell")
plot(series=strategy.position_size > 0 and (option_ts=="Swinghl" or option_ts=="Supertrend")? takeProfit_buy: na, style=plot.style_circles, color=color.blue, linewidth=1, title="take profit buy")

// Plot stop Loss for visual confirmation
plot(series=strategy.position_size > 0 and (option_ts=="Swinghl" or option_ts=="Supertrend")? store : na, style=plot.style_circles, color=color.new(color.green, 0), linewidth=1, title='Lowest Low Stop')
plot(series=strategy.position_size < 0 and (option_ts=="Swinghl" or option_ts=="Supertrend")? store2 : na, style=plot.style_circles, color=color.new(color.red, 0), linewidth=1, title='Highest High Stop')

// atr
enable_atrtrail=input.bool(false,"Enable Atr Trail",group = group_text9)
atrLength = input(title='ATR Length', defval=14,group =group_text9)
slATRMult = input.float(title='Stop loss ATR multiplier',step=0.1, defval=2.0,group =group_text9)
tpATRMult = input.float(title='Take profit multiplier',step=0.1, defval=1.5,group =group_text9)
lookback = input.int(title='How Far To Look Back For High/Lows', defval=7, minval=1,group =group_text9)


atr = ta.atr(atrLength)
lowestLow = ta.lowest(low, lookback)
highestHigh = ta.highest(high, lookback)
longStopa = (enable_atrtrail ? lowestLow : close) - atr * slATRMult
shortStopa = (enable_atrtrail ? highestHigh : close) + atr * slATRMult

atr_l=0.0
atr_s=0.0

atr_l:=nz(strategy.position_avg_price-(atr[1] * slATRMult),strategy.position_avg_price-(1 * slATRMult))
atr_s:=nz(strategy.position_avg_price+ (atr[1] * slATRMult),strategy.position_avg_price-(1 * slATRMult))

stoploss_l = ta.valuewhen(strategy.position_size != 0 and strategy.position_size[1] == 0,atr_l, 0)
stoploss_s = ta.valuewhen(strategy.position_size != 0 and strategy.position_size[1] == 0,atr_s, 0)

takeprofit_l = strategy.position_avg_price - ((stoploss_l - strategy.position_avg_price) * tpATRMult)
takeprofit_s = strategy.position_avg_price - ((stoploss_s  - strategy.position_avg_price) * tpATRMult)

// Submit stops based on highest high and lowest low
if strategy.position_size > 0 and (option_ts=="Atr")
    strategy.exit(id='Xl', stop= enable_atrtrail?longStopa:stoploss_l,limit=takeprofit_l ,comment ="Long Exit")

if strategy.position_size < 0 and (option_ts=="Atr")
    strategy.exit(id='XH', stop=enable_atrtrail?shortStopa:stoploss_s,limit=takeprofit_s,comment = "Short Exit")


// // plot take profit
plot(series=strategy.position_size > 0 and  (option_ts=="Atr")? takeprofit_l : na, style=plot.style_circles, color=color.orange, linewidth=1, title="take profit sell")
plot(series=strategy.position_size < 0 and  (option_ts=="Atr")? takeprofit_s: na, style=plot.style_circles, color=color.blue, linewidth=1, title="take profit buy")

// Plot stop Loss for visual confirmation
plot(series=strategy.position_size  >0 and (option_ts=="Atr") and not enable_atrtrail? stoploss_l : na, style=plot.style_circles, color=color.new(color.green, 0), linewidth=1, title='Lowest Low Stop')
plot(series=strategy.position_size < 0 and (option_ts=="Atr") and not enable_atrtrail? stoploss_s : na, style=plot.style_circles, color=color.new(color.red, 0), linewidth=1, title='Highest High Stop')

//PLOT TSL LINES
plot(series=strategy.position_size  >0 and option_ts=="Atr" and enable_atrtrail ? longStopa : na, color=color.new(color.green, 0), style=plot.style_linebr, linewidth=1, title='Long Trail Stop', offset=1)
plot(series=strategy.position_size < 0 and (option_ts=="Atr") and enable_atrtrail?  shortStopa : na, style=plot.style_linebr, color=color.new(color.red, 0), linewidth=1, title='short Trail Stop', offset=1)