개요: 이 전략은 일정 기간 동안의 최고 가격과 최저 가격의 차이와 종전 가격 상승의 비율을 계산하여 가격이 추세 상태에 있는지 판단하여 거래 신호 지표로 사용한다.
전략 원칙: 전략의 핵심 지표는 수직 수평 필터 (VHF) 이며, 다음과 같은 공식으로 계산된다:
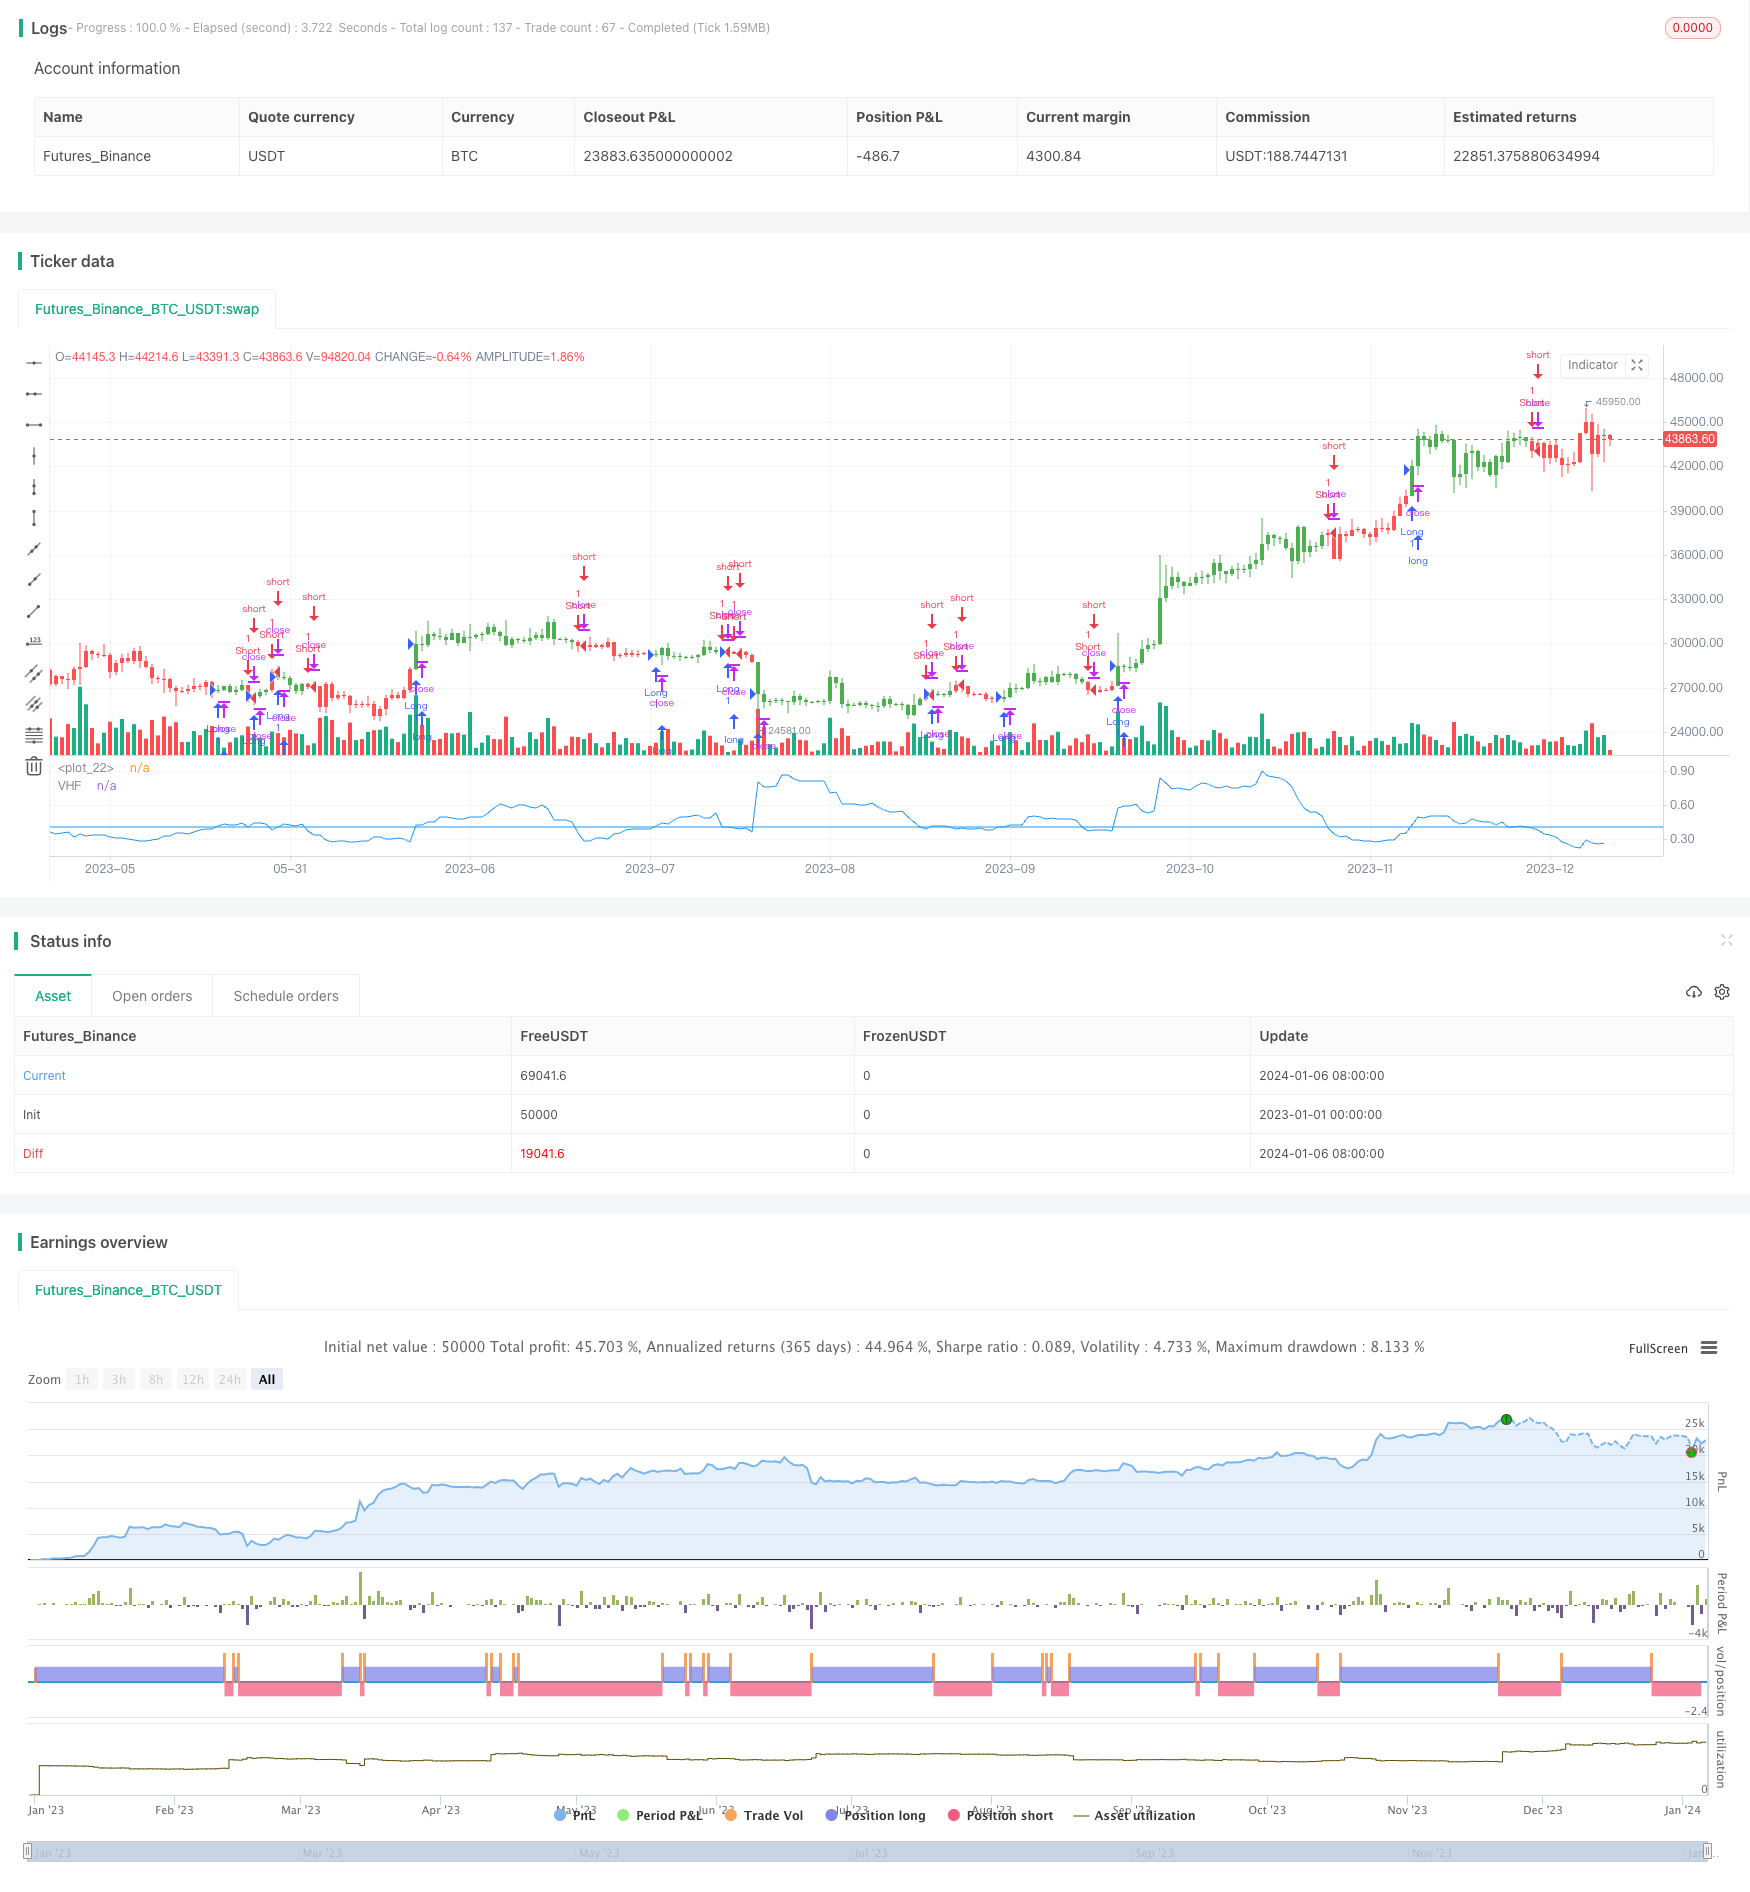
VHF = (Highest(Length) - Lowest(Length)) / SUM(ABS(Close - Close[1]), Length)
이 중 HIGHEST (Length) 과 LOWEST (Length) 은 각각 LENGTH 주기 내의 최고 가격과 최저 가격이다. 분자 부분은 가격의 진동 범위를 반영하고 분자 부분은 가격의 실제 변동량을 반영한다. 그들의 비율은 가격 움직임의 경향성을 판단할 수 있다. VHF가 주어진 신호 절벽보다 높을 때, 가격이 트렌드 상태라고 여겨지며; 주어진 신호 절벽보다 낮을 때, 가격이 전체 디스크 상태라고 여겨진다.
이 전략은 간단하고 직관적이며, 가격 변동 범위와 실제 파동폭을 비교하여 추세를 판단하며, SMA, EMA와 같은 지표에 대한 단일 의존으로 가격 자체의 특성을 무시하는 문제를 피합니다. 그러나 이 전략은 파라미터 최적화에 민감하며, 다른 주기 및 시장 환경에 맞게 길이 및 신호 파라미터를 조정해야합니다.
우위 분석:
- 직관적인 트렌드 판단 지표는 간단하고 효과적입니다.
- 가격 자체의 특성을 고려하여 어떤 곡선 적합성에 의존하지 않습니다.
- 구성 가능한 매개 변수 조정 판단의 민감도.
- 모든 종류의 거래 전략에 쉽게 통합할 수 있습니다.
위험 분석:
- 매개 변수에 민감하고, 부적절한 설정으로 인해 너무 많은 잘못된 트레이드가 발생할 수 있습니다.
- 가격의 전환점을 구분할 수 없는 가짜 경향.
- 대주기 설정은 단주기 가격 변동에 민감하지 않다.
- 단편적 손실을 통제하기 위해 중지 손실과 함께 필요합니다.
최적화 방향:
- 랭스 변수를 최적화하여 트렌드 판단의 민감성을 균형을 잡는다.
- 다른 지표와 함께 VHF 신호를 필터링한다. 예를 들어 MACD는 전환점을 판단한다.
- VHF 곡선을 맞추기 위한 기계학습 방법을 시도해보세요.
- 다양한 주기 설정이 병행되어 다단계 전략 신호를 생성한다.
요약: 이 전략은 가격 자체의 특성에 기반한 직관적 판단 트렌드이며, 간단하고 효과적이며, 추가로 탐구, 최적화 및 검증할 가치가 있으며, 기본 트렌드 판단 도구가 될 수 있으며, 양적 거래 전략에 널리 사용됩니다.
/*backtest
start: 2023-01-01 00:00:00
end: 2024-01-07 00:00:00
period: 1d
basePeriod: 1h
exchanges: [{"eid":"Futures_Binance","currency":"BTC_USDT"}]
*/

//@version=2
////////////////////////////////////////////////////////////
//  Copyright by HPotter v1.0 27/04/2018
// Vertical Horizontal Filter was initiated by Adam White. It was first published
// in a magazine called “Issues of Futures” in August, 1991. The Vertical Horizontal
// Filter (VHF) is a very common Indicator used by traders to find out the Phase of
// a Price Trend. Normally, a price trend can be in a Trending Phase or a Congestion
// Phase/Choppy Movement Phase. Adam White created this particular Technical Indicator
// to determine whether prices are trending in a particular direction or are they going
// through a transitional period. He used it to measure the range of Futures available
// in the market.
//
// You can change long to short in the Input Settings
// WARNING:
//  - For purpose educate only
//  - This script to change bars colors.
////////////////////////////////////////////////////////////
strategy(title="Vertical Horizontal Filter Backtest")
Length = input(28, minval=1)
Signal = input(0.4, step=0.01)
reverse = input(false, title="Trade reverse")
hline(Signal, color=blue, linestyle=line)
xHH = highest(high, Length)
xLL = lowest(low, Length)
xNumerator = abs(xHH - xLL)
xDenominator = sum(abs(close - close[1]), Length)
xVHF = xNumerator / xDenominator
pos = iff(xVHF > Signal, 1,
       iff(xVHF < Signal, -1, nz(pos[1], 0)))
possig = iff(reverse and pos == 1, -1,
          iff(reverse and pos == -1, 1, pos))
if (possig == 1)
    strategy.entry("Long", strategy.long)
if (possig == -1)
    strategy.entry("Short", strategy.short)
barcolor(possig == -1 ? red: possig == 1 ? green : blue )
plot(xVHF, color=blue, title="VHF")