개요
이 전략의 목적은 낮은 변동률과 높은 변동률 기간 동안의 자산 구매 사이의 차이를 연구하는 것입니다. 그것은 사용자가 모드 입력 변수를 변경하여 낮은 변동률과 높은 변동률 기간 동안 구매를 선택할 수 있도록합니다.
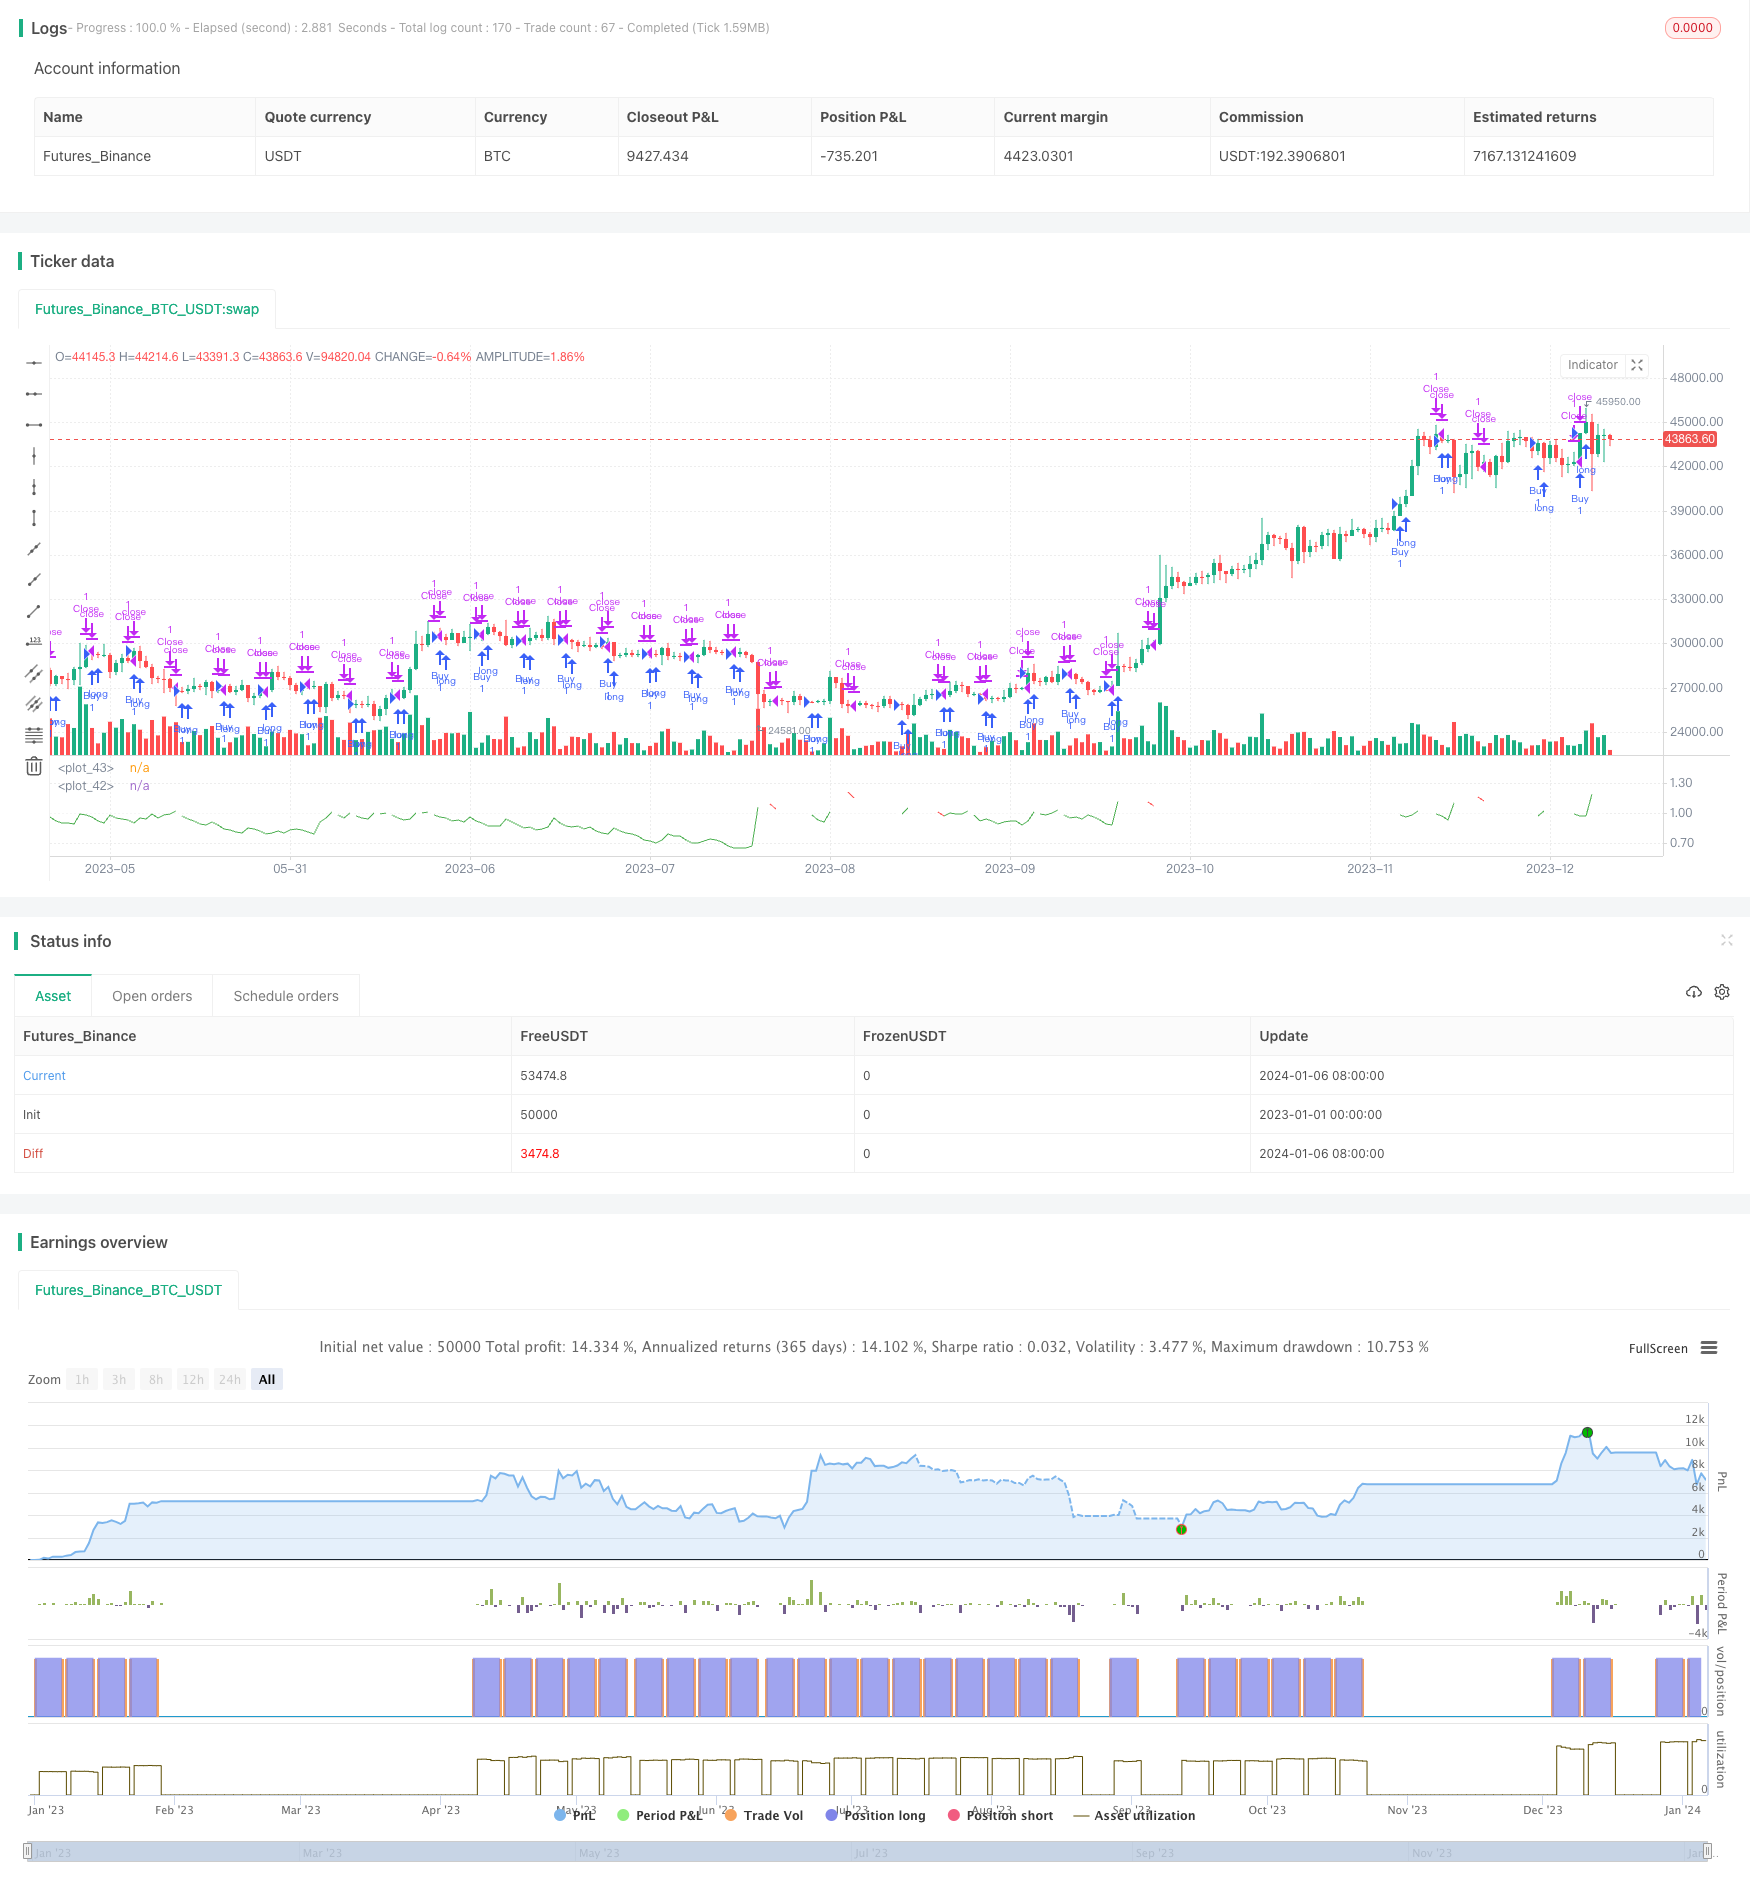
전략 원칙
이 전략은 ATR과 그것의 SMA를 계산하여 변동률을 결정한다. 구체적으로, ATR의 SMA를 계산하고, 그 다음 ATR과 그것의 SMA의 비율을 계산한다. 이 비율이 사용자 정의된 기한 volatilityTargetRatio보다 높으면 변동률이 높다고 간주되며, 그 기한보다 낮으면 변동률이 낮다고 간주된다.
사용자가 선택한 모드에 따라 전략은 변동이 높거나 낮을 때 구매 신호를 냅니다. 구매 한 번, 전략은 특정 수의 바를 보유합니다 (sellAfterNBarsLength에 의해 정의), 그리고 평점.
우위 분석
이 전략의 주요 장점은 다음과 같습니다.
- 낮은 변동율과 높은 변동율 동안의 구매 전략의 성과를 직관적으로 비교할 수 있다.
- SMA를 사용하여 ATR을 매끄럽게 하고, 가짜 돌파구를 필터링할 수 있다.
- 다양한 변동률 레벨을 조정하여 테스트 할 수 있습니다.
위험 분석
이 전략의 주요 위험은 다음과 같습니다.
- 만약 낮은 변동률만을 구매한다면, 가격이 상승할 기회를 놓칠 수 있습니다.
- 만약 높은 변동률만을 구매한다면 시스템 위험을 증가시킬 수 있다.
- 잘못된 매개 변수 설정으로 인해 구매 시기를 놓치거나 조기 청산될 수 있다.
이 위험은 변수를 조정하여 다양한 수준의 변동성을 조합하여 구매함으로써 완화 될 수 있습니다.
최적화 방향
이 전략은 더 개선될 수 있습니다.
- 다른 ATR 길이 변수를 테스트하십시오.
- 더 많은 손실을 막는 전략
- 다른 지표와 함께 필터링 가짜 돌파구.
- 평화적 조건에 대한 최적화 구매.
요약하다
이 전략은 낮은 변동성 및 높은 변동성 구매 전략의 성과를 효과적으로 비교할 수 있습니다. 그것은 SMA를 사용하여 ATR을 부드럽게하고 변동성 수준에 따라 거래 신호를 생성합니다. 이 전략은 파라미터를 조정하고 최적화 조건을 통해 개선 할 수 있습니다.
전략 소스 코드
/*backtest
start: 2023-01-01 00:00:00
end: 2024-01-07 00:00:00
period: 1d
basePeriod: 1h
exchanges: [{"eid":"Futures_Binance","currency":"BTC_USDT"}]
*/

// This source code is subject to the terms of the Mozilla Public License 2.0 at https://mozilla.org/MPL/2.0/
// © I11L

//@version=5
strategy("I11L - Better Buy Low Volatility or High Volatility?", overlay=false)

mode = input.string("Buy low Volatility",options = ["Buy low Volatility","Buy high Volatility"])
volatilityTargetRatio = input.float(1,minval = 0, maxval = 100,step=0.1, tooltip="1 equals the average atr for the security, a lower value means that the volatility is lower")
atrLength = input.int(14)

atr = ta.atr(atrLength) / close
avg_atr = ta.sma(atr,atrLength*5)
ratio = atr / avg_atr

sellAfterNBarsLength = input.int(5, step=5, minval=0)


var holdingBarsCounter = 0

if(strategy.opentrades > 0)
    holdingBarsCounter := holdingBarsCounter + 1


isBuy = false

if(mode == "Buy low Volatility")
    isBuy := ratio < volatilityTargetRatio
else
    isBuy := ratio > volatilityTargetRatio

isClose = holdingBarsCounter > sellAfterNBarsLength


if(isBuy)
    strategy.entry("Buy",strategy.long)

if(isClose)
    holdingBarsCounter := 0
    strategy.exit("Close",limit=close)

plot(ratio, color=isBuy[1] ? color.green : isClose[1] ? color.red : color.white)
plot(1, color=color.white)