개요
이 전략은 여러 종류의 이동 평균을 계산하고 도출하여 이동 평균 사이의 교차 신호를 구현하여 구매 및 판매 신호를 발송합니다.
전략 원칙
- 전략은 SMA, EMA, WMA 등 다양한 유형의 이동 평균을 선택할 수 있습니다.
- 전략은 주요 이동 평균을 계산하고, 또한 두 번째 이동 평균을 선택할 수 있습니다.
- 주요 이동 평균과 두 번째 이동 평균의 교차 상황을 통해 시장의 빈 상태를 판단하십시오.
- 주요 이동 평균 위에 자신의 지정된 주기의 이동 평균을 횡단할 때, 구매 신호를 생성한다. 주요 이동 평균 아래에 자신의 지정된 주기의 이동 평균을 횡단할 때, 판매 신호를 생성한다.
- 이렇게, 이동 평균의 교차 상황을 통해 시장의 빈 상태를 보다 명확하게 판단할 수 있다.
전략적 이점
- 이동 평균 유형을 사용자 정의 할 수 있습니다.
- 두 번째 이동 평균을 추가하여 신호를 더 명확하게 할 수 있습니다.
- 사용자 정의 이동 평균 주기, 다른 시간 기간에 적용한다.
- 평평한 색상 렌더링으로 그래픽이 더 선명하게 됩니다.
- 교차 신호 메커니즘을 사용하여 다공태를 정확하게 판단한다.
위험과 최적화 전략
- 이동 평균은 지연성이 있으며, 가짜 신호가 발생할 수 있다. 이동 평균에 적합한 곡선을 선택할 수 있다.
- 이동 평균 주기가 잘못 설정되어 놓친 거래 기회를 초래할 수 있습니다. 더 많은 조합을 테스트하여 최적의 매개 변수를 찾을 수 있습니다.
- 거래량 에너지 지표와 같은 다른 지표와 결합하여 검증하는 것이 권장되며 위험을 줄일 수 있습니다.
- 신호의 이동 평균을 curl 평균으로 바꾸어 신호의 정확도를 향상시킬 수 있다.
- 전략적 최적화를 위해 LSTM와 같은 딥러닝 모델과 결합할 수 있다.
요약하다
이 전략은 전체적으로 명확하고, 이동 평균의 교차 원리를 사용하여 시장의 공백 상태를 판단하고, 다양한 요구에 맞게 사용자 정의 할 수 있습니다. 또한 몇 가지 문제가 있지만, 최적화된 모델과 매개 변수를 통해 개선 할 수 있습니다. 전체적으로, 이 전략은 이동 평균을 기반으로 한 거래 전략의 전형적인 대표자입니다.
전략 소스 코드
/*backtest
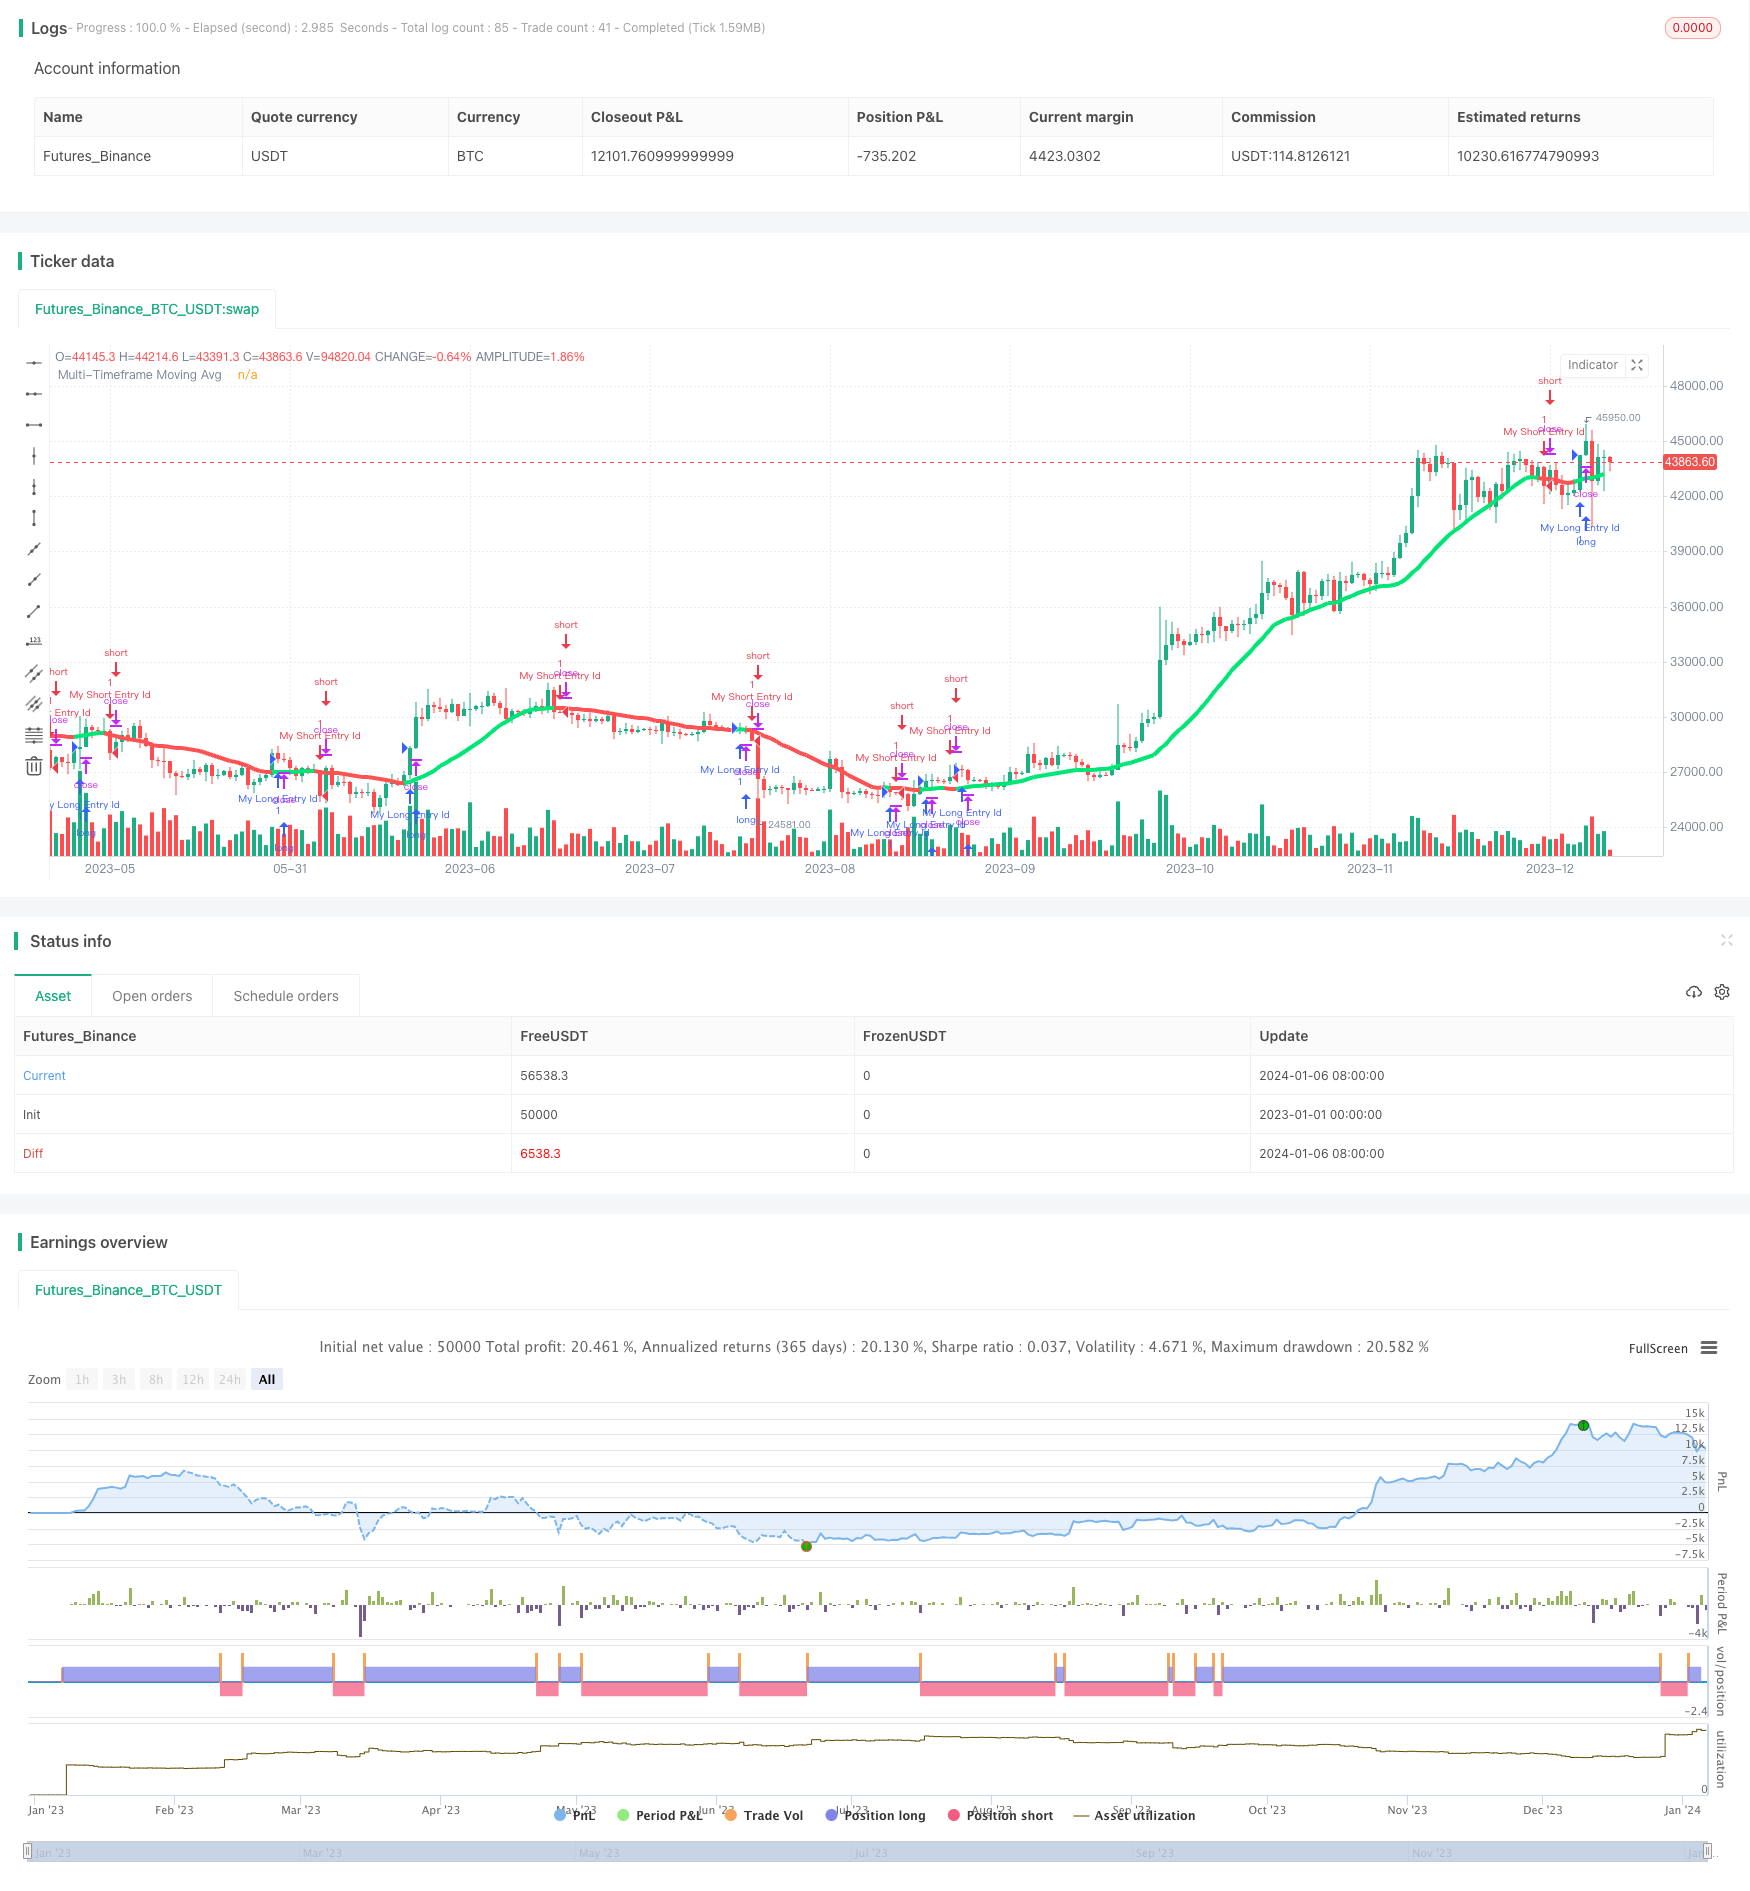
start: 2023-01-01 00:00:00
end: 2024-01-07 00:00:00
period: 1d
basePeriod: 1h
exchanges: [{"eid":"Futures_Binance","currency":"BTC_USDT"}]
*/
//@version=3
strategy("Moving averages-Strategy", overlay=true)
//Created by user ChrisMoody 4-24-2014
//Plots The Majority of Moving Averages
//Defaults to Current Chart Time Frame --- But Can Be Changed to Higher Or Lower Time Frames
//2nd MA Capability with Show Crosses Feature
//inputs
src = close
useCurrentRes = input(true, title="Use Current Chart Resolution?")
resCustom = input(title="Use Different Timeframe? Uncheck Box Above",defval="D")
len = input(20, title="Moving Average Length - LookBack Period")
atype = input(1,minval=1,maxval=7,title="1=SMA, 2=EMA, 3=WMA, 4=HullMA, 5=VWMA, 6=RMA, 7=TEMA")
cc = input(true,title="Change Color Based On Direction?")
smoothe = input(2, minval=1, maxval=10, title="Color Smoothing - 1 = No Smoothing")
doma2 = input(false, title="Optional 2nd Moving Average")
len2 = input(50, title="Moving Average Length - Optional 2nd MA")
atype2 = input(1,minval=1,maxval=7,title="1=SMA, 2=EMA, 3=WMA, 4=HullMA, 5=VWMA, 6=RMA, 7=TEMA")
cc2 = input(true,title="Change Color Based On Direction 2nd MA?")
warn = input(false, title="***You Can Turn On The Show Dots Parameter Below Without Plotting 2nd MA to See Crosses***")
warn2 = input(false, title="***If Using Cross Feature W/O Plotting 2ndMA - Make Sure 2ndMA Parameters are Set Correctly***")
sd = input(false, title="Show Dots on Cross of Both MA's")
res = useCurrentRes ? timeframe.period : resCustom
//hull ma definition
hullma = wma(2*wma(src, len/2)-wma(src, len), round(sqrt(len)))
//TEMA definition
ema1 = ema(src, len)
ema2 = ema(ema1, len)
ema3 = ema(ema2, len)
tema = 3 * (ema1 - ema2) + ema3
avg = atype == 1 ? sma(src,len) : atype == 2 ? ema(src,len) : atype == 3 ? wma(src,len) : atype == 4 ? hullma : atype == 5 ? vwma(src, len) : atype == 6 ? rma(src,len) : tema
//2nd Ma - hull ma definition
hullma2 = wma(2*wma(src, len2/2)-wma(src, len2), round(sqrt(len2)))
//2nd MA TEMA definition
sema1 = ema(src, len2)
sema2 = ema(sema1, len2)
sema3 = ema(sema2, len2)
stema = 3 * (sema1 - sema2) + sema3
avg2 = atype2 == 1 ? sma(src,len2) : atype2 == 2 ? ema(src,len2) : atype2 == 3 ? wma(src,len2) : atype2 == 4 ? hullma2 : atype2 == 5 ? vwma(src, len2) : atype2 == 6 ? rma(src,len2) : tema
out = avg
out_two = avg2
out1 = request.security(syminfo.tickerid, res, out)
out2 = request.security(syminfo.tickerid, res, out_two)
ma_up = out1 >= out1[smoothe]
ma_down = out1 < out1[smoothe]
col = cc ? ma_up ? lime : ma_down ? red : aqua : aqua
col2 = cc2 ? ma_up ? lime : ma_down ? red : aqua : aqua
circleYPosition = out2
plot(out1, title="Multi-Timeframe Moving Avg", style=line, linewidth=4, color = col)
plot(doma2 and out2 ? out2 : na, title="2nd Multi-TimeFrame Moving Average", style=circles, linewidth=4, color=col2)
plot(sd and cross(out1, out2) ? circleYPosition : na,style=cross, linewidth=5, color=yellow)
longCondition = crossover(out1, out1[smoothe])
if (longCondition)
strategy.entry("My Long Entry Id", strategy.long)
shortCondition = crossunder(out1, out1[smoothe])
if (shortCondition)
strategy.entry("My Short Entry Id", strategy.short)