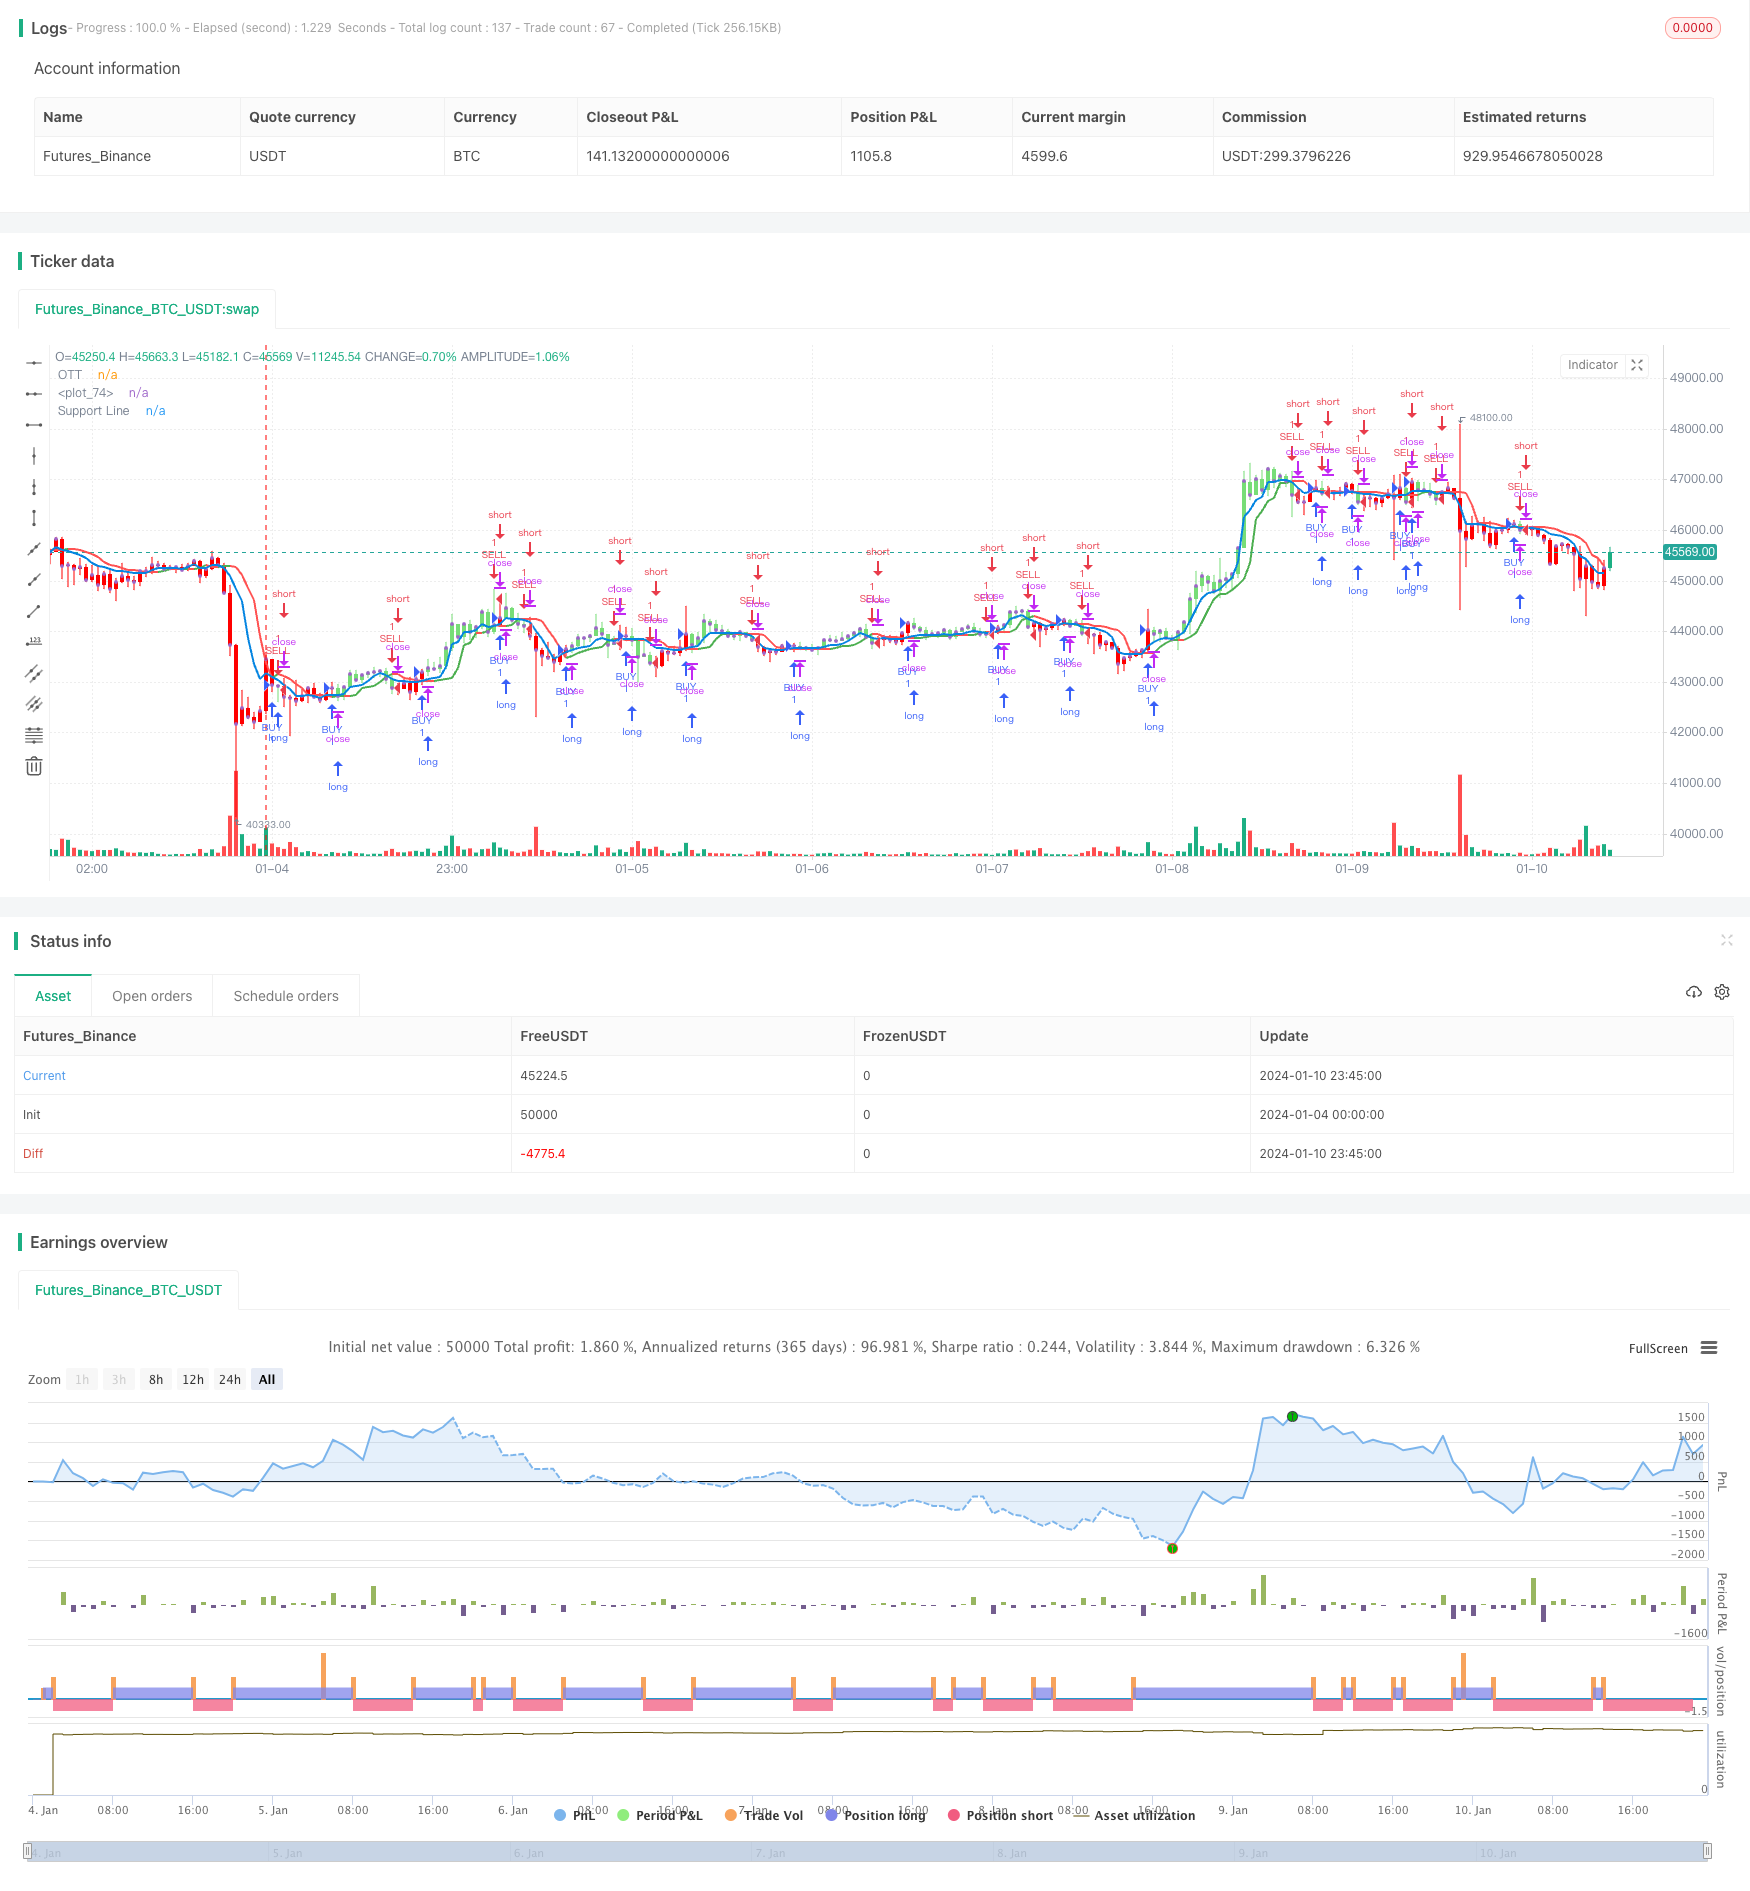
개요
이 전략은 CMO 지표와 변화율을 계산하여 지지선을 동적으로 그리는 것이다. 가격이 지지선을 돌파할 때 거래 신호를 생성한다. 또한, 이 전략은 지지선 근처의 중지 범위를 최적화하여 더 많은 이익을 잠금하는 것이다.
전략 원칙
- 가격 추세를 판단하는 CMO 지표를 계산합니다.
- 변동률 Var을 계산하여 가격 변화의 추세를 반영합니다.
- 변화율에 따라 지원선을 그리기
- 최적화된 정지선 longStop와 shortStop을 계산합니다.
- 거래 신호는 가격의 지원 라인을 뚫을 때 발생
우위 분석
- CMO 지표를 사용하여 가격 동향을 파악하고 가짜 돌파구를 피하십시오.
- 지원선은 트렌드 방향을 명확하게 판단합니다.
- 최적화된 스톱 라인은 더 많은 수익을 고정할 수 있습니다.
- 거래 신호는 간단하고 명확하며, 계산이 쉽다.
위험 분석
- CMO 지표가 뒤쳐져 있고, 가격 전환점을 놓칠 수 있다
- 지원선이 뚫려서 가짜 신호가 발생할 수 있다.
- 부적절한 정지 범위 최적화로 인해 더 큰 손실이 발생할 수 있습니다.
위험 해결 방법:
- CMO 변수를 적절하게 조정하여 미흡한 시간을 줄여주기
- 다른 지표와 함께 가짜 신호를 필터링
- 테스트는 적절한 제약 최적화 비율을 결정합니다.
최적화 방향
- 더 많은 지표가 결합되어 가짜 신호를 필터링합니다.
- AI가 자동으로 손해의 범위를 최적화합니다.
- 자동 조정 거래량
요약하다
이 전략은 전반적으로 효과가 좋으며, 지원선을 사용하여 트렌드 방향을 명확하게 판단한다. CMO 지표와 최적화된 스톱로스를 결합하는 동시에 좋은 효과를 얻는다. 그러나 특정 잘못된 신호의 위험이 있으며, 여러 지표 조합을 통해 최적화 할 수 있다.
전략 소스 코드
/*backtest
start: 2024-01-04 00:00:00
end: 2024-01-11 00:00:00
period: 45m
basePeriod: 5m
exchanges: [{"eid":"Futures_Binance","currency":"BTC_USDT"}]
*/

// This source code is subject to the terms of the Mozilla Public License 2.0 at https://mozilla.org/MPL/2.0/
// © melihtuna

//@version=4
strategy("Optimized Trend Tracker - Strategy Version", shorttitle="OTT-Strategy", overlay=true, default_qty_type=strategy.percent_of_equity, default_qty_value=100, initial_capital=10000, currency=currency.USD, commission_value=0.1, commission_type=strategy.commission.percent)

src = input(close, title="Source")
pds=input(1, "OTT Period", minval=1)
percent=input(0.1, "OTT Percent", type=input.float, step=0.1, minval=0)
condition = input(title="Condition", defval="Support Line Crossing Signals", options=["Price/OTT Crossing Signals", "Support Line Crossing Signals"])
showsupport = input(title="Show Support Line?", type=input.bool, defval=true)
highlight = input(title="Show OTT Color Changes?", type=input.bool, defval=true)
highlighting = input(title="Highlighter On/Off ?", type=input.bool, defval=true)
barcoloing = input(title="Barcolor On/Off ?", type=input.bool, defval=true)
showlabels = input(title="Show OTT BUY/SELl Labels?", type=input.bool, defval=false)

// === INPUT BACKTEST RANGE ===
FromMonth = input(defval = 1, title = "From Month", minval = 1, maxval = 12)
FromDay   = input(defval = 1, title = "From Day", minval = 1, maxval = 31)
FromYear  = input(defval = 2020, title = "From Year", minval = 2017)
ToMonth   = input(defval = 1, title = "To Month", minval = 1, maxval = 12)
ToDay     = input(defval = 1, title = "To Day", minval = 1, maxval = 31)
ToYear    = input(defval = 9999, title = "To Year", minval = 2017)

// === FUNCTION EXAMPLE ===
start     = timestamp(FromYear, FromMonth, FromDay, 00, 00)  // backtest start window
finish    = timestamp(ToYear, ToMonth, ToDay, 23, 59)        // backtest finish window
window()  => time >= start and time <= finish ? true : false // create function "within window of time"

alpha=2/(pds+1)
ud1=src>src[1] ? src-src[1] : src
dd1=src<src[1] ? src[1]-src : src
UD=sum(ud1,9)
DD=sum(dd1,9)
CMO=(UD-DD)/(UD+DD)
k= abs(CMO)
Var=0.0
Var:=(alpha*k*src)+(1-alpha*k)*nz(Var[1])
fark=Var*percent*0.01
longStop = Var - fark
longStopPrev = nz(longStop[1], longStop)
longStop := Var > longStopPrev ? max(longStop, longStopPrev) : longStop
shortStop =  Var + fark
shortStopPrev = nz(shortStop[1], shortStop)
shortStop := Var < shortStopPrev ? min(shortStop, shortStopPrev) : shortStop
dir = 1
dir := nz(dir[1], dir)
dir := dir == -1 and Var > shortStopPrev ? 1 : dir == 1 and Var < longStopPrev ? -1 : dir
MT = dir==1 ? longStop: shortStop
OTT=Var>MT ? MT*(200+percent)/200 : MT*(200-percent)/200
plot(showsupport ? Var : na, color=#0585E1, linewidth=2, title="Support Line")
OTTC = highlight ? OTT[2] > OTT[3] ? color.green : color.red : #B800D9
pALL=plot(nz(OTT[2]), color=OTTC, linewidth=2, title="OTT", transp=0)

buySignalk = window() and crossover(Var, OTT[2])
sellSignallk = window() and crossunder(Var, OTT[2])
buySignalc = window() and crossover(src, OTT[2])
sellSignallc = window() and crossunder(src, OTT[2])

plotshape(condition == "Support Line Crossing Signals" ? showlabels and buySignalk ? OTT*0.995 : na : showlabels and buySignalc ? OTT*0.995 : na, title="BUY", text="BUY", location=location.belowbar, style=shape.labelup, size=size.tiny, color=#0F18BF, textcolor=color.white, transp=0)
plotshape(condition == "Support Line Crossing Signals" ? showlabels and sellSignallk ? OTT*1.005 : na : showlabels and sellSignallc ? OTT*1.005 : na, title="SELL", text="SELL", location=location.abovebar, style=shape.labeldown, size=size.tiny, color=#0F18BF, textcolor=color.white, transp=0)

ottBuyColor=#77DD77
ottSellColor=#FF0000
vColor = strategy.position_size > 0 ? ottBuyColor : ottSellColor

if condition == "Support Line Crossing Signals"
    strategy.entry("BUY", true, 1, when = buySignalk)
    strategy.entry("SELL", false, 1, when = sellSignallk)
else
    strategy.entry("BUY", true, 1, when = buySignalc)
    strategy.entry("SELL", false, 1, when = sellSignallc)

mPlot = plot(close, title="", style=plot.style_circles, linewidth=0,display=display.none)

longFillColor = highlighting ? (Var>OTT ? color.green : na) : na
shortFillColor = highlighting ? (Var<OTT ? color.red : na) : na
fill(mPlot, pALL, title="UpTrend Highligter", color=longFillColor)
fill(mPlot, pALL, title="DownTrend Highligter", color=shortFillColor)

barcolor(barcoloing ? vColor : na)