개요
압력 지표 추적 전략은 알렉산더 엘더 박사의 엘더 레이 지표에 따라 시장의 구매 및 판매 압력을 측정하기 위해 설계되었습니다. 이 전략은 13 일 지수 이동 평균을 사용하여 시장 가치에 대한 공감대를 나타냅니다. 압력 지표는 판매자가 공감대를 낮추는 능력을 측정하는 데 사용됩니다.
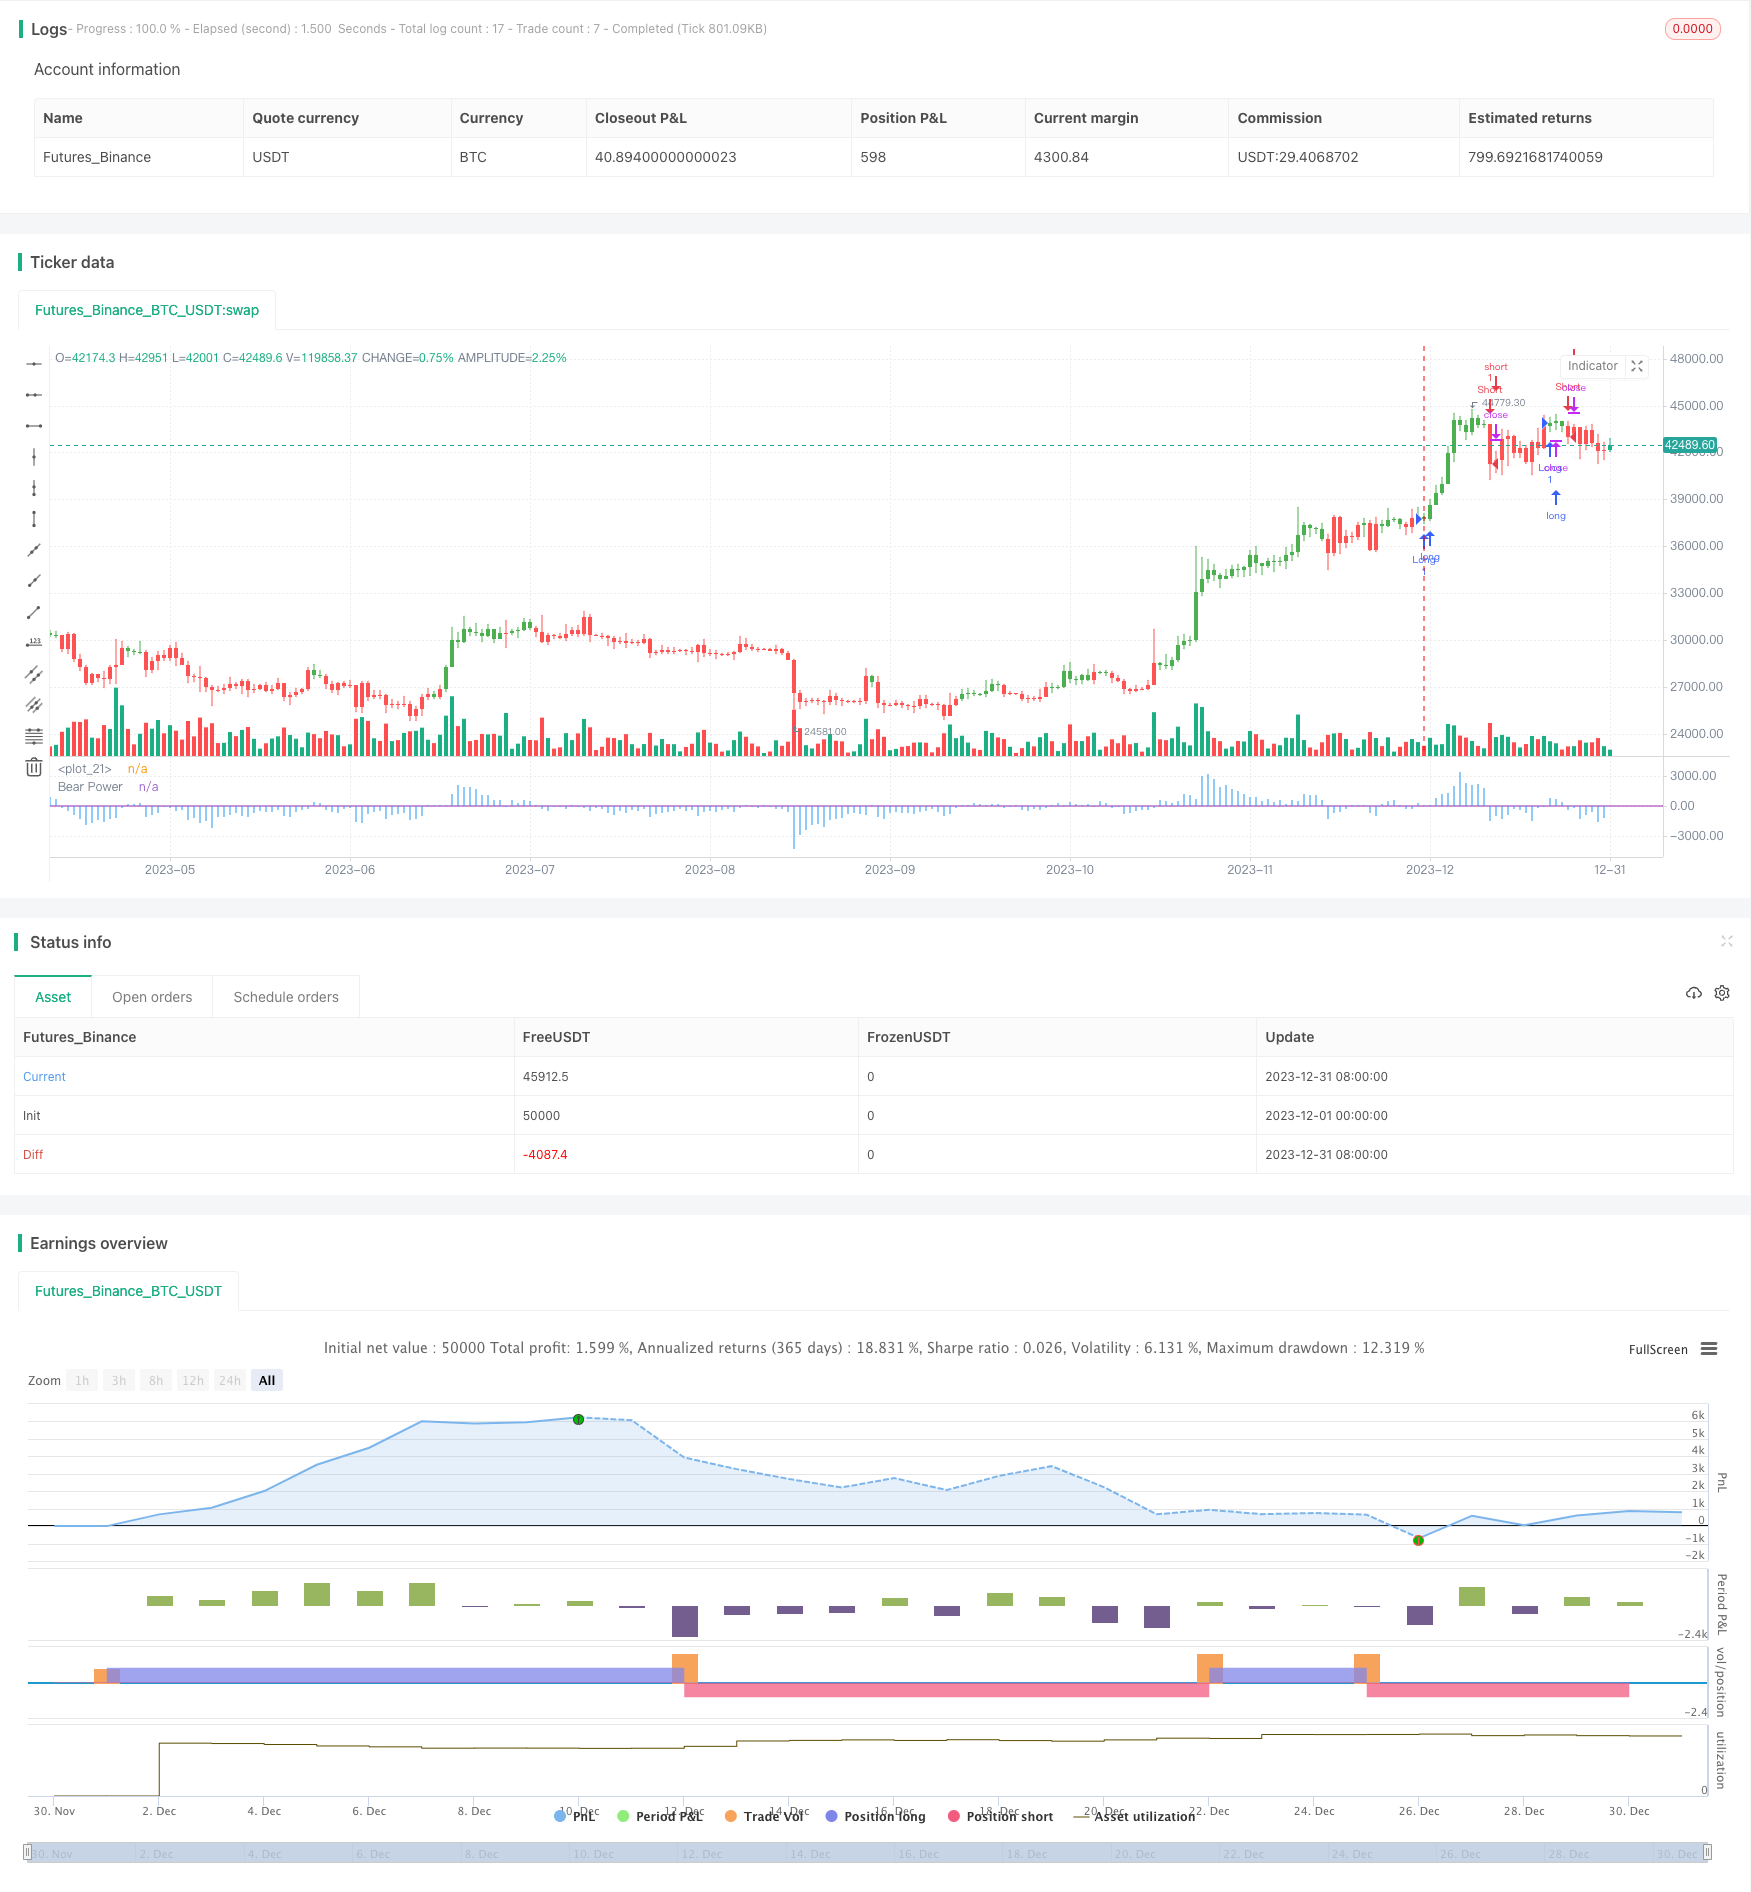
전략 원칙
이 전략의 핵심 지표는 견제 지표이며, 당일 최저 가격에서 13일 지수 이동 평균을 것으로 계산된다. 견제 지표는 지정된 하위치를 착용할 때 더하고, 착용할 때 더空한다. 그것은 평균 합의 값을 낮추는 판매자의 능력을 반영한다.
또한, 다공방향은 거래를 통해 역방향 변수를 전환할 수 있다. 이 변수는 타입이고, False로 기본 설정된다. True일 때는 신호가 발송될 때 역방향 동작한다.
이 전략은 간단하고 실용적이며, 하나의 지표로 다공영 방향을 판단하여 쉽게 구현할 수 있다.
우위 분석
이 전략은 다음과 같은 장점을 가지고 있습니다.
- 단일 지표를 사용하여 간단하고 이해하기 쉽고 적용할 수 있습니다.
- 다양한 시장 환경에 적용할 수 있는 유연하게 조정 가능한 매개 변수
- 선택 가능한 역전 거래, 풍부한 전략 유형
위험 분석
이 전략에는 몇 가지 위험도 있습니다.
- 단 하나의 지표는 잘못된 신호를 유발할 수 있습니다.
- 손해배상을 고려하지 않았기 때문에 더 큰 손실이 발생할 수 있습니다.
- 잘못된 매개 변수는 너무 자주 거래할 수 있습니다.
다중 지표 확인, 스톱로스 설정, 변수 조정 등의 방법으로 더 이상 최적화 할 수 있다.
최적화 방향
이 전략은 몇 가지 측면에서 최적화될 수 있습니다.
- 가짜 돌파를 방지하기 위해 MACD, KDJ 등과 같은 다른 지표 필터 신호를 추가합니다.
- 손실을 제한하기 위한 이동적 손실을 추가합니다.
- 지표 변수를 최적화하고, 입출소를 조정합니다
- 주식 기본 요소와 결합된 주식 선택도 고려할 수 있습니다.
- 다른 전략의 조합으로 사용할 수 있습니다.
요약하다
압력 지표 추적 전략의 개념은 간단하며, 단일 지표와 지정된 스릴값을 비교하여 입구와 출구를 판단하여 조작하기 쉽다. 그러나 지표 기반 전략으로서, 최적화 할 수있는 공간은 넓으며, 지표, 중지 손실, 주식 선별 등의 측면에서 통합적으로 최적화 할 수 있으므로 전략이 더 안정적이고 신뢰할 수 있습니다.
전략 소스 코드
/*backtest
start: 2023-12-01 00:00:00
end: 2023-12-31 23:59:59
period: 1d
basePeriod: 1h
exchanges: [{"eid":"Futures_Binance","currency":"BTC_USDT"}]
*/

//@version = 2
////////////////////////////////////////////////////////////
//  Copyright by HPotter v1.0 07/12/2016
// Developed by Dr Alexander Elder, the Elder-ray indicator measures buying
// and selling pressure in the market. The Elder-ray is often used as part
// of the Triple Screen trading system but may also be used on its own.
// Dr Elder uses a 13-day exponential moving average (EMA) to indicate the
// market consensus of value. Bear Power measures the ability of sellers to
// drive prices below the consensus of value. Bear Power reflects the ability
// of sellers to drive prices below the average consensus of value.
// Bull Power is calculated by subtracting the 13-day EMA from the day's High.
// Bear power subtracts the 13-day EMA from the day's Low.
// You can use in the xPrice any series: Open, High, Low, Close, HL2, HLC3, OHLC4 and ect...
// You can change long to short in the Input Settings
// Please, use it only for learning or paper trading. Do not for real trading.
////////////////////////////////////////////////////////////
strategy(title="Elder Ray (Bear Power) Strategy Backtest")
Length = input(13, minval=1)
Trigger = input(0)
reverse = input(false, title="Trade reverse")
hline(0, color=purple, linestyle=line)
xPrice = close
xMA = ema(xPrice,Length)
DayLow = iff(dayofmonth != dayofmonth[1], low, min(low, nz(DayLow[1])))
nRes = DayLow - xMA
pos = iff(nRes > Trigger, 1,
	   iff(nRes < Trigger, -1, nz(pos[1], 0)))
possig = iff(reverse and pos == 1, -1,
         iff(reverse and pos == -1, 1, pos))
if (possig == 1)
    strategy.entry("Long", strategy.long)
if (possig == -1)
    strategy.entry("Short", strategy.short)
barcolor(possig == -1 ? red: possig == 1 ? green : blue )
plot(nRes, color=blue, title="Bear Power", style = histogram)