개요
다이내믹 산타스카지노 회귀 전략 (Dynamic Santa Claus Regression Strategy) 은 가격과 기둥선 지수 사이의 다이내믹 회귀 관계에 따라 잠재적인 입점과 출구 지점을 식별하는 양적 거래 전략이다. 이 전략은 길이를 조정할 수 있는 변수 다이내믹 평균선을 사용하여 가격의 회귀 트렌드 라인을 그린다. 회귀 라인의 방향을 분석하여 입점 또는 출구를 판단한다.
전략 원칙
이 전략의 핵심은 가격과 기둥선 지수 사이의 선형 회귀 관계를 계산하는 것이다. 먼저 길이가 N인 간단한 이동 평균과 표준 차이를 계산한다. 그 다음 샘플의 관련 계수와 표준 차이의 값을 기반으로 회귀 선의 기울기 k와 절단 b를 구한다. 이렇게 하면 동적으로 조정된 선형 회귀 방정식이 나온다:
y = kx + b
x는 기둥 지수이고, y는 가격이다.
회귀선 현재 시점과 이전 시점의 크기와의 관계에 따라 트렌드 방향을 판단한다. 회귀선이 상승하고 닫기 가격이 오픈 가격과 이전 시점의 최고 가격보다 높으면 구매 신호가 발생한다. 회귀선이 하락하고 닫기 가격이 오픈 가격과 이전 시점의 최저 가격보다 낮으면 판매 신호가 발생한다.
전략적 이점
- 동적 파라미터를 설정하여 N의 값을 조정하여 다른 주기의 가격 변화에 적응할 수 있습니다.
- 회귀 관계는 시간적 요소의 영향을 고려하여 가격의 경향성을 더 잘 반영합니다.
- 여러 조건 판단을 결합하여 트레이딩 신호를 생성하여 오해의 소지가 없도록 한다.
- 가격 회귀 추세를 직관적으로 표시하고, 명확하게 읽을 수 있습니다.
위험과 해결책
- N값을 잘못 설정하여 회귀선이 너무 부드럽거나 민감하게 될 수 있습니다.
- 해결 방법: N값을 조정하여 최적의 균형을 찾습니다.
- 단기간의 가격 변동, 회귀관계 판단 실패
- 해결 방법: 다른 지표와 결합하여 출입점을 필터링합니다.
- 순환비율은 한 시점만을 고려하여 지역 극한값을 놓칠 수 있습니다.
- 해결 방법: 잘못된 판단을 피하기 위해 적절한 완화 간격을 설정하십시오.
최적화 방향
- 역동적인 탈퇴 메커니즘을 추가하여 회귀 관계에 따라 스톱포드를 조정합니다.
- 거래량과 같은 지표와 결합하여 신호 검증을 수행하여 잘못된 거래를 줄이십시오.
- 기계 학습 방법을 사용하여 더 넓은 시장 환경에 맞는 매개 변수를 자동으로 최적화합니다.
- 전략적 효과를 보다 직관적으로 보여주는 그래픽을 추가합니다.
요약하다
다이내믹 산타스카우트 회귀 전략은 가격과 시간의 다이내믹 회귀 관계를 활용하여, 유연하고, 직관적이며, 변수를 조정할 수 있는 양적 거래 시스템을 구현한다. 이 전략의 논리는 명확하고, 이해하기 쉽고, 변수를 최적화하여 서로 다른 거래 상품과 주기에 적용할 수 있다. 이 전략의 혁신은 시간 요소를 도입하여 판단을 더 경향적으로 만드는 동적 모델을 구축하는 데 있다.
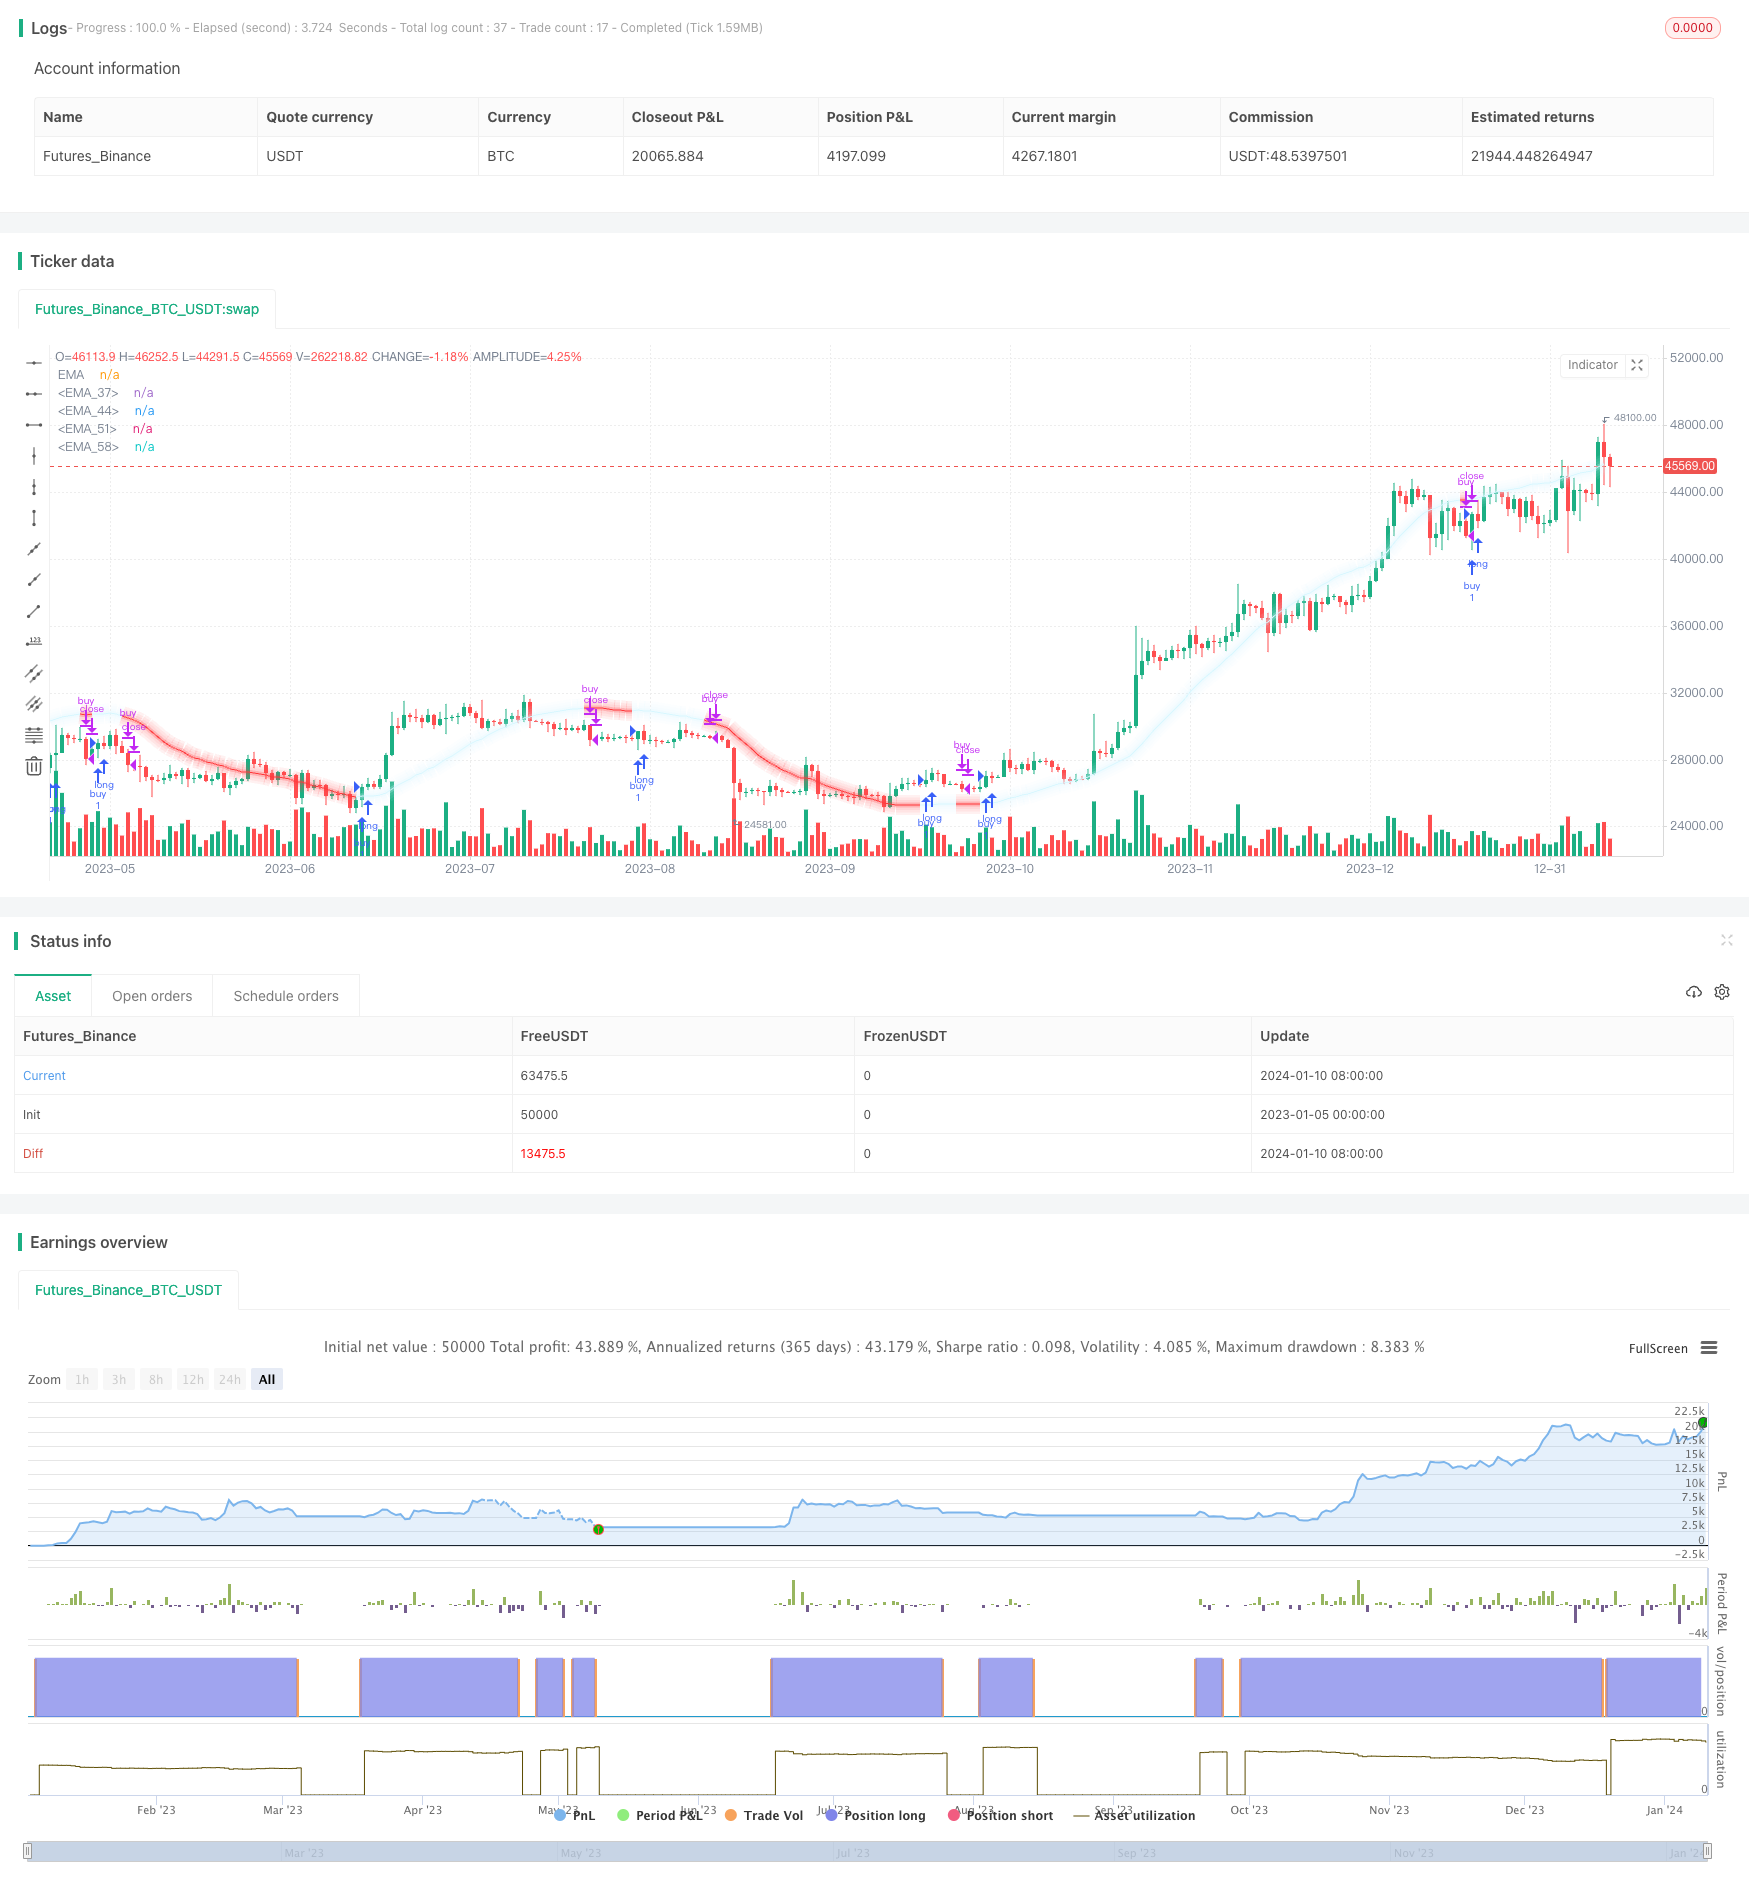
/*backtest
start: 2023-01-05 00:00:00
end: 2024-01-11 00:00:00
period: 1d
basePeriod: 1h
exchanges: [{"eid":"Futures_Binance","currency":"BTC_USDT"}]
*/

//@version=5
// Creator - TradeAI
strategy('Moving Santa Claus Strategy | TradeAI', overlay=true)

// Set the length of the moving average
length = input(64)

// Calculate the moving averages and standard deviations
x = bar_index
y = close
x_ = ta.sma(x, length)
y_ = ta.sma(y, length)
mx = ta.stdev(x, length)
my = ta.stdev(y, length)
c = ta.correlation(x, y, length)
slope = c * (my / mx)

// Calculate the parameters of the regression line
inter = y_ - slope * x_
reg = x * slope + inter

// Set the line color based on whether EMA is moving up or down
var color lineColor = na
if (reg > reg[1] and (close > open and close > high[1]))
    lineColor := color.new(#d8f7ff, 0)
if (reg < reg[1] and (close < open and close < low[1]))
    lineColor := color.new(#ff383b, 0)

// Plot the EMA line with different thicknesses
plot(reg, color=lineColor, title="EMA")

var color lineColorrr = na
if (reg > reg[1] and (close > open and close > high[1]))
    lineColorrr := color.new(#d8f7ff, 77)
if (reg < reg[1] and (close < open and close < low[1]))
    lineColorrr := color.new(#ff383b, 77)
plot(reg, color=lineColorrr, title="EMA", linewidth=5)

var color lineColorr = na
if (reg > reg[1] and (close > open and close > high[1]))
    lineColorr := color.new(#d8f7ff, 93)
if (reg < reg[1] and (close < open and close < low[1]))
    lineColorr := color.new(#ff383b, 93)
plot(reg, color=lineColorr, title="EMA", linewidth=10)

var color lineColorrrr = na
if (reg > reg[1] and (close > open and close > high[1]))
    lineColorrrr := color.new(#d8f7ff, 97)
if (reg < reg[1] and (close < open and close < low[1]))
    lineColorrrr := color.new(#ff383b, 97)
plot(reg, color=lineColorr, title="EMA", linewidth=15)

var color lineColorrrrr = na
if (reg > reg[1] and (close > open and close > high[1]))
    lineColorrrrr := color.new(#d8f7ff, 99)
if (reg < reg[1] and (close < open and close < low[1]))
    lineColorrrrr := color.new(#ff383b, 99)
plot(reg, color=lineColorr, title="EMA", linewidth=20)

// Implement trading strategy based on EMA direction
if reg > reg[1] and (close > open and close > high[1])
    strategy.entry('buy', strategy.long)

if reg < reg[1] and (close < open and close < low[1])
    strategy.close('buy')