개요
이 전략은 MACD 지표의 RSI 값에 따라 구매 및 판매 신호를 판단합니다. RSI 값이 오버 바이 라인 또는 오버 소드 범위를 초과 할 때 구매, RSI 값이 오버 소드 범위를 넘어갈 때 중지 또는 중지하십시오.
전략 원칙
이 전략은 MACD 지표와 RSI 지표의 장점을 결합한다.
먼저 DIF 라인, DEA 라인, MACD 라인 등 MACD 지표의 세 개의 곡선을 계산한다. MACD 라인에서 RSI 지표를 계산한 다음 MACD의 RSI를 형성한다.
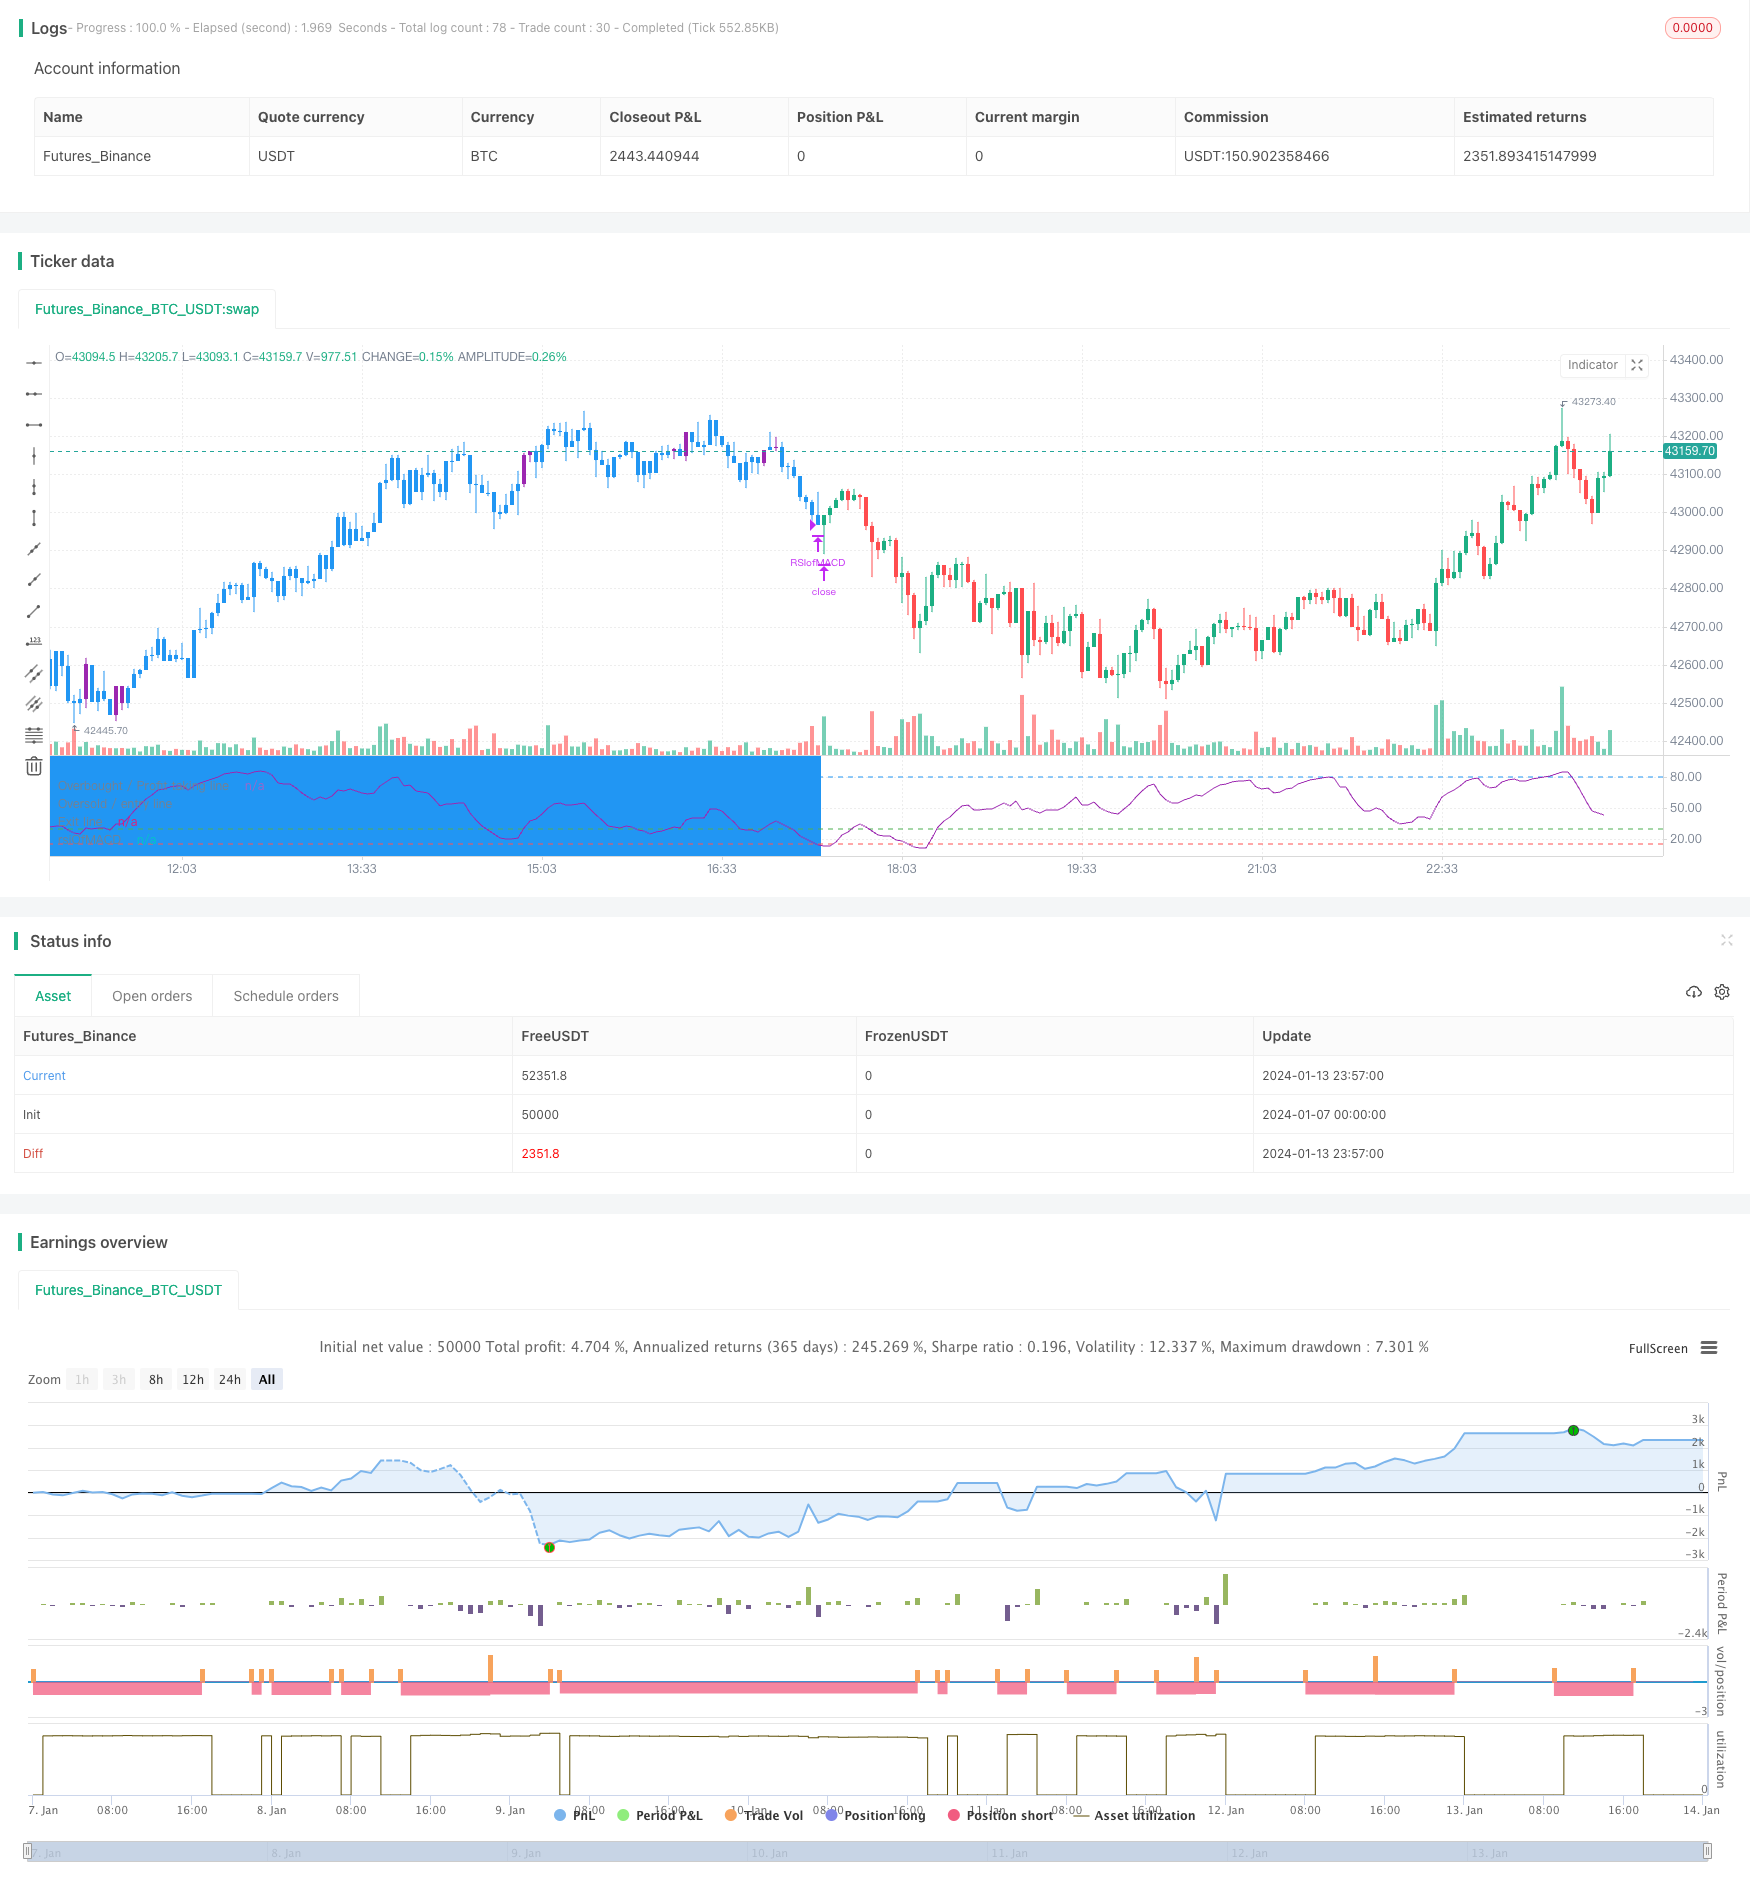
RSI of MACD 지표가 30 또는 35을 초과하면 구매 신호가 발생하여 MACD 라인이 초과 영역에 들어갔을 때 주가 추세가 상승하기 시작합니다. RSI of MACD 지표가 15을 초과 영역으로 다시 떨어지면 판매 신호가 발생하여 추세 반전이 끝났습니다.
이 전략은 또한 부분적인 정지를 설정하고, RSI of MACD 지표가 80을 초과할 때 부분적인 입장을 팔아 부분적인 이익을 잠금할 수 있다.
우위 분석
- MACD 지표로 트렌드 전환점을 판단합니다.
- RSI 지표를 사용하여 오버 바이 오버 세일 영역을 필터링합니다.
- 이 두가지 지표로 거래점을 정확히 파악할 수 있습니다.
- 손실 확산을 방지하기 위해 부분 차단
위험 분석
- MACD 지표 파라미터가 잘못 설정되어 있어 트렌드를 정확하게 판단할 수 없습니다.
- RSI 지표의 매개 변수가 잘못 설정되어 오버 바이 오버 소드를 정확하게 판단할 수 없습니다.
- 일부 정지 설정이 너무 급진적이어서 더 큰 상승을 놓칠 수 있습니다.
해결책:
- MACD 변수를 최적화하여 최적의 조합을 찾습니다.
- RSI 파라미터를 최적화하여 정확도를 높여줍니다.
- 더 큰 수익을 추구하기 위한 부분적 휴식 조건의 적절한 완화
최적화 방향
이 전략은 다음과 같은 방향으로 최적화될 수 있습니다.
- 손실을 막는 전략을 강화하고 하락 위험을 더욱 통제합니다.
- 포지션 관리 모듈을 추가하여 포지션이 가격에 따라 점차적으로 커집니다.
- 통합 기계 학습 모델, 역사 데이터 훈련을 활용하여 구매 및 판매 지점 판단의 정확성을 더욱 향상시킵니다.
- 15분 또는 5분 정도의 짧은 주기로 실행하여 전략의 빈도를 더 높여보세요.
요약하다
이 전략의 전체적인 설계 아이디어는 명확하며, 핵심 아이디어는 MACD 역전과 RSI 필터링을 결합하여 매매 지점을 판단하는 것이다. 매개 변수 최적화, 손해 관리, 위험 제어 등의 수단을 통해 매우 실용적인 정량 거래 전략으로 만들 수 있다.
전략 소스 코드
/*backtest
start: 2024-01-07 00:00:00
end: 2024-01-14 00:00:00
period: 3m
basePeriod: 1m
exchanges: [{"eid":"Futures_Binance","currency":"BTC_USDT"}]
*/

// This source code is subject to the terms of the Mozilla Public License 2.0 at https://mozilla.org/MPL/2.0/
// © mohanee

//@version=4

strategy(title="RSI of MACD Strategy[Long only]",  shorttitle="RSIofMACD" , overlay=false, pyramiding=1,     default_qty_type=strategy.percent_of_equity,  default_qty_value=20, initial_capital=10000, currency=currency.USD)  //default_qty_value=10, default_qty_type=strategy.fixed,


/////////////////////////////////////////////////////////////////////////////////


// MACD Inputs ///
fastLen = input(12, title="Fast Length")
slowLen = input(21, title="Slow Length")
sigLen  = input(9, title="Signal Length")

rsiLength  = input(14, title="RSI of MACD Length")


riskCapital = input(title="Risk % of capital", defval=10, minval=1)
stopLoss=input(3,title="Stop Loss",minval=1)

takeProfit=input(false, title="Take Profit")


[macdLine, signalLine, _] = macd(close, fastLen, slowLen, sigLen)

rsiOfMACD = rsi(macdLine, rsiLength)
emaSlow = ema(close, slowLen)


//drawings
/////////////////////////////////////////////////////////////////////////////////


obLevelPlot = hline(80, title="Overbought / Profit taking line",  color=color.blue , linestyle=hline.style_dashed)
osLevelPlot = hline(30, title="Oversold / entry line", color=color.green, linestyle=hline.style_dashed)

exitLinePlot = hline(15, title="Exit line", color=color.red, linestyle=hline.style_dashed)


plot(rsiOfMACD, title = "rsiOfMACD" ,  color=color.purple)


//drawings
/////////////////////////////////////////////////////////////////////////////////


//Strategy Logic
/////////////////////////////////////////////////////////////////////////////////

//Entry--
//Echeck how many units can be purchased based on risk manage ment and stop loss
qty1 = (strategy.equity  * riskCapital / 100 ) /  (close*stopLoss/100)

//check if cash is sufficient  to buy qty1  , if capital not available use the available capital only
qty1:= (qty1 * close >= strategy.equity ) ? (strategy.equity / close) : qty1


strategy.entry(id="RSIofMACD", long=true,   qty=qty1,  when =  ( crossover(rsiOfMACD, 30) or crossover(rsiOfMACD, 35)  ) and close>=emaSlow )


bgcolor(abs(strategy.position_size)>=1 ? color.blue : na , transp=70)


barcolor(abs(strategy.position_size)>=1 and  ( crossover(rsiOfMACD, 30) or crossover(rsiOfMACD, 35) ) ? color.purple : abs(strategy.position_size)>=1 ? color.blue : na  )


//partial exit
strategy.close(id="RSIofMACD", comment="PExit Profit is "+tostring(close - strategy.position_avg_price,  "###.##")  ,  qty=strategy.position_size/3, when= takeProfit and abs(strategy.position_size)>=1 and close > strategy.position_avg_price and crossunder(rsiOfMACD,80) )

//Close All
strategy.close(id="RSIofMACD", comment="Close All   Profit is "+tostring(close - strategy.position_avg_price,  "###.##"), when=abs(strategy.position_size)>=1 and crossunder(rsiOfMACD,15) ) //and close > strategy.position_avg_price )


//Strategy Logic
/////////////////////////////////////////////////////////////////////////////////