전략 개요
이 전략은 가격 변동성이 큰, 트렌드가 보이지 않는 주식, 지수 및 대상품에 적용된다. 전략은 가격 트렌드를 식별하기 위해 알론 진동 지수를 사용하며, 여러 파라미터를 결합하여 입출 조건을 설정하여 이러한 위험한 자산에 대한 자동 거래를 구현한다.
전략 원칙
이 전략은 알론 선의 창시자 투샤르 찬데의 생각에서 비롯되었다. 찬데는 알론 진동기가 50보다 높거나 낮을 때, 다중 헤드 및 공백 트렌드를 식별할 수 있다고 보았다. 이것은 단순한 알론 선과 알론 교차가 비 트렌드 시장에서 부족한 부분을 보완하는 데 도움이 된다.
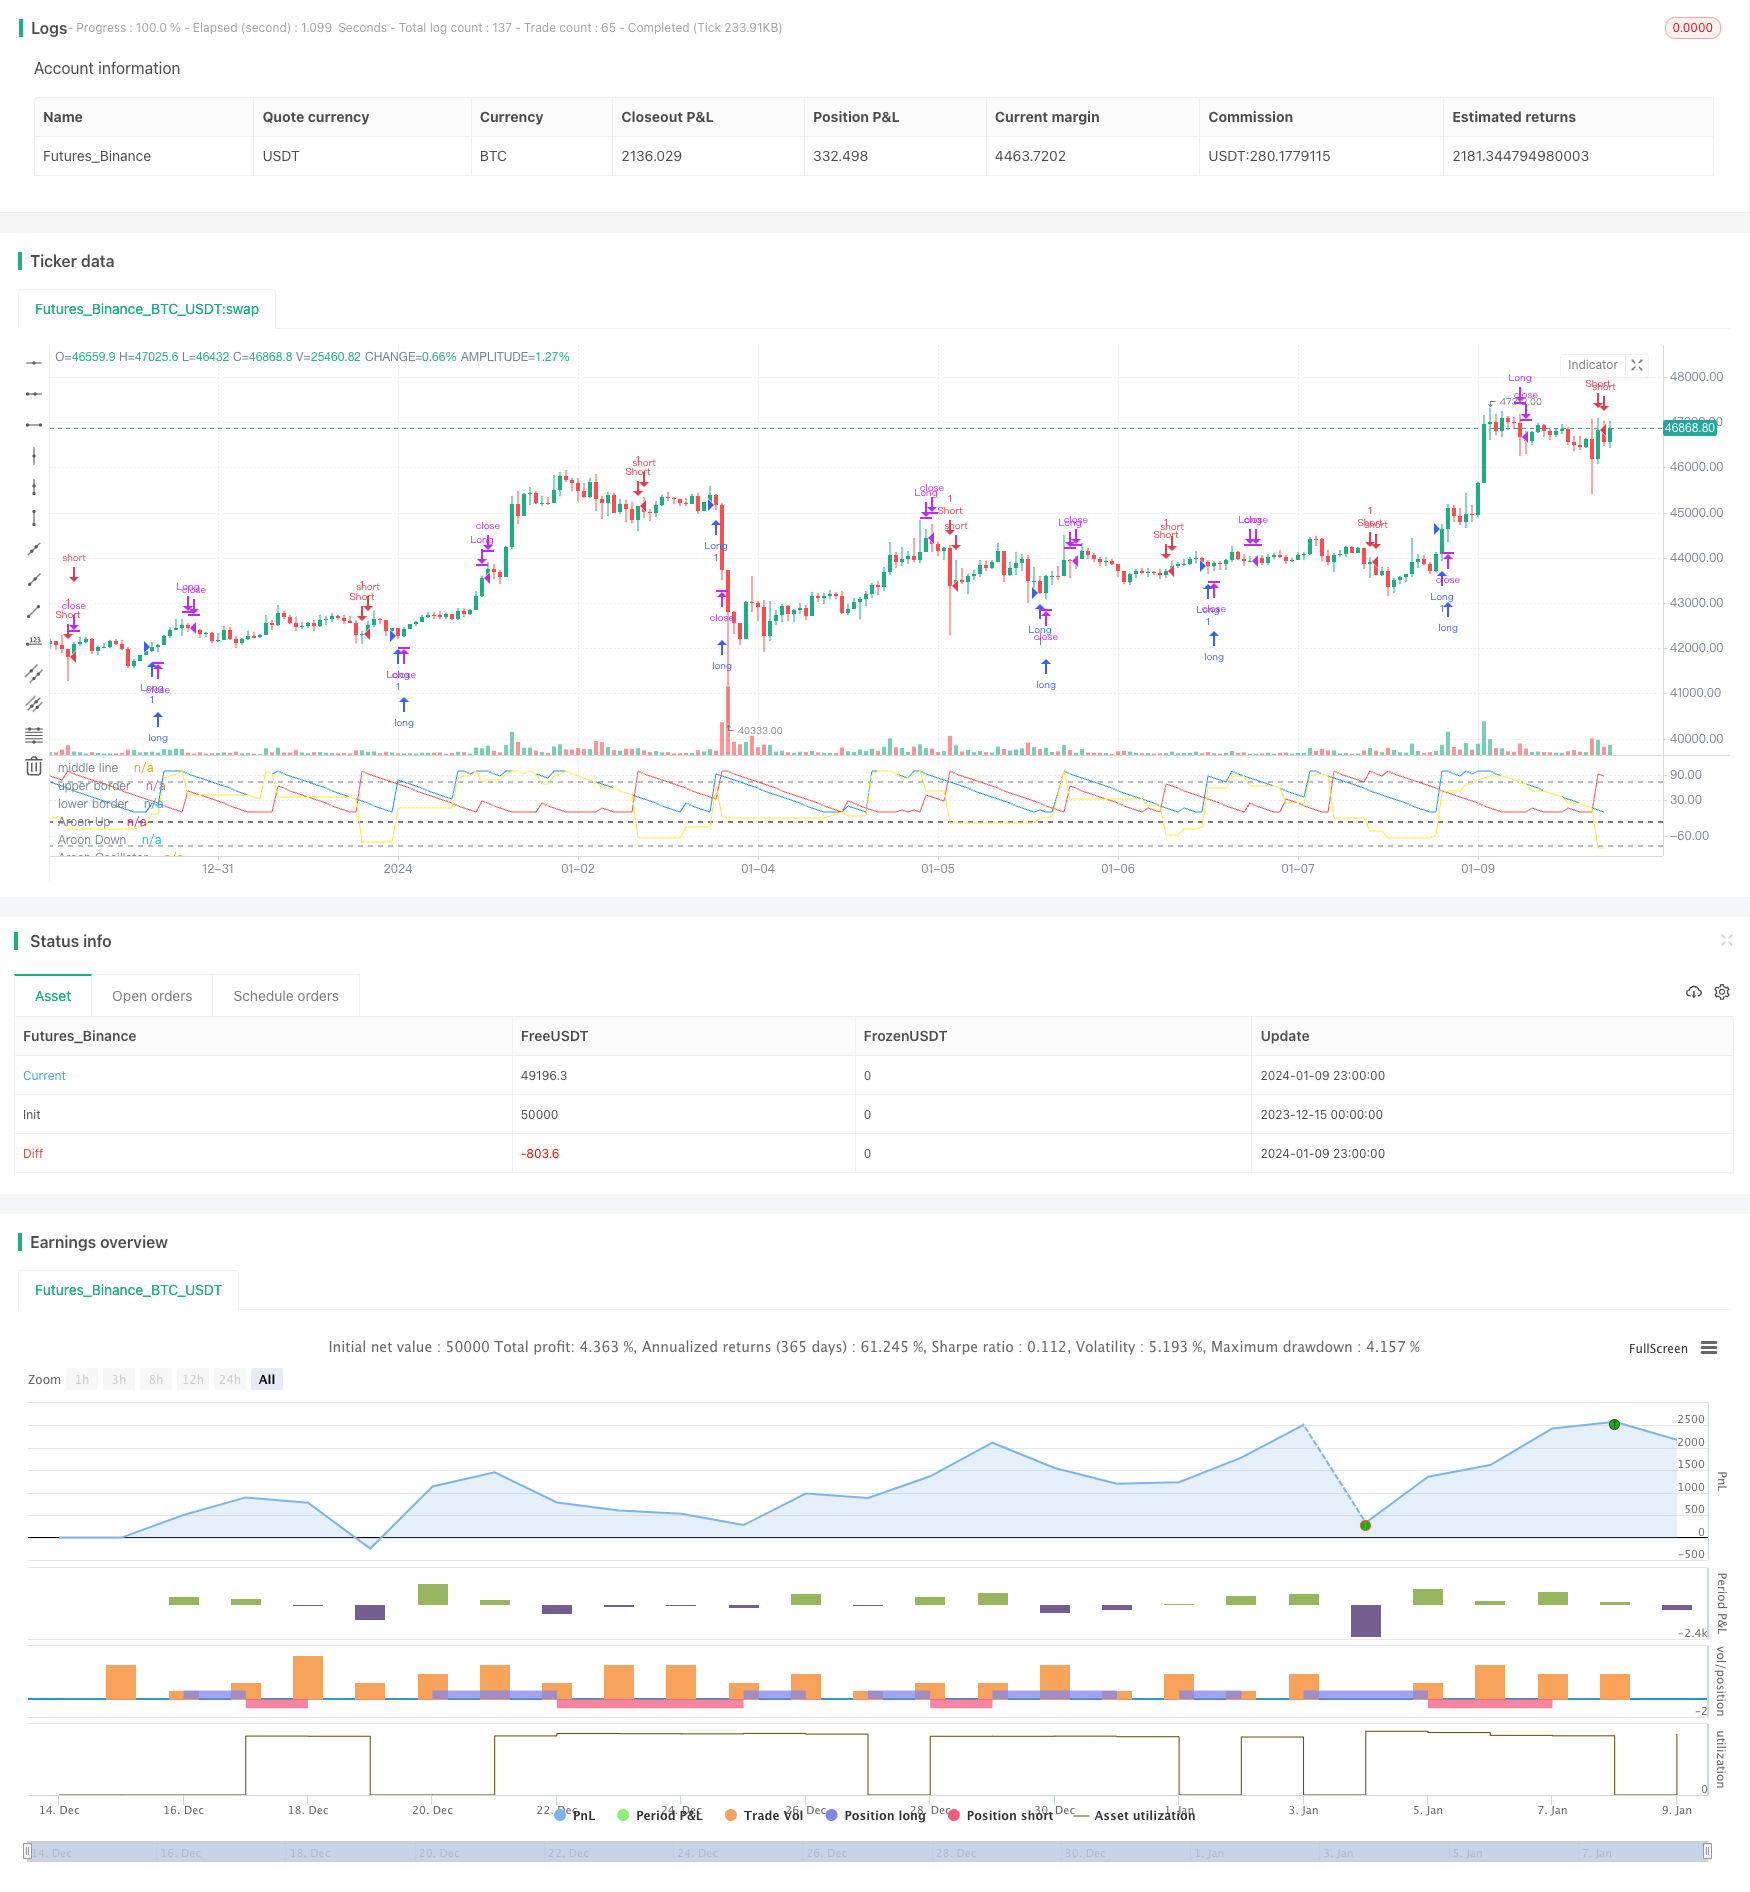
구체적으로, 전략은 먼저 19주기 길이의 알론 상선, 알론 하선 및 알론 진동기를 계산한다. 진동기는 상선 하선으로 계산된다. 그리고 중간선을 25로 설정한다.
이렇게, 중앙선은 트렌드 방향을 판단하기 위해 경기장 안으로 들어갔고, 상하철은 트렌드 반향을 위해 경기장 밖으로 나갔고, 알롱 진동기 지표에 기반한 자동 거래가 실현되었다.
전략적 이점
전통적인 트렌드 추적 전략에 비해 이 전략은 다음과 같은 장점이 있습니다.
- 단순한 트렌드 전략보다 더 나은 효과가 있는 변동성이 크고 추세가 보이지 않는 품종에 적합합니다.
- 아론 진동기를 이용하면 트렌드를 더 확실하게 판단할 수 있다.
- 다중 변수 설정 조건은 엄격하고, 잘못된 거래를 피합니다.
- 빠른 수익, 효율적인 손실 통제
전반적으로, 이 전략은 알론 진동기 지표의 장점을 결합하여 특정 품종에 대한 자동 거래, 승률 및 수익성을 달성했습니다.
전략적 위험
이 전략에는 몇 가지 위험도 있습니다.
- 매개 변수 설정은 다른 품종에 따라 최적화를 조정해야 합니다. 그렇지 않으면 효과에 영향을 미칠 수 있습니다.
- 거래 빈도가 높을 수 있으며 거래 비용과 슬라이드 포인트 비용을 증가시킬 수 있습니다.
- 기술 지표에 의존하여 지표가 작동하지 않으면 손실이 발생할 수 있습니다.
이러한 위험점은 변수 조정, 코드 최적화로 개선 및 감소시킬 수 있다. 또한, 합리적인 위치 및 재원 관리도 잠재적인 위험을 효과적으로 제어할 수 있다.
전략 최적화
전략의 효과를 더욱 높이기 위해 다음과 같은 부분에서 최적화할 수 있습니다.
- 다른 품종과 시장 환경에 대한 테스트를 위해 매개 변수를 조정합니다.
- 다른 기술 지표의 조합을 추가하여 더 강력한 거래 신호를 형성합니다.
- 단독 손실 규모를 효과적으로 통제하기 위한 손실 차단 전략을 강화
- 가상 돌파구가 잘못된 거래로 이어지지 않도록 결합된 양력 지표
- 입시 조건을 최적화하고 불필요한 거래 수를 줄입니다.
다방면 테스트와 최적화를 통해 전략의 안정성, 성공률 및 수익성을 크게 향상시킬 수 있습니다.
요약하다
이 전략은 알론 진동기 지표에 기초하여 창의적으로 변동성이 큰, 추세가 보이지 않는 품종에 대한 자동화 거래를 구현한다. 전통적인 추세 전략에 비해 이러한 품종에 대한 효과는 더 좋으며, 매개 변수를 설정하여 엄격한 거래 조건도 실현한다. 전략의 장점은 뚜렷하지만, 또한 개선할 여지가 있다. 타겟팅 최적화를 통해 효과는 더욱 향상될 수 있다. 이 전략은 양적 거래 관행에 대한 참고적인 아이디어를 제공할 수 있다.
/*backtest
start: 2023-12-15 00:00:00
end: 2024-01-10 00:00:00
period: 1h
basePeriod: 15m
exchanges: [{"eid":"Futures_Binance","currency":"BTC_USDT"}]
*/

//@version=2
// by Saucius Finance https://saucius-finance.blogspot.com/
// copyrights reserved :)
// This strategy derives form the consideration of the author, Tushar Chande, that, in "more patterns" paragraph,
// long and short trends are identified by oscillator < or > line 50.
// This helps because simple Aroon and Aroon crosses suffer in not trending periods.
// original article avabile in:" Stocks & Commodities, V. 13:9 (369-374) : A Time Price Oscillator by Tushar Chande, Ph.D.""
strategy("Aroon Oscillator strategy by Saucius", overlay=false)
//building aroon lines, Embodying both Aroon line (Up and Down) and Aroon Oscillator
length = input(19, minval=1)
level_middle = input(-25, minval=-90, maxval=90, step = 5)
levelhigh = input(75,  minval=-100, maxval=100, step = 5)
levellow = input(-85,  minval=-100, maxval=100, step = 5)
upper = 100 * (highestbars(high, length+1) + length)/length
lower = 100 * (lowestbars(low, length+1) + length)/length
oscillator = upper - lower
plot(upper, title="Aroon Up", color=blue)
plot(lower, title="Aroon Down", color=red)
plot(oscillator, title="Aroon Oscillator", color = yellow)
hline(level_middle, title="middle line", color=gray,  linewidth=2)
hline(levelhigh, title ="upper border", color=gray,  linewidth=1)
hline(levellow, title ="lower border", color=gray, linewidth=1)

// Entry //
entryl = oscillator[1] < level_middle[1] and oscillator > level_middle
entrys = oscillator[1] > level_middle[1] and oscillator < level_middle
strategy.entry("Long", true, when = entryl)
strategy.entry("Short", false, when = crossunder (oscillator, level_middle))


// === EXIT===
exitL1 = oscillator[1] > levelhigh[1] and oscillator < levelhigh
exitS1 =  oscillator[1] < levellow[1] and oscillator > levellow
strategy.close("Long", when=entrys)
strategy.close("Short", when=entryl)
strategy.close("Long", when= exitL1)
strategy.close("Short", when= exitS1)