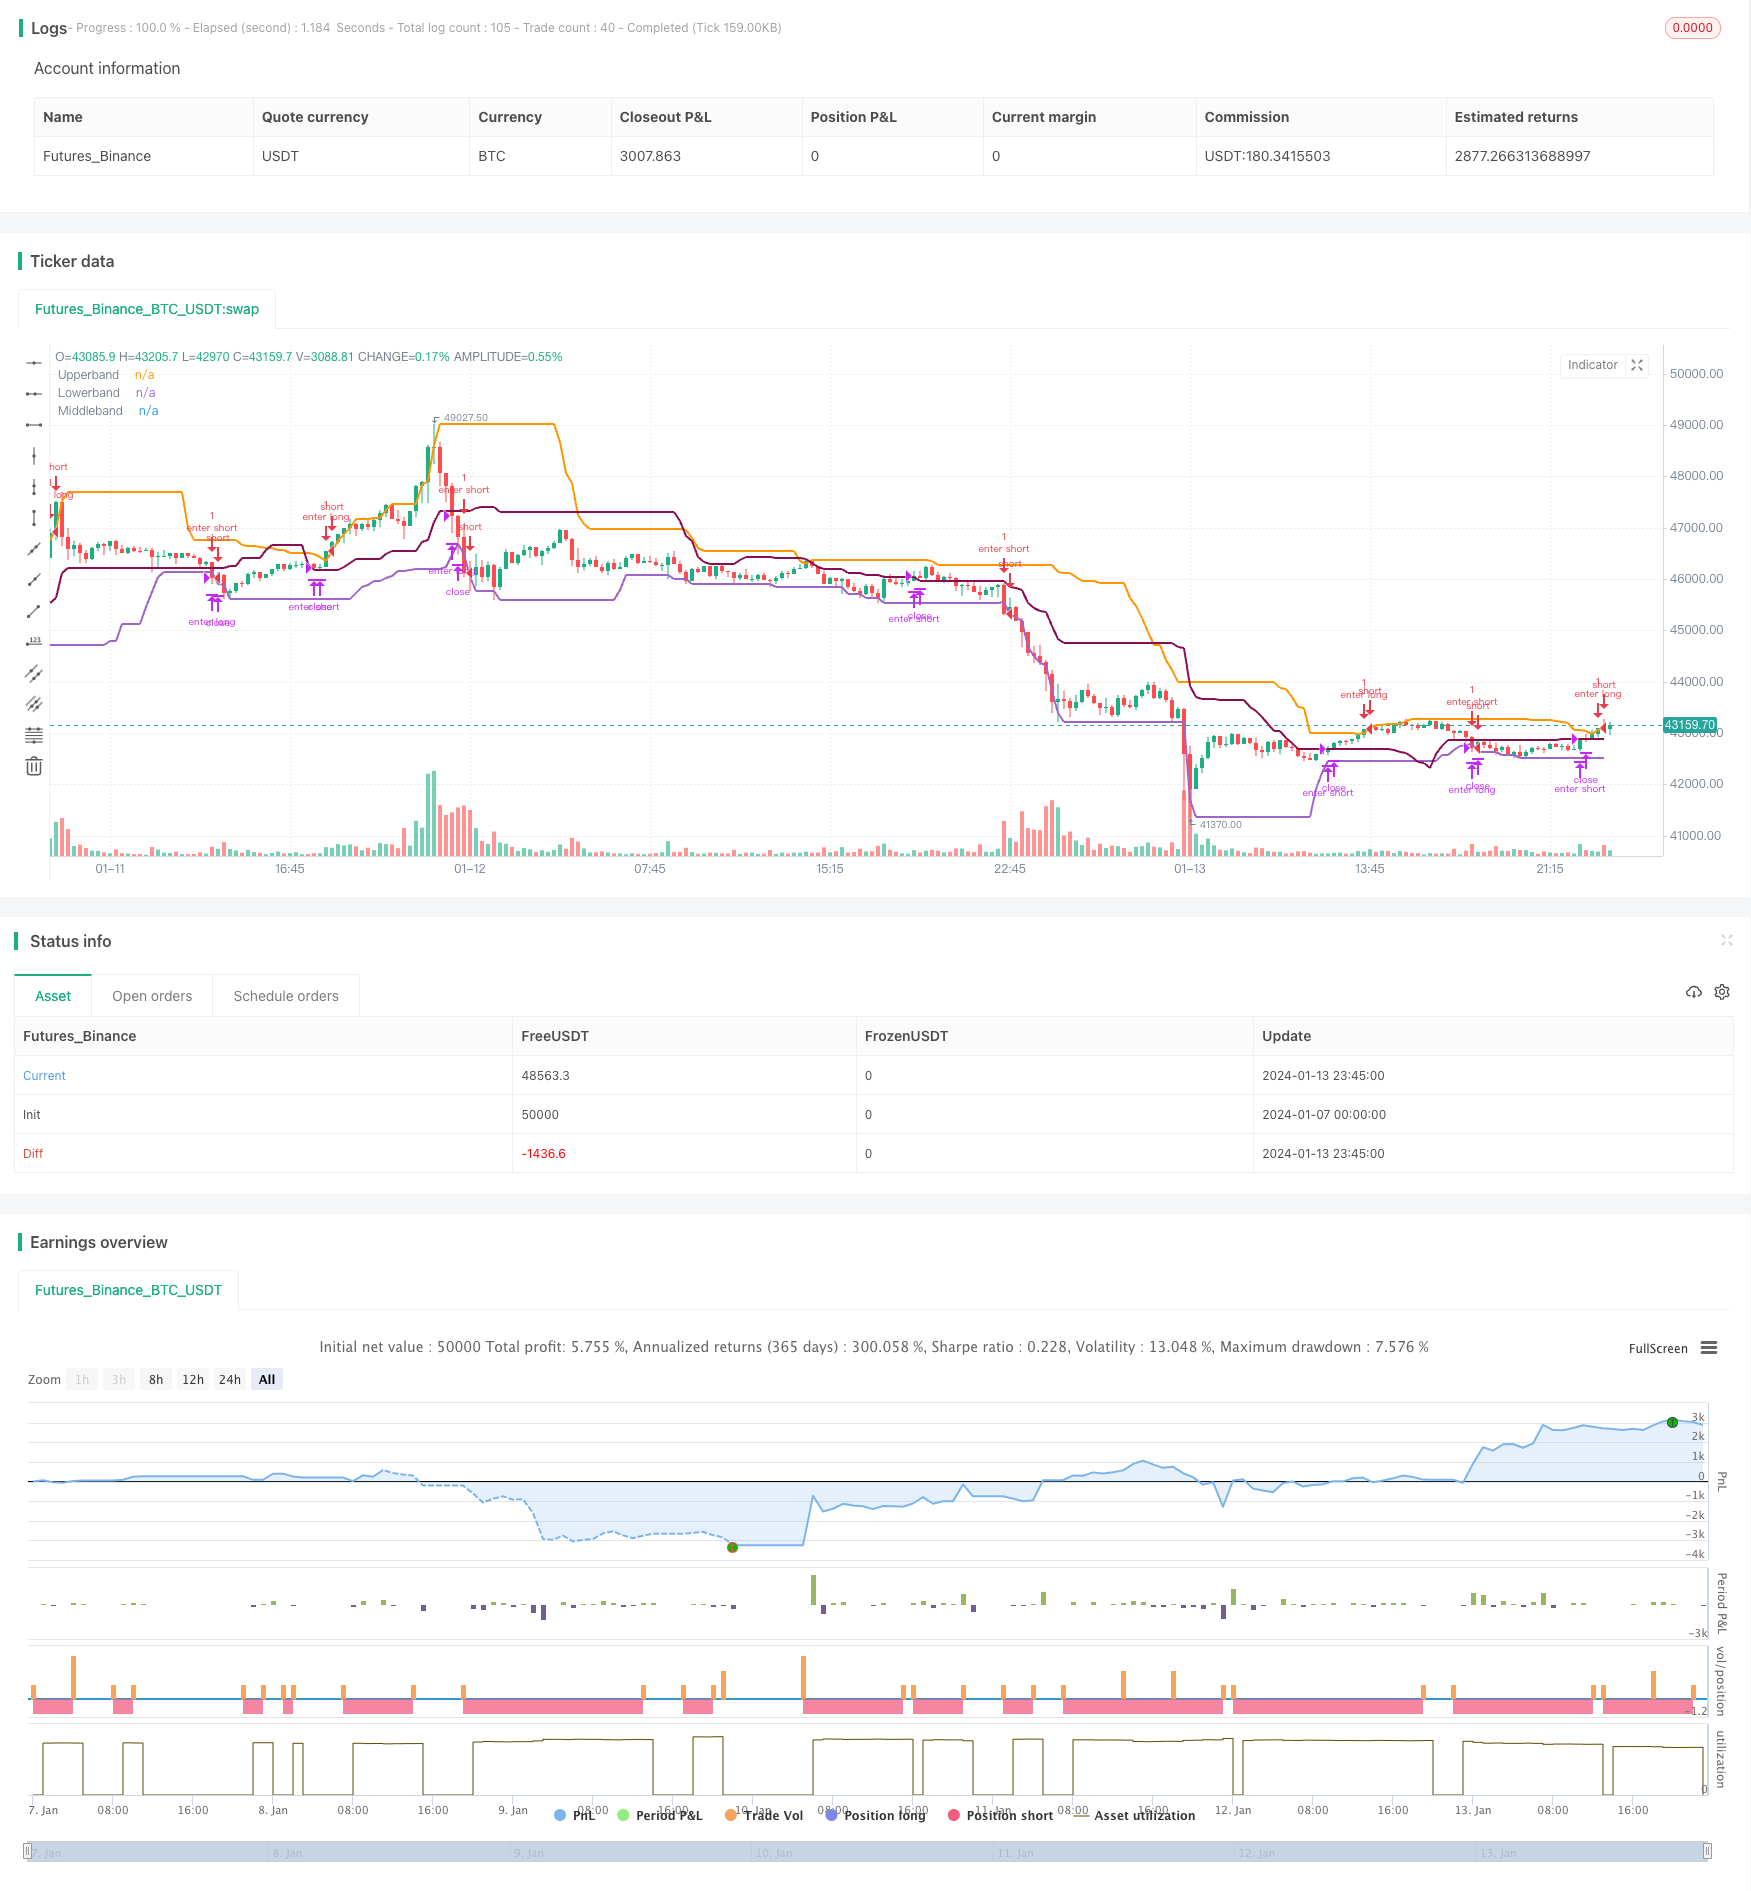
개요
이 전략은 돈치안 통로의 장기적인 트렌드 추적 전략에 기초한다. 돈치안 통로의 상단 및 하단 궤도를 사용하여 가격 돌파구를 찾고 돌파구가 발생했을 때 시장에 진입한다. 동시에 통로의 중간 궤도를 손실 경로로 사용하여 시장에서 빠져 나간다. 이 전략은 명백한 트렌드가있는 시장에 적용되며, 장기적인 트렌드를 포착하여 높은 수익을 얻을 수 있다.
전략 원칙
이 전략은 20주기 길이의 唐通道을 사용한다. 通道의 상반도는 최근 20주기 동안의 최고 가격이고, 하반도는 최근 20주기 동안의 최저 가격이다. 중반도의 기본 길이는 상반도의 2배이며, 상반도와 상반도의 동일한 길이로도 설정할 수 있다. 가격이 상반도를 돌파할 때, 더; 가격이 하반도를 돌파할 때, 더; 가격이 중반도를 돌파할 때, 더; 가격이 중반도를 돌파할 때, 더; 가격이 중반도를 돌파할 때, 더.
더 긴 중간 궤도 길이를 사용하면 수익성있는 포지션에 더 많은 실행 공간을 제공하여 시장의 추세에 따라 더 높은 수익을 얻을 수 있습니다. 사실, 길이가 위쪽 아래쪽 궤도보다 두 배의 중간 궤도는 Wilder의 3 배의 ATR 이동 중지에 매우 가깝습니다. 그래서이 더 긴 중간 궤도는 추세를 추적하는 전략의 대안적인 중지 방법으로 사용할 수 있습니다.
전략적 강점 분석
이 전략은 다음과 같은 장점을 가지고 있습니다.
- 전략적 아이디어는 간단하고 이해하기 쉽고 실행할 수 있습니다.
- 동천 통로는 고전적인 트렌드 추적 지표이며, 신뢰성이 높습니다.
- 통로 중간 궤도를 이용해서 이동 상실을 통해 위험을 효과적으로 통제할 수 있다.
- 시장이 유행하는 곳에서는 높은 수익을 얻을 수 있습니다.
- 중철은 수익을 극대화할 수 있는 대안적인 이동식 상쇄수단이다.
위험 분석
이 전략에는 몇 가지 위험도 있습니다.
- 트렌드 추적 전략으로서, 그것은 명백한 트렌드 행태에 의존하며, 시장의 종합에 갇히기 쉽다.
- 중도 정지 손실은 때때로 너무 느려져 손실이 커집니다.
- 트렌드 전환점을 정확하게 판단할 수 없고, 트렌드가 역전되면 큰 손실을 입을 수 있다.
중간 궤도 길이를 적절히 줄이거나 다른 스톱 손실 지표와 함께 위험을 줄일 수 있습니다. 또한 불필요한 거래를 줄이기 위해 입문 논리를 최적화 할 수 있습니다.
최적화 방향
이 전략은 다음과 같은 부분에서 최적화될 수 있습니다.
- 동천 통로의 매개 변수를 최적화하여 더 많은 시장에 적용할 수 있도록 한다.
- 다른 지표와 함께 추세를 판단하여 entrada의 정확도를 높여줍니다.
- 중간 궤도의 손해 방지 논리를 최적화하여 보다 안정적이고 신뢰할 수 있게 한다.
- 필터링 조건을 늘리고, 불필요한 거래를 줄이고, 거래의 빈도를 낮추는 것입니다.
요약하다
이 전략은 전체적으로 매우 간단한 장기적인 트렌드 추적 전략이다. 트렌드 방향을 판단하기 위해 唐通道 지표를 사용하며, 중간에 이동하는 스톱로스를 실행한다. 트렌드가 뚜렷한 시장에서 더 높은 수익을 얻을 수 있다. 그러나 이 전략에는 약간의 위험이 있으며, 더 안정적인 효과를 얻기 위해 파라미터와 스톱 로직을 최적화해야 한다.
/*backtest
start: 2024-01-07 00:00:00
end: 2024-01-14 00:00:00
period: 15m
basePeriod: 5m
exchanges: [{"eid":"Futures_Binance","currency":"BTC_USDT"}]
*/

//@version=4
// This source code is subject to the terms of the Mozilla Public License 2.0 at https://mozilla.org/MPL/2.0/

// Donchian Channels Strategy - Long Term Trend
// by SparkyFlary

//For Educational Purposes
//Results can differ on different markets and can fail at any time. Profit is not guaranteed.
strategy("Donchian Channels Strategy - Long Term Trend", shorttitle="Donchian Channels LT Strategy", overlay=true)

length = input(20, title="Donchian Channel length")
option = input("double", title="Middleband length: regular or double", options=["regular","double"])

upperband = highest(high, length)[1]
lowerband = lowest(low, length)[1]
middlebandLength = option=="double"?length*2:length
middleband = avg(highest(high, middlebandLength)[1], lowest(low, middlebandLength)[1])

//Plots
ubP = plot(upperband, title="Upperband", style=plot.style_line, linewidth=2)
lbP = plot(lowerband, title="Lowerband", style=plot.style_line, linewidth=2)
mbP = plot(middleband, title="Middleband", style=plot.style_line, color=color.maroon, linewidth=2)

//Strategy
buy = close > upperband
sell = close < middleband
short = close < lowerband
cover = close > middleband

strategy.entry(id="enter long", long=true, when=buy)
strategy.close(id="enter long", comment="exit long", when=sell)
strategy.entry(id="enter short", long=false, when=short)
strategy.close(id="enter short", comment="exit short", when=cover)