개요
ADX 동적 평균 트렌드 지표 전략은 ADX 지표를 사용하여 시장의 경향 강도와 트렌드 방향을 판단하는 양적 거래 전략이다. 이 전략은 평균 방향 지표 ((ADX) 를 계산하여 시장의 경향이 있는지 판단하고, 긍정적 인 지표 ((DI+) 와 부정적인 지표 ((DI-) 를 계산하여 트렌드 방향을 판단하여 구매 및 판매 신호를 생성한다.
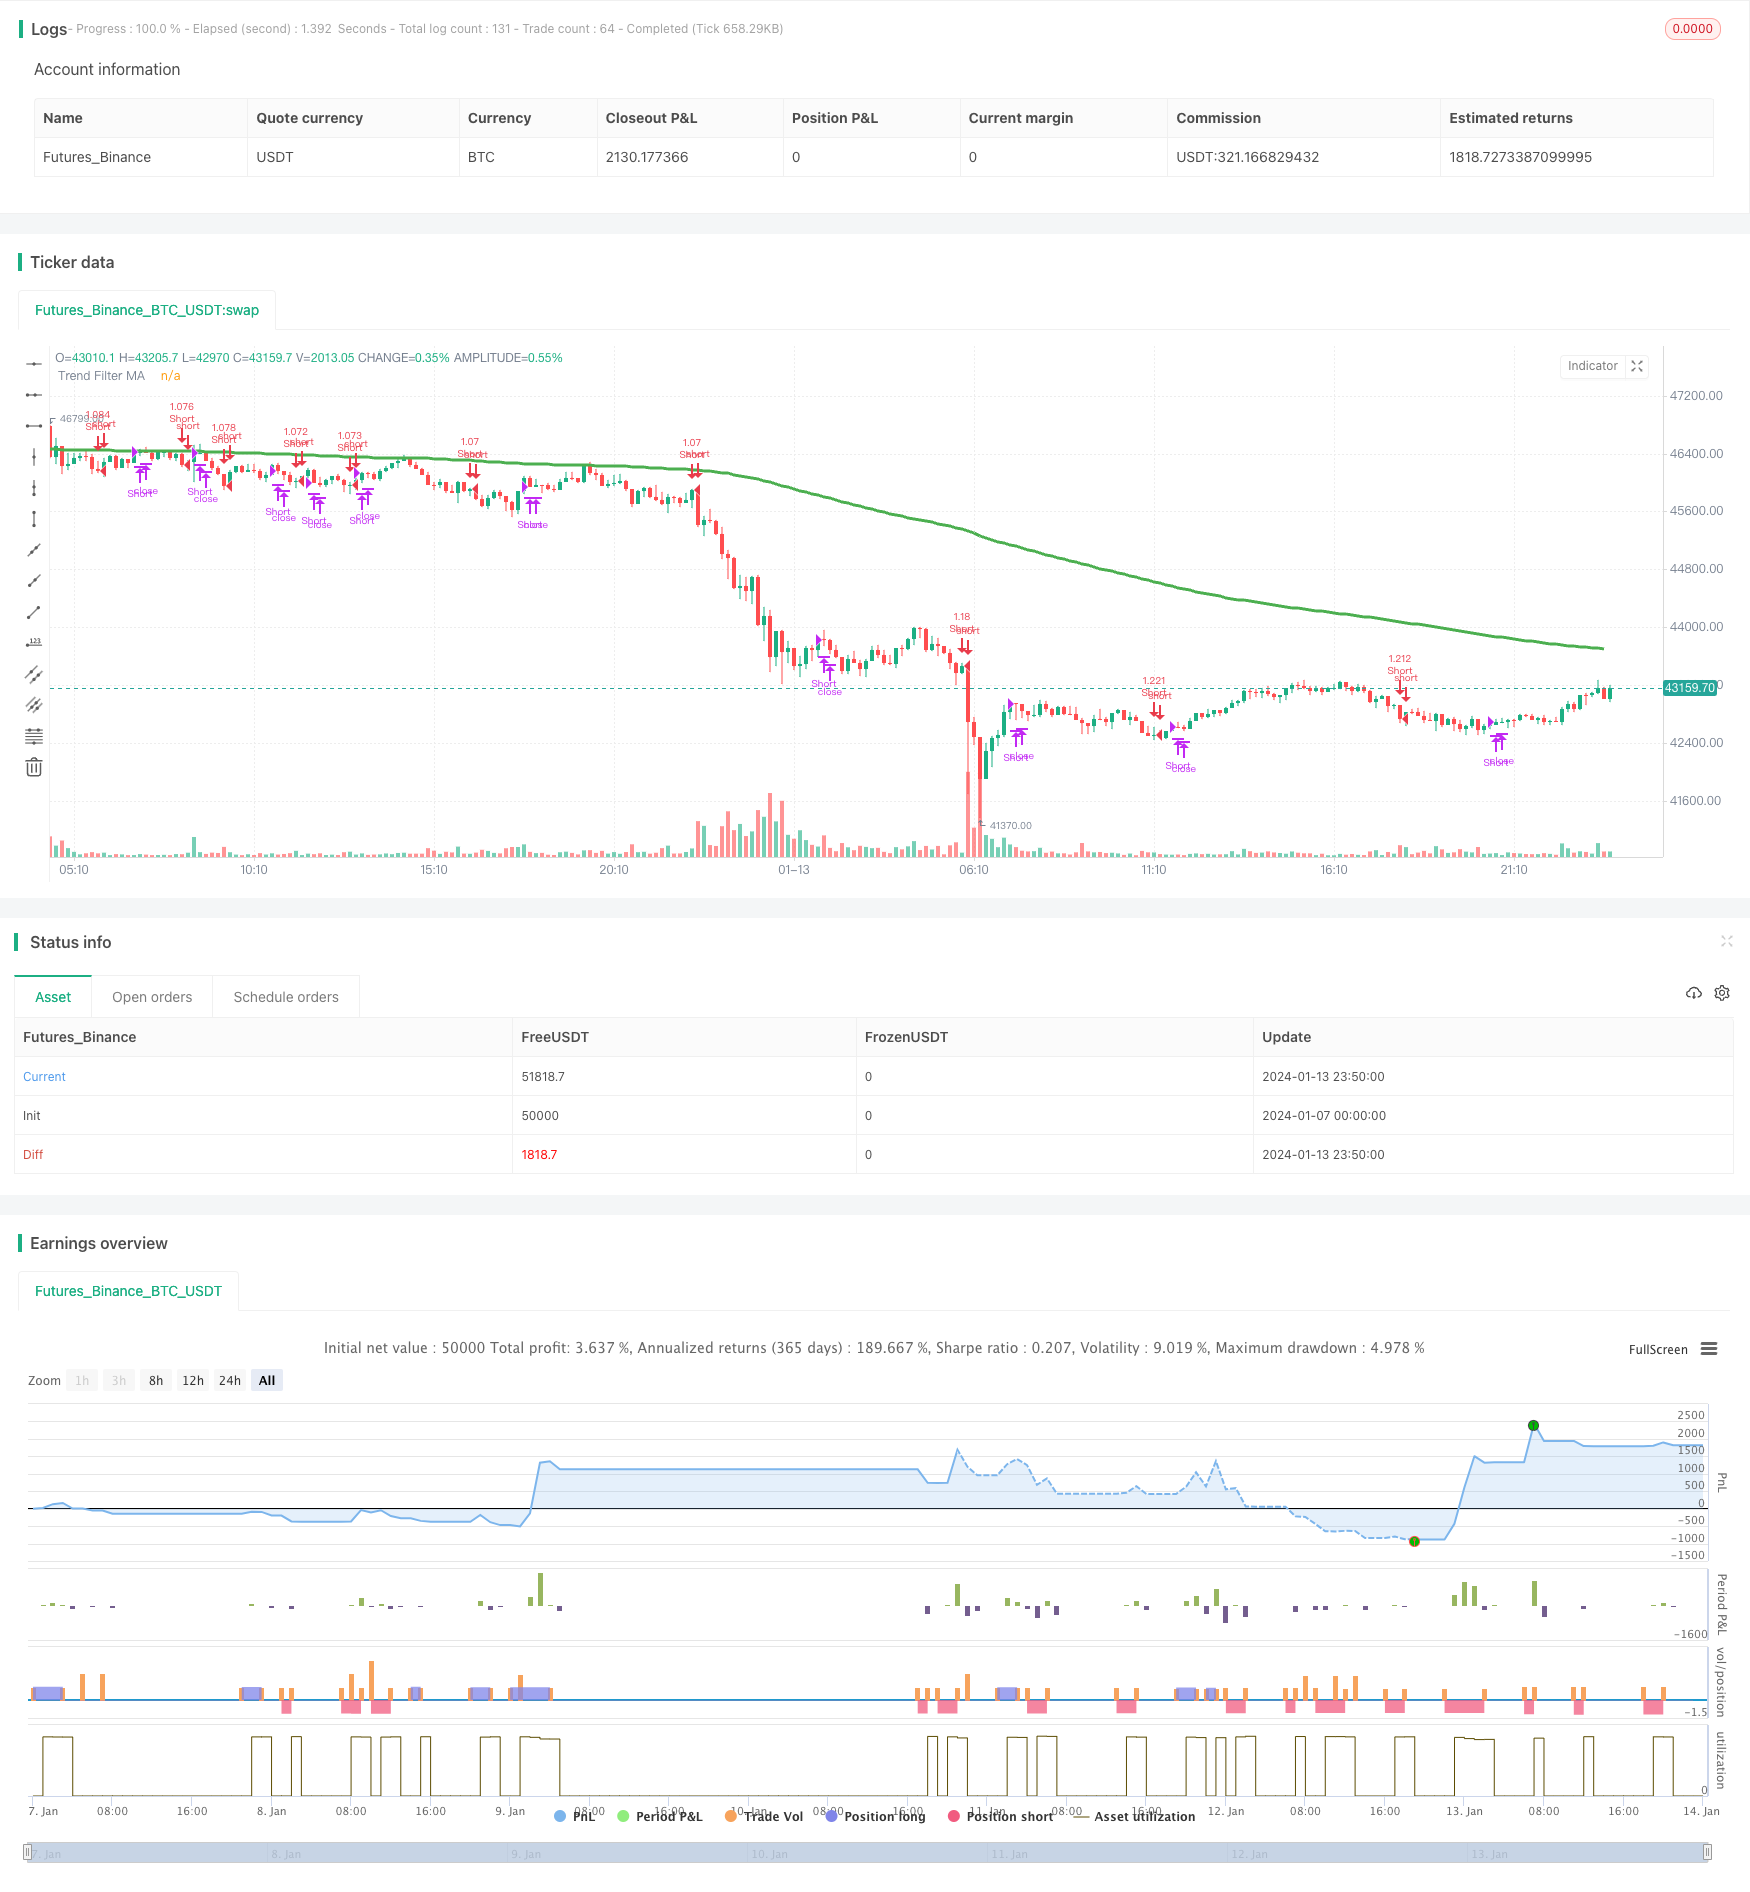
전략 원칙
이 전략은 먼저 ADX 지표를 사용하여 시장의 경향을 판단한다. ADX가 사용자가 설정한 핵심값보다 높을 때 (기본 23), 시장의 추세가 강하다는 것을 나타냅니다. ADX의 현재 값이 ADX 이전 n 일의 값보다 높을 때 (기본 3 일) ADX가 상승하고 있으며 시장의 추세가 형성되고 있음을 나타냅니다.
다음 전략은 DI+와 DI-를 사용하여 시장 추세의 방향을 판단한다. DI+가 DI-보다 높으면 시장이 상승 추세에 있음을 나타냅니다. DI+가 DI-보다 낮으면 시장이 하락 추세에 있음을 나타냅니다.
마지막으로, ADX와 DI의 상황을 분석하여 구체적인 구매 및 판매 신호를 생성합니다.
- ADX가 상승하면, 중요한 값보다 높고, DI+가 DI-보다 높을 때, 구매 신호가 발생한다
- ADX가 상승하면, 중요한 값보다 높고, DI+가 DI-보다 낮으면, 판매 신호가 발생한다
- ADX가 하향으로 전환되면 평행 신호가 발생
이 정책은 또한 이동 평균 필터링 및 사용자 정의 재검토 시간 범위와 같은 기능을 제공하며, 필요에 따라 구성할 수 있다.
우위 분석
ADX 동적 평균 트렌드 지표 전략은 다음과 같은 장점을 가지고 있다:
- 시장의 동향을 자동으로 판단하여 무효 거래를 방지합니다.
- 자동으로 시장의 방향을 판단하고 트렌드를 추적할 수 있습니다.
- 트렌드가 존재할 때 구매/트렌드가 사라질 때 청산하는 명확한 논리를 제공합니다.
- 조작 가능한 이동 평균 필터링, 가짜 돌파구를 방지
- 역시 테스트를 위한 재검토 시간 범위를 구성할 수 있습니다.
- 지표와 매개 변수는 조정 가능하며, 다른 품종에 최적화 할 수 있습니다.
위험 분석
이 전략에는 몇 가지 위험도 있습니다.
- ADX 지표는 추세 초기에 놓친 기회를 놓치고 있습니다.
- 다공간 판단은 DI 지표에 의존하며, DI 지표는 민감하여 잘못된 신호를 생성할 수 있다.
- 이동 평균 필터링은 단선 기회를 놓칠 수 있습니다.
- 부적절한 회수 시간 범위가 과응을 초래할 수 있다.
- 지표 파라미터를 잘못 설정하면 정책 효과에 영향을 미칠 수 있습니다.
위험성을 줄이기 위해 다음과 같은 점들을 고려해 볼 수 있습니다.
- ADX 매개 변수를 적절히 줄여서 지연을 줄이십시오.
- 잘못된 신호를 방지하기 위해 DI 필터를 조정하거나 삭제합니다.
- 이동 평균 주기를 적절히 줄여라
- 전체 샘플 테스트를 위해 재검토 시간 범위를 확장합니다.
- 지표 변수를 최적화하여 최적의 설정을 찾습니다.
최적화 방향
이 전략은 다음과 같은 부분에서 최적화될 수 있습니다.
- 단일 주식 위험을 분산하기 위해 여러 주식과 결합하여 포트폴리오 테스트를 수행합니다.
- 단편 손실을 제어하기 위해 Stop Loss Logic을 추가합니다.
- 다른 지표와 결합하여 조합 검증하여 신호 정확도를 향상시킵니다.
- 기계 학습 알고리즘을 도입하여 구매 및 판매 신호를 판단합니다.
- 자동 변수 최적화 모듈을 추가하여 동적 변수 조정이 가능함
요약하다
ADX 동적 평균 트렌드 지표 전략은 ADX 판단 트렌드 존재와 DI 판단 트렌드 방향, 트렌드 존재 할 때 거래 신호를 생성, 전략 아이디어는 명확하다. 이 전략은 자동으로 트렌드를 판단, 트렌드를 추적, 어느 정도 비 트렌드 시장의 비효율 거래를 회피 할 수 있습니다. 약간의 최적화, 이 전략은 중장선 수량 거래의 강력한 도구가 될 수 있습니다.
/*backtest
start: 2024-01-07 00:00:00
end: 2024-01-14 00:00:00
period: 10m
basePeriod: 1m
exchanges: [{"eid":"Futures_Binance","currency":"BTC_USDT"}]
*/

//@version=4
// This source code is subject to the terms of the Mozilla Public License 2.0 at https://mozilla.org/MPL/2.0/
// © millerrh with inspiration from @9e52f12edd034d28bdd5544e7ff92e
//The intent behind this study is to look at ADX when it has an increasing slope and is above a user-defined key level (23 default).
//This is to identify when it is trending.
//It then looks at the DMI levels.  If D+ is above D- and the ADX is sloping upwards and above the key level, it triggers a buy condition.  Opposite for short.
//Can use a user-defined moving average to filter long/short if desried.
// NOTE: THIS IS MEANT TO BE USED IN CONJUNCTION WITH MY "ATX TRIGGER" INDICATOR FOR VISUALIZATION. MAKE SURE SETTINGS ARE THE SAME FOR BOTH.

strategy("ADX | DMI Trend", overlay=true, initial_capital=10000, currency='USD',
   default_qty_type=strategy.percent_of_equity, default_qty_value=100, commission_type=strategy.commission.percent, commission_value=0.04)

// === BACKTEST RANGE ===
From_Year  = input(defval = 2019, title = "From Year")
From_Month = input(defval = 1, title = "From Month", minval = 1, maxval = 12)
From_Day   = input(defval = 1, title = "From Day", minval = 1, maxval = 31)
To_Year    = input(defval = 9999, title = "To Year")
To_Month   = input(defval = 1, title = "To Month", minval = 1, maxval = 12)
To_Day     = input(defval = 1, title = "To Day", minval = 1, maxval = 31)
Start  = timestamp(From_Year, From_Month, From_Day, 00, 00)  // backtest start window
Finish = timestamp(To_Year, To_Month, To_Day, 23, 59)        // backtest finish window

// == INPUTS ==
// ADX Info
adxlen = input(14, title="ADX Smoothing")
dilen = input(14, title="DI Period")
keyLevel = input(23, title="Keylevel for ADX")
adxLookback = input(3, title="Lookback Period for Slope")

// == FILTERING ==
// Inputs
useMaFilter = input(title = "Use MA for Filtering?", type = input.bool, defval = true)
maType = input(defval="EMA", options=["EMA", "SMA"], title = "MA Type For Filtering")
maLength   = input(defval = 200, title = "MA Period for Filtering", minval = 1)

// Declare function to be able to swap out EMA/SMA
ma(maType, src, length) =>
    maType == "EMA" ? ema(src, length) : sma(src, length) //Ternary Operator (if maType equals EMA, then do ema calc, else do sma calc)
maFilter = ma(maType, close, maLength)
plot(maFilter, title = "Trend Filter MA", color = color.green, linewidth = 3, style = plot.style_line, transp = 50)

// Check to see if the useMaFilter check box is checked, this then inputs this conditional "maFilterCheck" variable into the strategy entry
maFilterCheck = if useMaFilter == true
    maFilter
else
    close

// == USE BUILT-IN DMI FUNCTION TO DETERMINE ADX AND BULL/BEAR STRENGTH
[diplus, diminus, adx] = dmi(dilen, adxlen)

buySignal = (adx[0]-adx[adxLookback] > 0) and adx > keyLevel and diplus > diminus  and close >= maFilterCheck
// buySignalValue = valuewhen(buySignal, close, 0)
shortSignal = (adx[0]-adx[adxLookback] > 0) and adx > keyLevel and diplus < diminus  and close <= maFilterCheck
// shortSignalValue = valuewhen(shortSignal, close, 0)
sellCoverSignal = adx[0]-adx[adxLookback] < 0

// == ENTRY & EXIT CRITERIA
// Triggers to be TRUE for it to fire of the BUY Signal : (opposite for the SELL signal).
// (1): Price is over the 200 EMA line. (EMA level configurable by the user)
// (2): "D+" is OVER the "D-" line
// (3): RSI 7 is under 30 (for SELL, RSI 7 is over 70)
// 1* = The ultimate is to have a combination line of 3 EMA values, EMA 14, EMA 50 and EMA 200 - And if price is over this "combo" line, then it's a strong signal

// == STRATEGY ENTRIES/EXITS ==
strategy.entry("Long", strategy.long, when = buySignal)
strategy.close("Long", when = sellCoverSignal)
strategy.entry("Short", strategy.short, when = shortSignal)
strategy.close("Short", when = sellCoverSignal)

// == ALERTS ==
// alertcondition(buySignal, title='ADX Trigger Buy', message='ADX Trigger Buy')
// alertcondition(sellSignal, title='ADX Trigger Sell', message='ADX Trigger Sell')