개요
이 파인 스크립트 전략은 TradingView 플랫폼에서 일일 평균 비용 전략을 구현하고, EMA 지표의 터치 신호와 결합하여 입점을 결정한다. 전략은 평균 비용 투자법을 따르며, 위험을 분산하기 위해 일일 일정한 금액으로 구매한다. 동시에, EMA의 터치 신호를 통해 특정 입점 시점을 안내한다.
전략 원칙
이 전략의 주요 특징은 다음과 같습니다.
하루 평균 비용 투자 법칙
- 매일 고정된 금액으로 구매합니다. 시장의 상승과 하락에도 상관없이
- 장기적인 분산 투자, 단독 투자에 대한 위험을 낮추는 것
EMA 지표는 진입점을 결정합니다.
- 5일, 10일, 20일 EMA를 마감 가격에 부딪히면 구매를 촉발합니다.
- EMA 라인은 지지를 제공하며, 단기 조정은 피하는 것이 좋습니다.
동적 상쇄 메커니즘
- 20일 간단한 이동 평균 아래로 상쇄될 때 상쇄를 중지합니다.
- 더 큰 손실을 피하기 위해
최대 위치 제한
- 최대 300 거래, 포지션 규모 및 위험을 제어할 수 있습니다.
- 과도한 투자로 인한 재정난을 막기
구체적으로, 전략은 매일 고정 금액을 투입하고, 당일 종결 가격에 따라 구입할 수 있는 주식의 수를 계산한다. 이 기초에서, 당일 종결 가격에 5일, 10일, 20일 등의 EMA 중 임의의 항목이 통과하면, 구매 신호를 유발한다. 축적된 포지션이 최대 제한인 300페이지를 달성하면, 새로운 구매 작업이 일어나지 않는다. 또한, 종결 가격이 20일 SMA를 넘어간다면, 또는 미리 설정된 퇴출 날짜에 도달하면, 포지션 중지 손실을 청산한다. 이 전략은 가격 그래프에 다른 주기의 EMA 선을 그리기도 하며, 시각적 분석을 용이하게 한다.
우위 분석
이 전략에는 다음과 같은 장점이 있습니다.
분산 투자, 단독 투자 위험을 낮추는 것
- 매일 소액, 일정한 금액으로 투자하세요.
- 하지만, 이 모든 것이 현실이 될 수 있습니다.
EMA는 단기 조정을 피합니다.
- EMA 상위에서는 구매 신호로 쓰이며, 철회 기간 동안의 구매를 피합니다.
- 철수 기간 동안 계속하여 대량 매입하여 위험을 분산합니다.
역동적인 상쇄, 손실 통제
- 스톱 라인을 설정하여 적시에 스톱 할 수 있습니다.
- 큰 손실을 방지하기
최대 포지션 제한, 위험 통제
- 최대 포지션은 미리 설정되어 과도한 투자를 방지할 수 있습니다.
- ETP의 용량 내에서 투자
직관적인 EMA는 쉽게 판단할 수 있습니다.
- 가격 그래프에 다른 EMA 주기의 선을 그리기
- 이 모든 것은 한눈에 볼 수 있고, 조작자가 쉽게 볼 수 있습니다.
높이는 사용자 정의
- 투자 금액, EMA 주기, 스톱 라인 등을 사용자 정의할 수 있습니다.
- 개인 리스크 선호도에 따라 조정
위험 분석
이 전략에는 몇 가지 위험도 있습니다.
체계적인 위험은 피할 수 없습니다.
- 블랙 스완 사건으로 인해 더 큰 손실이 발생할 수 있습니다.
- 분산투자는 위험을 줄일 수 있지만 완전히 피할 수는 없습니다.
고정 투자 금액의 위험
- 매일 고정금액을 투입하면 가격이 급격히 상승하면 후회할 수 있다.
- 동적으로 조정된 투입 금액을 최적화할 수 있습니다.
EMA는 극단적인 상황에 대응할 수 없습니다.
- EMA는 급격한 사건에 대해 느리게 반응하여 적자를 제때 막을 수 없었습니다.
- KD, BOLL 등의 지표와 결합하여 극단적인 상황을 파악하는 것을 고려할 수 있습니다.
포지션 제한은 수익을 제한합니다.
- 포지션은 상한이 있고, 무한히 늘릴 수 없습니다.
- 위험과 이득의 균형을 맞추기 위한 종합적인 고려가 필요합니다.
정지점 설정은 경험과 기술이 필요합니다.
- 스톱포인트가 너무 가까워지면 쉽게 뚫릴 수 있고, 너무 멀리 가면 제때 멈출 수 없다.
- 반복적인 테스트를 통해 균형을 잡아야 합니다.
최적화 방향
이 전략에는 더 많은 최적화 가능성이 있습니다:
매일 투입액을 동적으로 조정하는 것
- 특정 지표에 따라 동적으로 조정되는 일일 투입
- 긍정적인 상황에서는 투자가 증가하고, 부정적인 상황에서는 감소합니다.
더 많은 지표와 함께
- EMA 이외에도 KD, BOLL 등도 도입할 수 있다.
- 극단적 행위에 대한 판단력을 높여라
지수 이동 평균
- EMA는 급격한 사건에 대해 느리게 반응하여 DEMA, TEMA 등을 고려할 수 있습니다.
- 새로운 트렌드를 더 빨리 파악할 수 있습니다.
동적으로 최대 포지션을 조정
- 전략적 수익성에 따라 최대 포지션을 동적으로 조정할 수 있습니다.
- 적당히 큰 포지션으로 평가할 때
점진적 상쇄를 사용함
- 기존 전략은 직접 청산 손실이며, 점진적 청산이 가능합니다.
- 스톱포드의 ‘복제’의 위험을 방지하기 위해
요약하다
전체적으로, 이 하루 평균 비용 전략은 EMA 터치 신호를 결합하여 장기간에 걸쳐 투자하는 아이디어를 구현한다. 단일 대장 입장을 개설하는 것과 비교하여 위험을 분산하여 고점의 축제를 피할 수 있다. EMA의 가입은 또한 단기 조정으로 인한 위험을 어느 정도 회피하고, 손실을 최대한 제어하기 위해 손실 조치를 취한다. 동시에, 여전히 블랙 천둥 위험과 고정 투입 금액이 기회를 충분히 잡지 못하는 아쉬움과 같은 문제를 주의해야 한다.
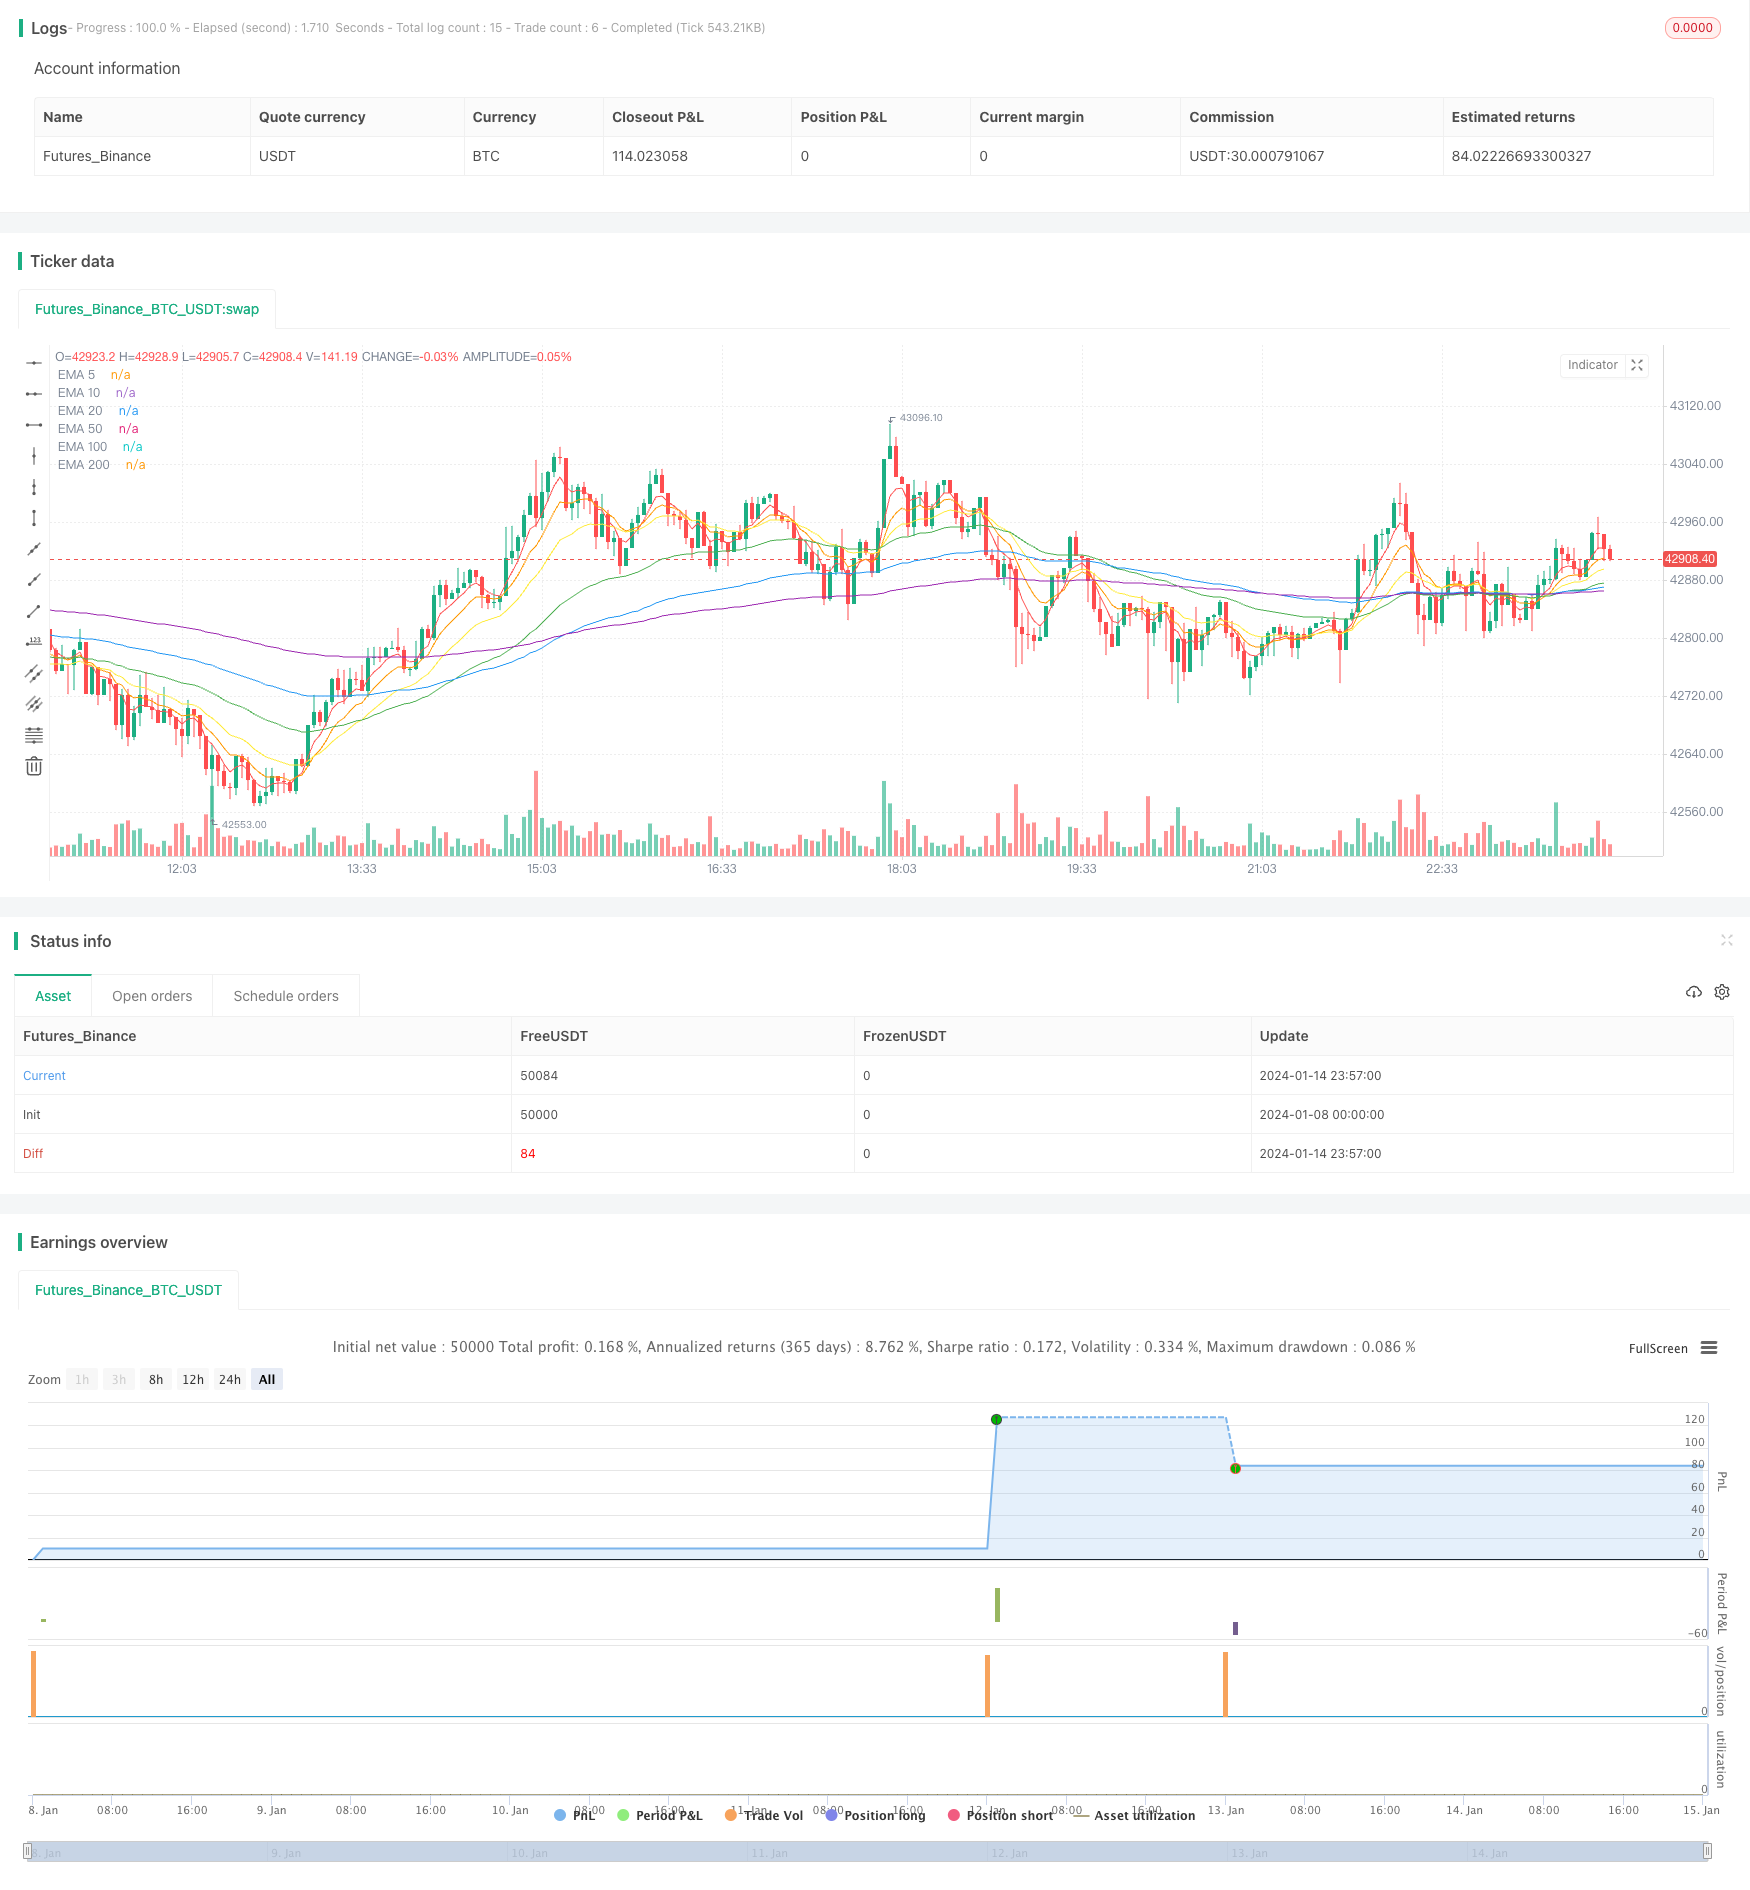
/*backtest
start: 2024-01-08 00:00:00
end: 2024-01-15 00:00:00
period: 3m
basePeriod: 1m
exchanges: [{"eid":"Futures_Binance","currency":"BTC_USDT"}]
*/

//@version=4
strategy("Daily DCA Strategy with Touching EMAs", overlay=true, pyramiding=10000)

// Customizable Parameters
daily_investment = input(50000, title="Daily Investment")
start_year = input(2022, title="Start Year")
start_month = input(1, title="Start Month")
start_day = input(1, title="Start Day")
end_year = input(2023, title="End Year")
end_month = input(12, title="End Month")
end_day = input(1, title="End Day")
trade_count_limit = input(10000, title="Pyramiding Limit")
enable_sell = input(true, title="Enable Sell")

start_date = timestamp(start_year, start_month, start_day)
var int trade_count = 0

// Calculate the number of shares to buy based on the current closing price
shares_to_buy = daily_investment / close

// Check if a new day has started and after the start date
isNewDay = dayofmonth != dayofmonth[1] and time >= start_date

// Buy conditions based on EMA crossovers
ema5_cross_above = crossover(close, ema(close, 5))
ema10_cross_above = crossover(close, ema(close, 10))
ema20_cross_above = crossover(close, ema(close, 20))
ema50_cross_above = crossover(close, ema(close, 50))
ema100_cross_above = crossover(close, ema(close, 100))
ema200_cross_above = crossover(close, ema(close, 200))

if isNewDay and (ema5_cross_above or ema10_cross_above or ema20_cross_above or ema50_cross_above or ema100_cross_above or ema200_cross_above) and trade_count < trade_count_limit
    strategy.entry("Buy", strategy.long, qty=shares_to_buy)
    trade_count := trade_count + 1

// Dynamic sell conditions (optional)
sell_condition =  true

if enable_sell and sell_condition
    strategy.close_all()

// EMA Ribbon for visualization
plot(ema(close, 5), color=color.red, title="EMA 5")
plot(ema(close, 10), color=color.orange, title="EMA 10")
plot(ema(close, 20), color=color.yellow, title="EMA 20")
plot(ema(close, 50), color=color.green, title="EMA 50")
plot(ema(close, 100), color=color.blue, title="EMA 100")
plot(ema(close, 200), color=color.purple, title="EMA 200")