ADX 모멘텀 추세 전략

1
Follow
1802
Followers
개요
해당 전략은 ADX 지표를 기반으로 시장 추세를 판단하고, DMI 지표를 결합하여 매수/매도 방향을 결정하며, ADX 기울기를 이용해 추세 강도를 측정합니다. 또한 ADX 임계값을 설정하여 비추세 시장을 걸러내고, 이동평균선을 보조하여 거래 신호를 필터링합니다.
전략 원리
- ADX, DI+, DI- 지표를 계산합니다.
- ADX 기울기가 0보다 크면 추세가 증가하고 있음을 의미합니다. 임계값은 23으로 설정하여 비추세 시장을 걸러냅니다.
- DI+가 DI-보다 높으면 매수 세력이 매도 세력보다 강하다는 뜻으로, 매수 신호로 간주합니다.
- 이동평균선 필터를 활성화하면 종가가 이동평균선보다 높을 때만 매수 신호가 발생합니다.
- ADX 기울기가 0보다 작아지면 포지션을 청산합니다. 이는 추세가 약화되었음을 의미합니다.
장점 분석
- 이동평균선 보조 필터를 사용하면 비추세 시장의 잡음 거래를 줄일 수 있습니다.
- ADX 기울기로 추세 강도를 판단하여 추세 발전을 정확히 파악할 수 있습니다.
- DI를 통한 방향 판단과 ADX를 통한 강도 판단이 결합되어 비교적 완전한 추세 거래 의사결정 체계를 형성합니다.
- 손실폭과 손익비 측면에서 단순 이동평균선 전략보다 우수할 가능성이 있습니다.
위험 분석
- ADX 지표에 다른 파라미터를 설정하면 결과에 큰 차이가 발생할 수 있습니다.
- DMI가 매수/매도 방향을 완전히 확정하기 전에 잘못된 신호를 보낼 수 있습니다.
- 어느 정도의 지연이 존재하여 전략 효율성을 낮춥니다.
최적화 방향
- ADX 파라미터 조합을 최적화하여 최적의 파라미터를 찾습니다.
- 손절매 전략을 추가하여 단일 거래 손실 확대를 방지합니다.
- 다른 지표(예: RSI, 볼린저 밴드)를 결합하여 신호를 필터링하는 방안을 시도합니다.
요약
이 전략은 ADX가 추세와 추세 강도를 판단하는 장점을 최대한 활용하고, DMI 지표를 결합하여 방향을 결정함으로써 완전한 추세 추종 체계를 구축합니다. 동시에 이동평균선을 보조적으로 사용하여 비추세 시장의 잡음을 효과적으로 걸러낼 수 있습니다. 파라미터 최적화와 지표 조합을 통해 전략의 안정성과 효율성을 더욱 향상시킬 수 있습니다. 전반적으로 이 전략은 추세 판단과 방향 판단의 특징을 결합하여 좋은 수익을 기대할 수 있습니다.
Source
Pine
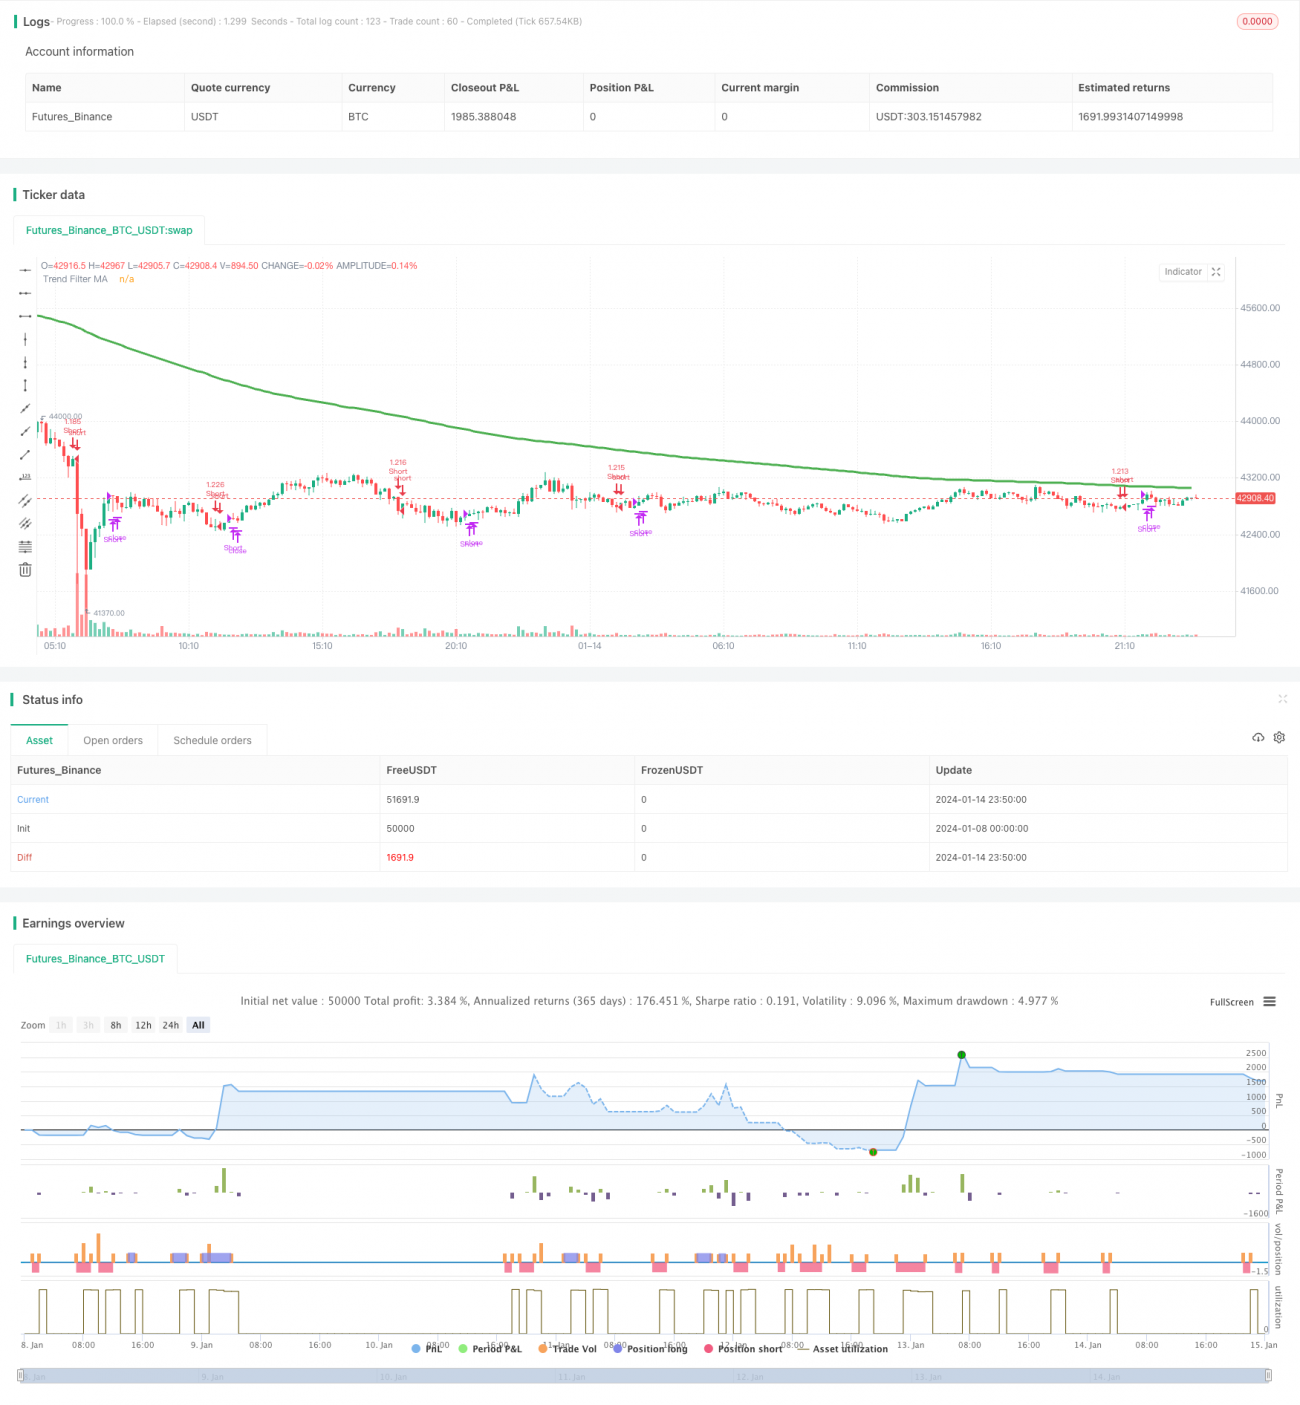
/*backtest
start: 2024-01-08 00:00:00
end: 2024-01-15 00:00:00
period: 10m
basePeriod: 1m
exchanges: [{"eid":"Futures_Binance","currency":"BTC_USDT"}]
*/

//@version=4
// This source code is subject to the terms of the Mozilla Public License 2.0 at https://mozilla.org/MPL/2.0/
// © millerrh with inspiration from @9e52f12edd034d28bdd5544e7ff92e
//The intent behind this study is to look at ADX when it has an increasing slope and is above a user-defined key level (23 default). Strategy parameters
Related strategies
Comment
All comments (0)
No data
- 1