개요
이 전략은 윌리엄 블라우가 1995년에 출판한 ?? 운동량, 방향 및 역동량 (Movement, Direction, and Deviation) ?? 에서 설명한 기술적인 지표인 운동량, 방향, 그리고 역동량 (Movement, Direction, and Deviation) 을 기반으로 한 기술적인 지표인 미비도 (Movement, Divergence) 를 기반으로 설계되었다. 이 지표는 가격 운동량, 가격 방향, 가격 역동량 (Movement, Direction, and Deviation) 의 세 가지 핵심 요소에 초점을 맞추고 가격과 운동량 사이의 관계를 심층적으로 분석한다.
전략 원칙
이 전략은 동력 평균 차차 지표를 사용하여 가격의 경향과 파열점을 판단한다. 우선 가격의 EMA 평균을 계산하고, 그 다음 가격의 EMA 선의 편차를 계산한다. 이 편차는 더블 EMA 평준화 처리를 거쳐 최종 동력 평균 차차 지표 곡선을 얻는다. 그 곡선 위에 자신의 신호선을 통과하거나 통과 할 때 거래 신호를 생성한다. 구체적으로, 계산 과정은 다음과 같습니다:
- 가격 xEMA를 계산하는 EMA의 평균선
- 가격과 xEMA의 오차를 계산하는 xEMA_S
- xEMA_S에 대해 EMA를 매끄럽게 하고, 변수 s로, xEMA_U를 얻는다.
- xEMA_U에 대해 EMA를 매끄럽게 하고, 변수가 u로, 신호 라인을 얻는다.
- xEMA_U와 xSignal의 사이즈 관계 비교:
- xEMA_U > xSignal 다중 신호
- xEMA_U
- 거래 신호 possig를 생성
포시그 신호에 따라 구매와 판매를 한다.
우위 분석
이 전략은 다음과 같은 장점을 가지고 있습니다.
- 이중 EMA 필터를 사용하여 가짜 돌파를 효과적으로 필터링하여 신호의 신뢰성을 향상시킵니다.
- EMA를 기반으로 단기 가격 변화에 민감하고 동향의 전환점을 잡을 수 있습니다.
- 변수화 디자인을 적용하여 다른 주기 및 품종에 맞게 변수를 조정할 수 있습니다.
- 장단한 쌍방향 거래 신호를 포함하고, 가격의 쌍방향 변동을 활용하여 수익을 창출합니다.
위험 분석
이 전략에는 몇 가지 잠재적인 위험도 있습니다.
- EMA는 파라미터 선택에 민감하며, 부적절한 설정으로 신호를 놓치거나 잘못된 신호를 생성할 수 있다.
- 다중 헤드 및 공중 헤드 신호가 동시에 나타날 수 있으며, 서로 상쇄되는 것을 피하기 위해 필터링 조건을 설정해야 합니다.
- 이중 EMA 필터는 유효한 신호를 과다 필터링하여 누락된 신호를 발생시킬 수 있습니다.
- 대주기 트렌드를 고려하지 않고 역경 거래 위험이 있다.
이러한 위험은 최적화 매개 변수, 필터 조건 설정, 추세 판단 등의 방법으로 줄일 수 있다.
최적화 방향
이 전략의 최적화 방향은 다음과 같습니다.
- 최적화 변수 r,s,u 값, 다른 주기 및 품종 특성에 더 적합하게
- 트렌드 판단 모듈을 추가하여 역동적인 동작을 피합니다.
- 통로 돌파와 같은 필터링 조건을 추가하여 유효하지 않은 신호를 피합니다.
- 다른 요소와 모델과 결합하여 전략의 효과를 높이는 방법
요약하다
이 전략은 가격과 동량 관계의 동량 평균 지표에 기반하여 가격 반전 시점을 포착한다. 이 전략은 변수화되고 최적화 가능한 디자인으로, 다른 주기 및 품종에 적응할 수 있다. 그러나 또한 특정 잘못된 신호와 역동 거래의 위험이 존재한다. 변수와 모델을 추가로 최적화하고, 트렌드 판단과 결합하여 더 나은 성과를 얻을 수 있다.
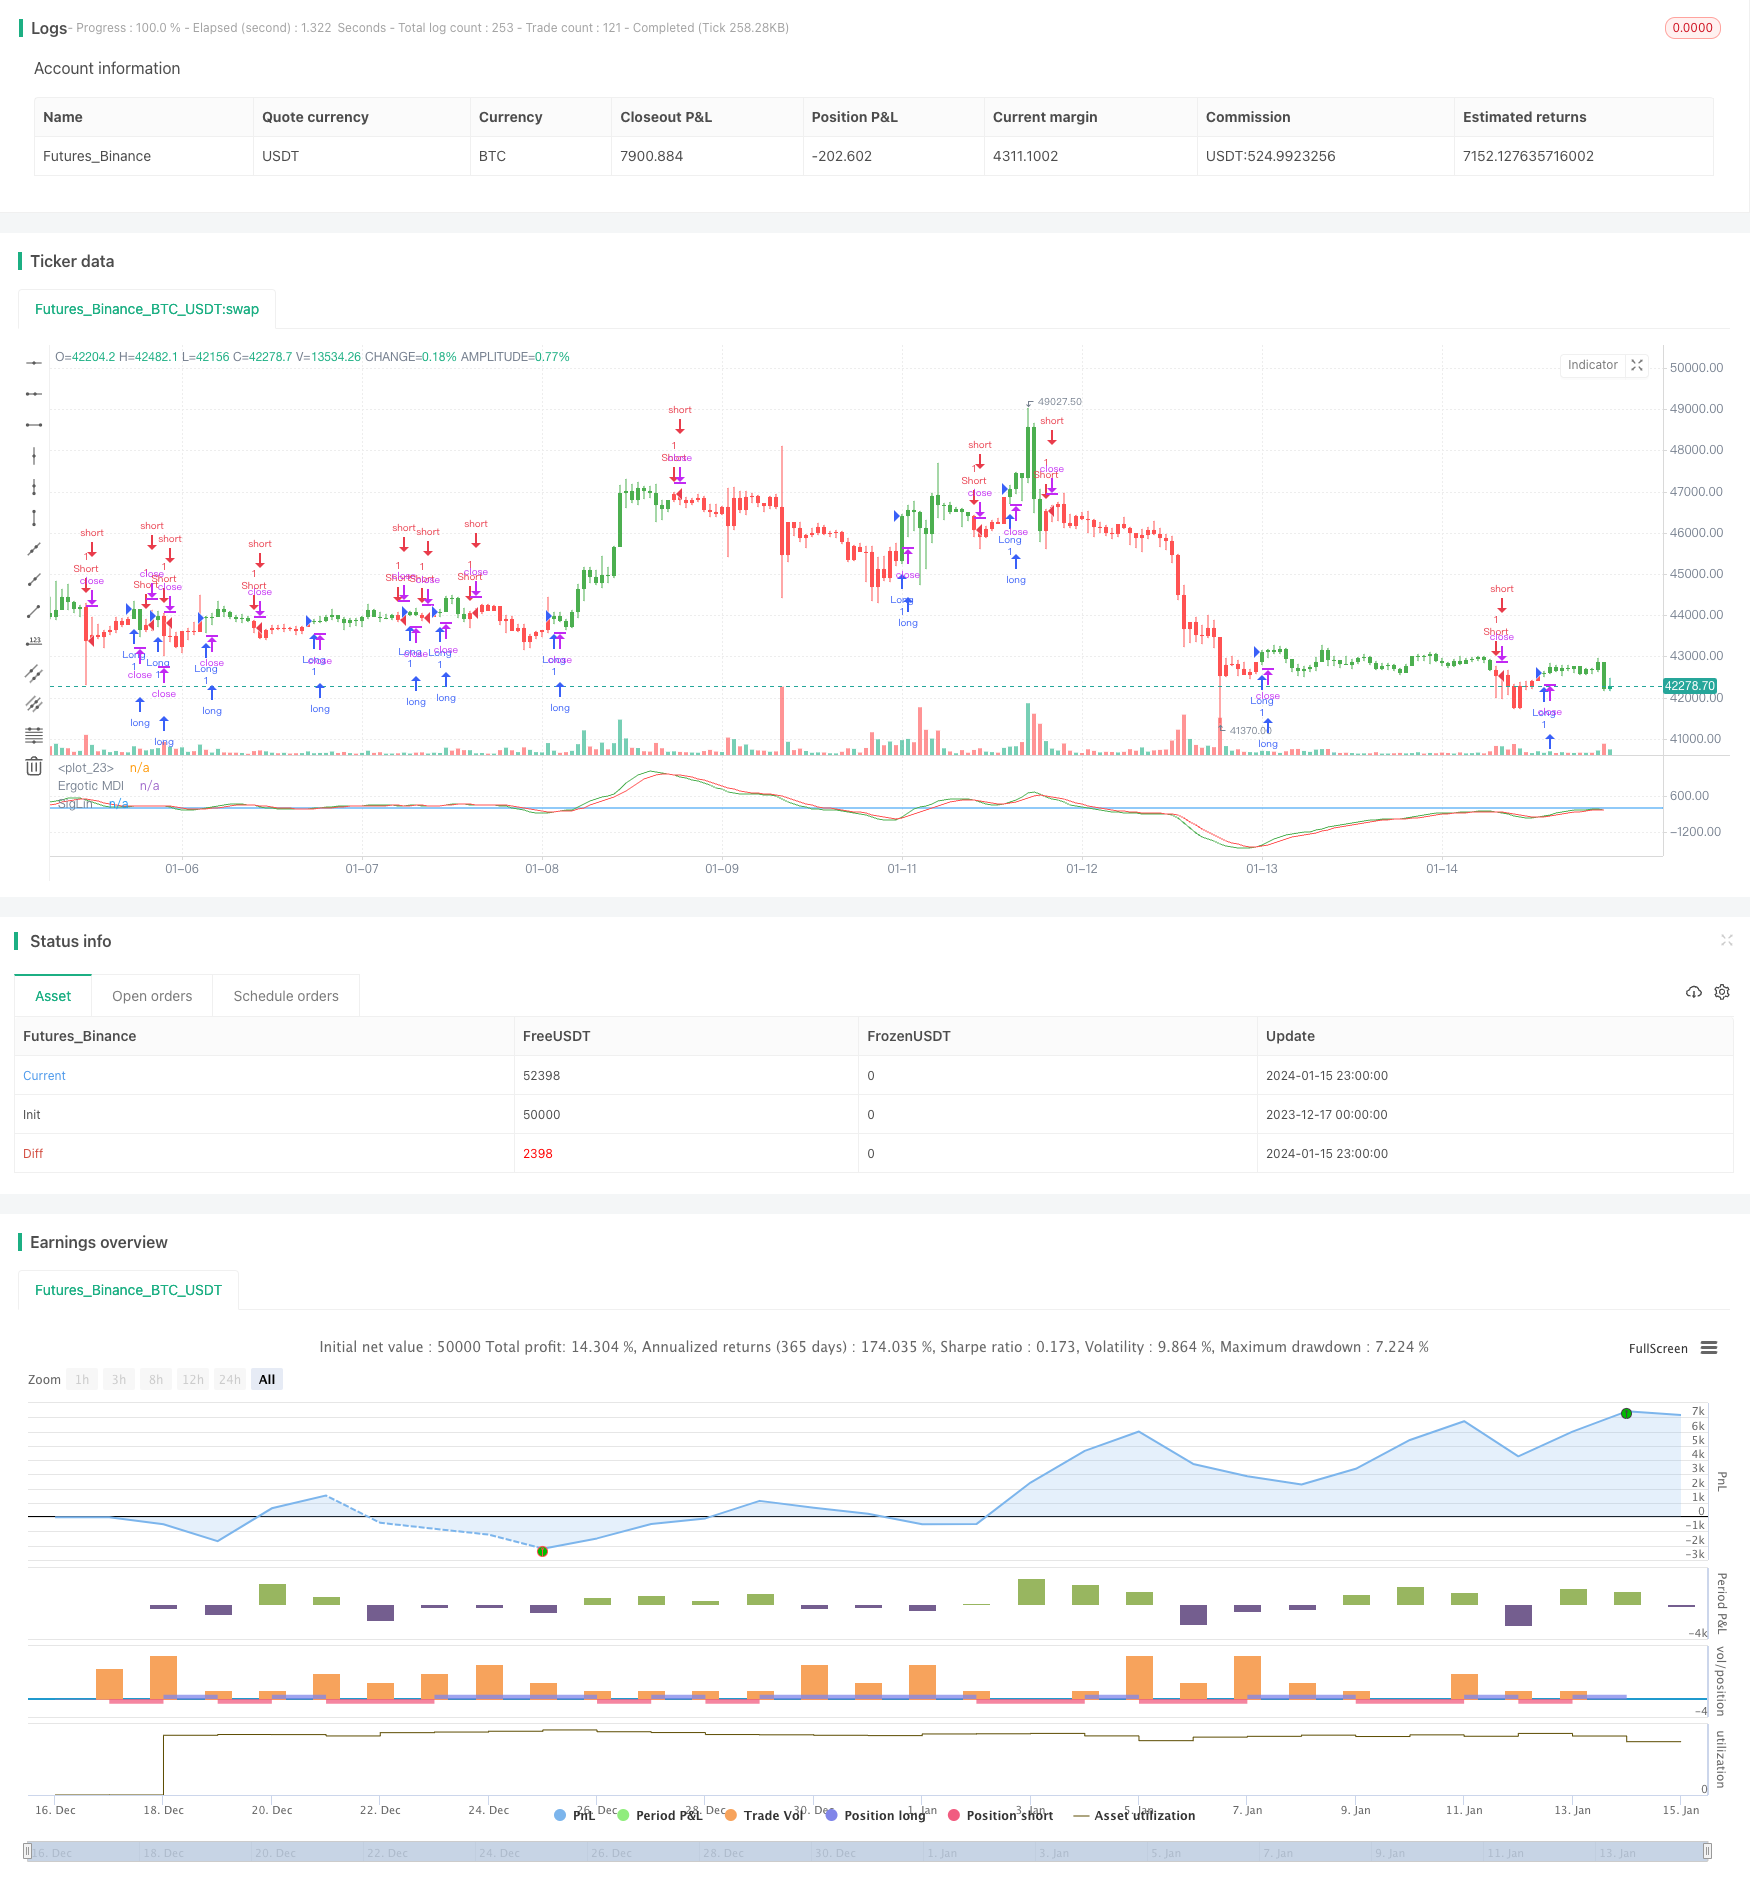
/*backtest
start: 2023-12-17 00:00:00
end: 2024-01-16 00:00:00
period: 1h
basePeriod: 15m
exchanges: [{"eid":"Futures_Binance","currency":"BTC_USDT"}]
*/

//@version = 2
////////////////////////////////////////////////////////////
//  Copyright by HPotter v1.0 12/12/2016
// This is one of the techniques described by William Blau in his book "Momentum,
// Direction and Divergence" (1995). If you like to learn more, we advise you to
// read this book. His book focuses on three key aspects of trading: momentum,
// direction and divergence. Blau, who was an electrical engineer before becoming
// a trader, thoroughly examines the relationship between price and momentum in
// step-by-step examples. From this grounding, he then looks at the deficiencies
// in other oscillators and introduces some innovative techniques, including a
// fresh twist on Stochastics. On directional issues, he analyzes the intricacies
// of ADX and offers a unique approach to help define trending and non-trending periods.
//
// You can change long to short in the Input Settings
// Please, use it only for learning or paper trading. Do not for real trading.
////////////////////////////////////////////////////////////
strategy(title="Ergotic MDI (Mean Deviation Indicator) Bactest")
r = input(32, minval=1)
s = input(5, minval=1)
u = input(5, minval=1)
SmthLen = input(3, minval=1)
reverse = input(false, title="Trade reverse")
hline(0, color=blue, linestyle=line)
xEMA = ema(close, r)
xEMA_S = close - xEMA
xEMA_U = ema(ema(xEMA_S, s), u)
xSignal = ema(xEMA_U, u)
pos = iff(xEMA_U > xSignal, 1,
	   iff(xEMA_U < xSignal, -1, nz(pos[1], 0)))
possig = iff(reverse and pos == 1, -1,
          iff(reverse and pos == -1, 1, pos))
if (possig == 1)
    strategy.entry("Long", strategy.long)
if (possig == -1)
    strategy.entry("Short", strategy.short)
barcolor(possig == -1 ? red: possig == 1 ? green : blue )
plot(xEMA_U, color=green, title="Ergotic MDI")
plot(xSignal, color=red, title="SigLin")