개요
이 전략은 비트코인과 이더리움에 적용되는 간단한 이동 평균 트렌드 추적 전략이다. 그것은 평균선, MACD 및 RSI와 같은 여러 지표들을 결합하여 트렌드 방향을 식별하고, 고정된 위치의 긴 줄을 사용하여 트렌드를 추적한다.
전략 원칙
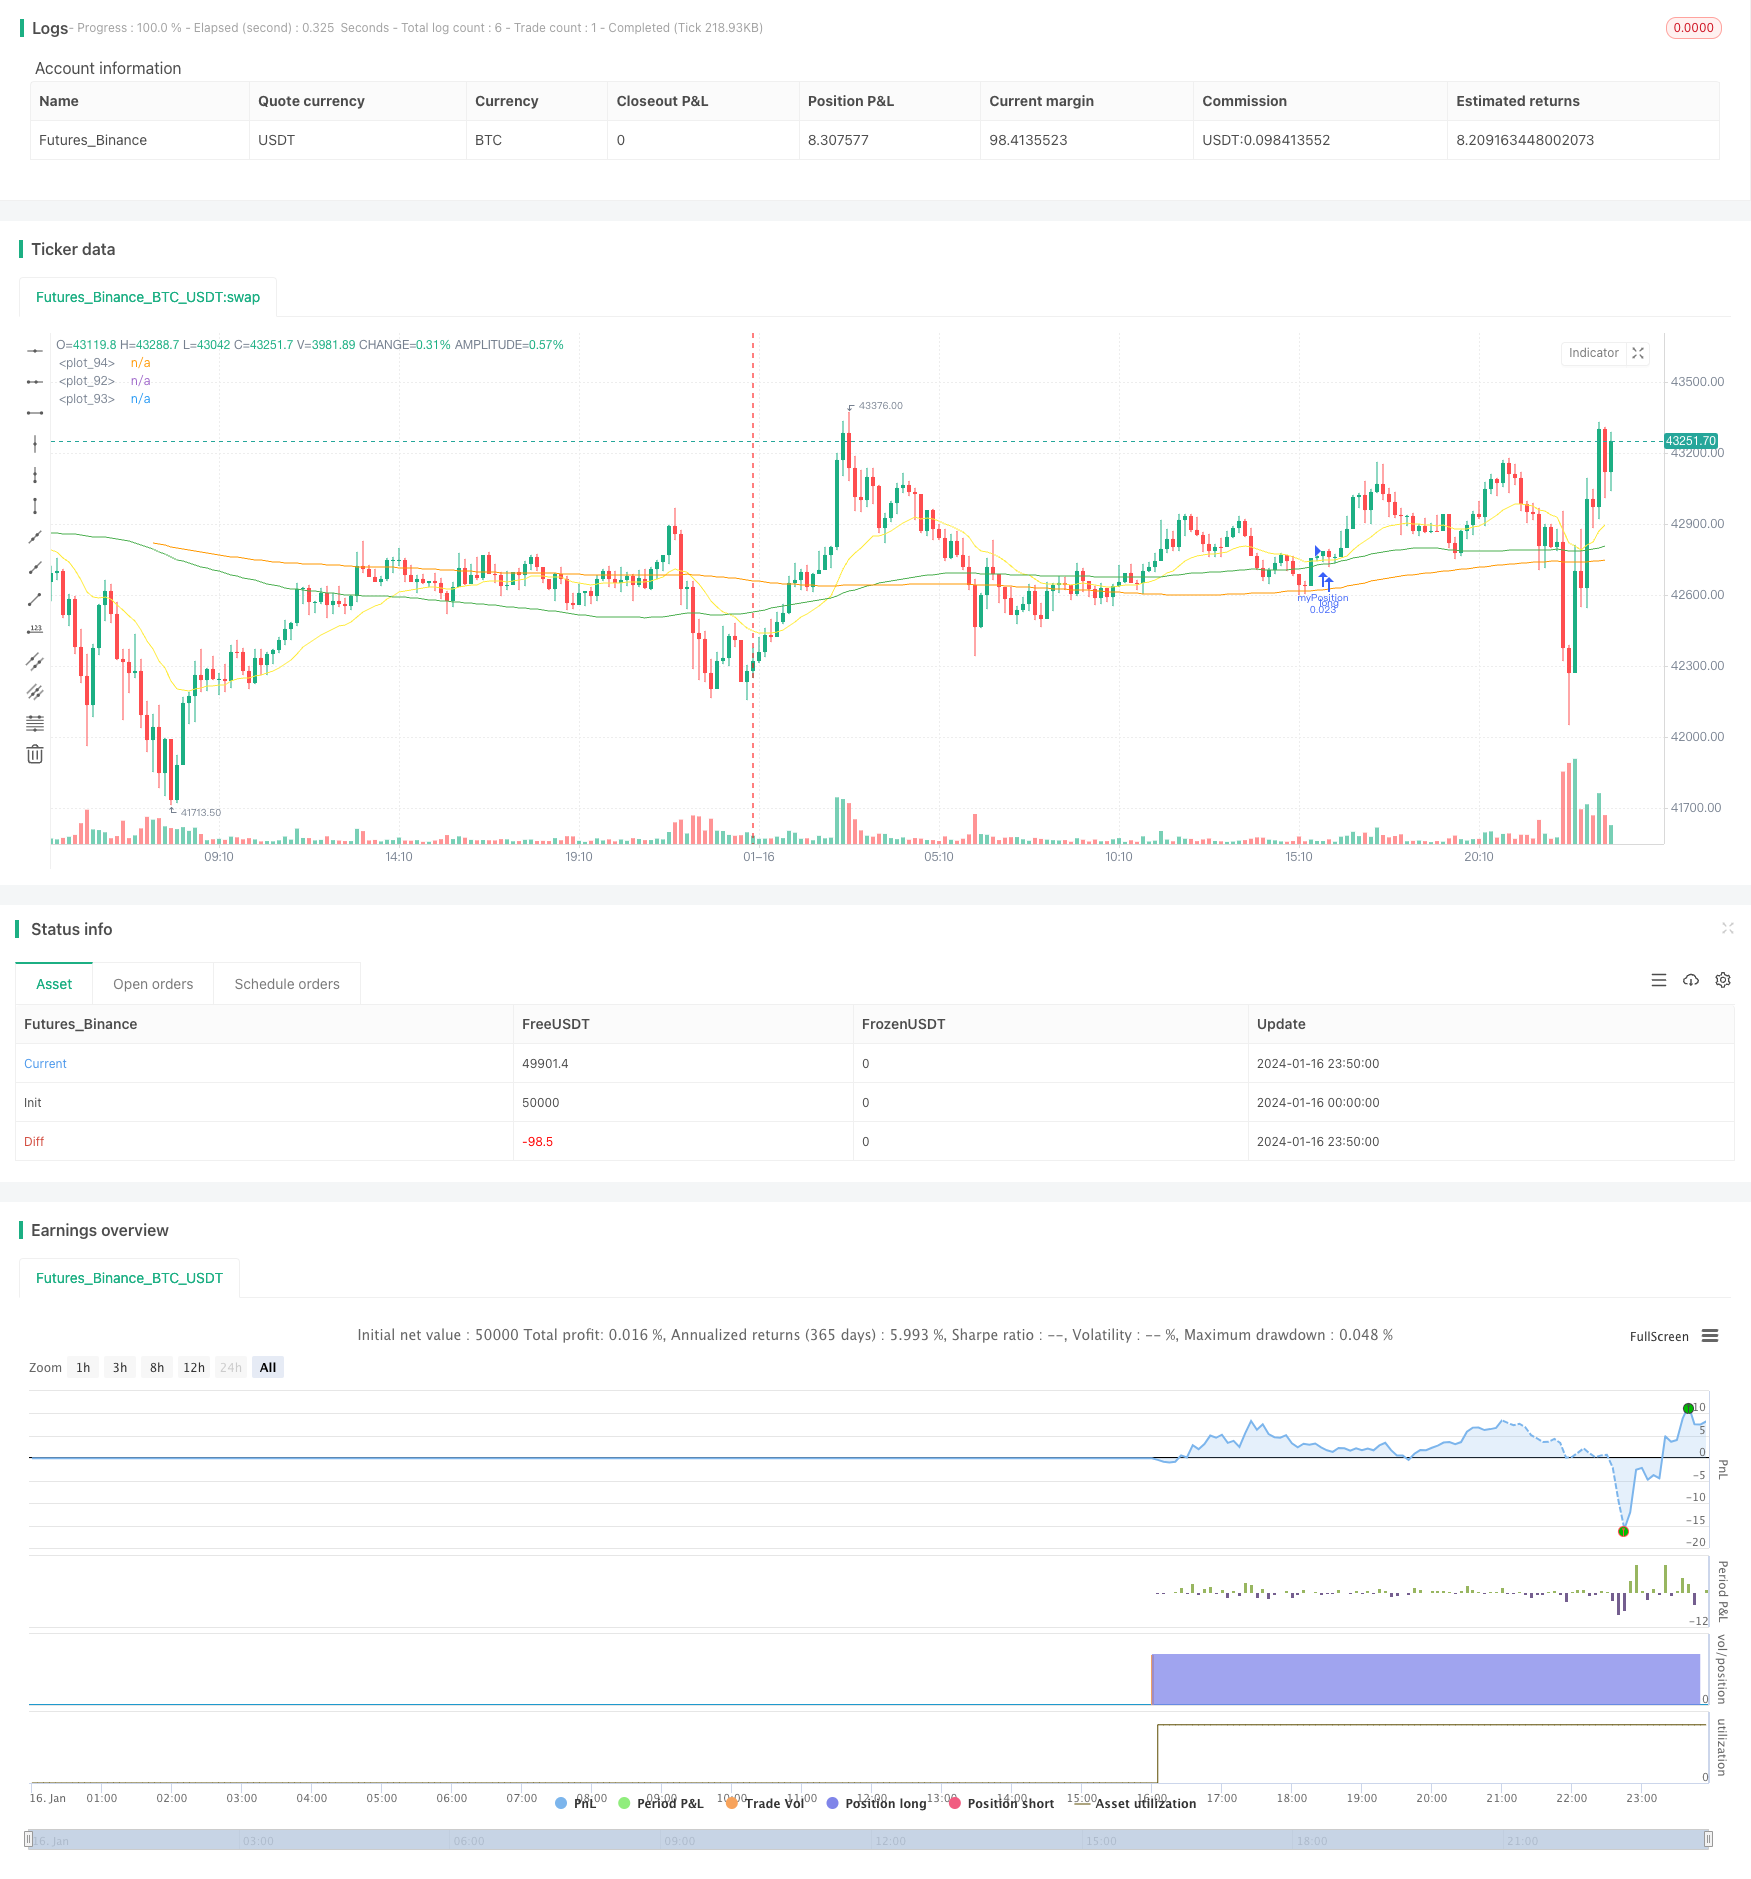
전략의 핵심 논리는 20일 EMA 선에서 100일 SMA 선과 100일 SMA 선에서 200일 SMA 선을 통과할 때 더 많이 하고; 20일 EMA 선 아래에서 100일 SMA 선을 통과할 때 평점이다. 즉, 세 개의 다른 기간의 이동 평균을 사용하여 트렌드 방향을 결정한다.
구체적으로, 전략은 20일 EMA선, 100일 SMA선, 200일 SMA선의 값을 계산하고 그 크기의 관계를 비교하여 트렌드를 판단한다. 20일 EMA선에서 100일 SMA선을 뚫고, 즉 20일 EMA선이 100일 SMA선보다 크면 가격이 상승하기 시작한다는 것을 나타냅니다. 100일 SMA선이 200일 SMA선보다 크면 중장기 트렌드가 상승하고 있다는 것을 나타냅니다.
다중 포지션에 진입한 후, 전략은 계속 포지션을 유지하고, 트렌드 운영을 따른다. 20일 EMA 라인이 100일 SMA 라인을 다시 뚫을 때, 단기 트렌드가 반전 신호를 나타냅니다. 이 때 전략은 평소 포지션을 중지한다.
또한, 전략은 MACD와 RSI와 같은 지표와 결합하여 트렌드를 확인합니다. MACD의 DIF 라인, DEMA 라인 및 HIST 기둥 라인이 상승하고 RSI 지표가 50보다 높을 때만 더 많은 위치를 선택합니다.
전략적 이점
이 전략의 가장 큰 장점은 명확한 트렌드 트레이딩 규칙을 수립하여 중장선 트렌드를 효과적으로 추적할 수 있다는 것입니다. 구체적인 장점은 다음과 같습니다:
- 다중 이동 평균을 사용하여 동향을 판단하는 것이 더 신뢰할 수 있습니다.
- 장선 포지션을 사용해서 트렌드를 추적하고, 단기 시장의 변동에 방해받지 않는다.
- MACD 및 RSI와 같은 지표와 결합하여 전략 신호 확인을 통해 가짜 돌파구를 필터링 할 수 있습니다.
- EMA 라인과 SMA 라인의 골드 포크와 데드 포크를 통해 입단과 출전 포인트를 판단하는 규칙은 간단하고 명확하다.
- 효율적으로 위험을 통제하고, 손실을 줄이기 위해 스톱로스를 사용한다.
위험과 해결
이 전략에는 몇 가지 위험도 있습니다. 주요 문제는 트렌드가 반전될 때 적시에 멈출 수 없다는 것입니다. 구체적인 위험과 해결 방법은 다음과 같습니다:
트렌드 반전 지점까지 추적할 수 없는 경우: 평균주기를 줄일 수 있거나, 더 많은 지표를 더해서 종합적인 판단을 할 수 있다.
지분 기간이 너무 길어지면 손실이 더 커질 수 있다. 출전 라인을 적절히 단축하고 적시에 손실을 막을 수 있다.
평균선 지표는 지연이 쉽게 발생한다: 특정 회수 비율의 스톱 라인을 추가할 수 있으며, 적극적으로 스톱한다.
최적화 방향
이 전략은 다음과 같은 부분에서 최적화될 수 있습니다.
더 많은 조합의 평균 선주기를 테스트하여 최적의 변수를 찾습니다.
다른 지표나 모델을 사용해 트렌드나 출전 시기를 판단해 보세요. 예를 들어, 브린 밴드, KD 지표 등이 있습니다.
기계학습 등의 방법으로 동적으로 최적화 매개 변수. 예를 들어 강도학습을 사용하여 중지 손실을 조정한다.
거래량 지표와 결합하여 가짜 돌파구를 방지합니다. 예를 들어 에너지 물결 지표, 거래량 등등입니다.
자동 스톱 및 스톱 추적 시스템을 개발하여 시장 상황에 따라 스톱 위치를 조정할 수 있습니다.
요약하다
이 전략은 전체적으로 간단하고 직접적인 트렌드 추적 전략이다. 이동 평균을 사용하여 트렌드 방향을 판단하고, MACD와 RSI 필터 신호를 사용합니다. 더 긴 포지션 시간을 사용하여 트렌드를 추적한다. 중장선 트렌드 기회를 효과적으로 잡을 수 있다. 또한 트렌드 반전의 지연을 식별하는 위험이 있습니다.
/*backtest
start: 2024-01-16 00:00:00
end: 2024-01-17 00:00:00
period: 10m
basePeriod: 1m
exchanges: [{"eid":"Futures_Binance","currency":"BTC_USDT"}]
*/

//@version=4
strategy(title="BTC_Long_Only_TV01_200507", overlay=true)

//////////// !!!!!!!!!!!!!!!! WORK BEST IN 2 HOURS for BTC, ETH and ETHXBT !!!!!!!!!!!!!!!!!!! /////////////////////
//280820 - After long esting this is the best script for ETHUSD in 4 hours. From 01/01/2020 til 28/08/2020


[macdLine, macdSignalLine, macdHist] = macd(close, 12, 26, 7)

//_rsi_len = input(14, title="RSI length")
_rsi_len = 14

NewValue = 0
PreviousValue = 0
leverage = 1

smaPercentageIncrease = 0.0
SMA_PERCENT_INCREASE = 0.0
float atrValue = 0
bool bPositionOpened = false
float stockPositionSize = 0
float volatilityPercentage = 0.0
bool bDisplayArrow = false
bool bEMAIsRising = false
bool bSMAIsRising = false
bool bSMASlowIsRising = false
bool bMACDIsRising = false
bool bMACDHistIsRising = false
bool bMACDSignalIsRising = false

float stopLoss = input (5, "StopLoss in %", type=input.float) //StopLoss associated with the order
//Best for alt versus BTC float stopLoss = input (3, "StopLoss in %", type=input.float) //StopLoss associated with the order
float positionSize = 1000
float currentPrice = close
float stopLossPrice = 0
float entryPrice = 0


//-----------------------------------------------------------


// === INPUT BACKTEST RANGE ONE YEAR
//FromDay   = input(defval = 01, title = "From Day", minval = 1, maxval = 31)
//FromMonth = input(defval = 01, title = "From Month", minval = 1, maxval = 12)
//FromYear  = input(defval = 2020, title = "From Year", minval = 2017)
FromDay   = 01
FromMonth = 01
FromYear  = 2020

//ToDay     = input(defval = 01, title = "To Day", minval = 1, maxval = 31)
//ToMonth   = input(defval = 01, title = "To Month", minval = 1, maxval = 12)
//ToYear    = input(defval = 2023, title = "To Year", minval = 2017)
ToDay     = 14
ToMonth   = 05
ToYear    = 2029

// === FUNCTION EXAMPLE ===
start     = timestamp(FromYear, FromMonth, FromDay, 00, 00)  // backtest start window
finish    = timestamp(ToYear, ToMonth, ToDay, 23, 59)        // backtest finish window
window()  => true // create function "within window of time"


//FUNCTION DEFINITIONS
//----------------------
IsRising(data, loopBack) =>
    bIsRising = true
    for n = 1 to loopBack
        if data[n] > data[n-1]
            bIsRising := false
        continue
    bIsRising

IsFalling(data, loopBack) =>
    bIsFalling = true
    for n = 1 to loopBack
        if data[n] < data[n-1]
            bIsFalling := false
        continue
    bIsFalling

// END OF FUNCTION DEFINITIONS //


emaLength = 20
smaLength = 100
smaSlowLength = 200

ema = ema(close, emaLength)
sma = sma(close, smaLength)
smaSlow = sma(close, smaSlowLength)

plot(sma, color=color.green)
plot(smaSlow, color=color.orange)
plot(ema, color=color.yellow)

//reload previous values
stopLossPrice := na(stopLossPrice[1]) ? 0.0 : stopLossPrice[1]
entryPrice := na(entryPrice[1]) ? 0.0 : entryPrice[1]
bPositionOpened := na(bPositionOpened[1]) ? false : bPositionOpened[1]
positionSize := na(positionSize[1]) ? 1000 : positionSize[1]
stockPositionSize := na(stockPositionSize[1]) ? 0 : stockPositionSize[1]
//leverage := na(leverage[1]) ? 1 : leverage[1]

bEMAIsRising := IsRising(ema, 2)
bSMAIsRising := IsRising(sma, 3)
bMACDIsRising := IsRising(macdLine, 3)
bMACDHistIsRising := IsRising(macdHist, 1)
bSMASlowIsRising := IsRising(smaSlow, 10)
bMACDSignalIsRising := IsRising(macdSignalLine, 3)


atrValue := atr(14)
volatilityPercentage := (atrValue/currentPrice)*100 //calcute the volatility. Percentage of the actual price


if (window())
    //Check if we can open a LONG
    if (bPositionOpened == false and bSMASlowIsRising == true and bMACDIsRising == true and bEMAIsRising == true and bSMAIsRising == true and ema[0] > sma[0] and sma[0] < currentPrice)
        //Enter in short position
        stockPositionSize := (positionSize*leverage)/currentPrice //Calculate the position size based on the actual price and the position Size (in $) configured.

        //calculate exit values
        stopLossPrice := currentPrice*(1-stopLoss/100)
        strategy.entry("myPosition", strategy.long, qty=stockPositionSize, comment="BUY at " + tostring(currentPrice))
        entryPrice := currentPrice //store the entry price
        bPositionOpened := true
        bDisplayArrow := true

    if (bPositionOpened == true and (currentPrice <= stopLossPrice or crossunder(ema[1], sma[1])))
        strategy.close("myPosition", comment="" + tostring(currentPrice) ) //Stop
        //uncomment the below line to make the bot investing the full portfolio amount to test compounding effect.
        //positionSize := positionSize + ((stockPositionSize * currentPrice) - (positionSize*leverage))
        //reset some flags
        bPositionOpened := false
        bDisplayArrow := true
        entryPrice := 0.0