포물선 SAR 추세 추종 전략

개요
이 전략은 패러폴리 라인 SAR (스톱 로드 리버스) 지표와 EMA 평행선을 결합하여 필터링하여 거래 신호의 정확성을 향상시킵니다. 이 전략은 트렌드를 추적하는 거래자에게 적합합니다.
전략 원칙
SAR가 가격 아래에 있고 가격이 느린 EMA 평균선 + 편향량보다 높을 때 다중 신호가 발생하고 SAR가 가격 위에 있고 가격이 느린 EMA 평균선 + 편향량보다 낮을 때 공백 신호가 발생한다. 동시에, 빠른 EMA 평균선과 느린 EMA 평균선의 교차로 추가 필터링을 한다. 이렇게 SAR 지표가 단독으로 사용되었을 때 발생할 수있는 잘못된 신호를 피할 수 있다.
구체적으로, 다중 신호의 촉발 조건은 1) SAR가 어제의 종결 가격 아래에 있고 현재의 종결 가격 위에 있습니다. 2) 현재 종결 가격이 느린 EMA 평균과 편향량보다 높거나 빠른 EMA 평균 아래의 느린 EMA 평균을 통과합니다. 3) 현재 종결 가격은 SAR 값과 느린 EMA 평균과 편향량보다 높습니다.
공백 신호의 촉발 조건은 1) SAR가 어제의 종결 가격 위에 있고 현재 종결 가격 아래에 있다. 2) 현재 종결 가격이 느린 EMA 평균선 반도치 또는 빠른 EMA 평균선 위에 느린 EMA 평균선을 통과한다. 3) 현재 종결 가격이 SAR 값과 느린 EMA 평균선 반도치보다 낮다.
우위 분석
이 전략은 SAR 지표와 EMA 일선 필터링을 결합하여 트렌드 방향을 더 잘 식별하고 잘못된 신호를 줄일 수 있습니다.
장점은 다음과 같습니다.
- SAR 지표는 가격 변화에 빠르게 반응하여 트렌드 반전 지점을 식별할 수 있다.
- EMA 일선 필터는 트렌드 방향을 추가로 확인하고 SAR 지표가 단독으로 사용되는 경우 발생할 수있는 잘못된 신호를 방지합니다.
- 빠른 느린 EMA 평균선 교차를 보조 판단 조건으로 결합하여 신호 정확도를 향상시킬 수 있다.
- 매개 변수 조정으로 전략의 수익성을 높일 수 있다.
위험 분석
이 전략에는 다음과 같은 위험도 있습니다.
- 평형상황에서 SAR 지표와 EMA 평균선은 잘못된 신호를 발산할 수 있으며, 이로 인해 전략적 수익에 영향을 미칠 수 있다. 매개 변수 최적화를 통해 이 위험을 줄일 수 있다.
- EMA 평균선은 지연성이 있으며, 트렌드 반전의 최적의 입구 지점을 놓칠 수 있다. EMA 주기를 적절히 단축하여 지연성을 줄일 수 있다.
- 대폭적인 진동상태의 중지손실점은 쉽게 뚫려 전략에 큰 손실을 가져온다. 적절히 휴식손실범위를 완화할 수 있다.
최적화 방향
이 전략은 다음과 같은 부분에서 최적화될 수 있습니다.
- SAR 지표의 단계 길이를 최적화하고 최대 값 파라미터를 가격 변화에 더 민감하게 반응하도록 한다.
- 느린 EMA와 빠른 EMA의 주기 변수를 최적화하여 최적의 변수 조합을 찾습니다.
- EMA 편향량 파라미터를 최적화하여 잘못된 신호율을 줄인다.
- MACD, KDJ 등과 같은 다른 지표를 추가하여 신호의 정확성을 향상시킵니다.
- 단독 손실을 줄이기 위해 손해 중지 전략을 최적화하십시오.
요약하다
이 전략은 SAR 지표와 EMA 평행선의 장점을 종합적으로 활용하여 보다 유연한 트렌드 추적 전략을 설계했다. 전반적으로, 이 전략은 트렌드 방향을 성공적으로 식별하는 능력이 강하여 트렌드 추적에서 더 나은 효과를 얻을 수 있다. 매개 변수 최적화 및 위험 관리를 통해 전략의 안정성과 수익성을 더욱 강화할 수 있다. 이 전략은 위험 관리 인식과 매개 변수 최적화 능력을 갖춘 투자자에게 적합하다.
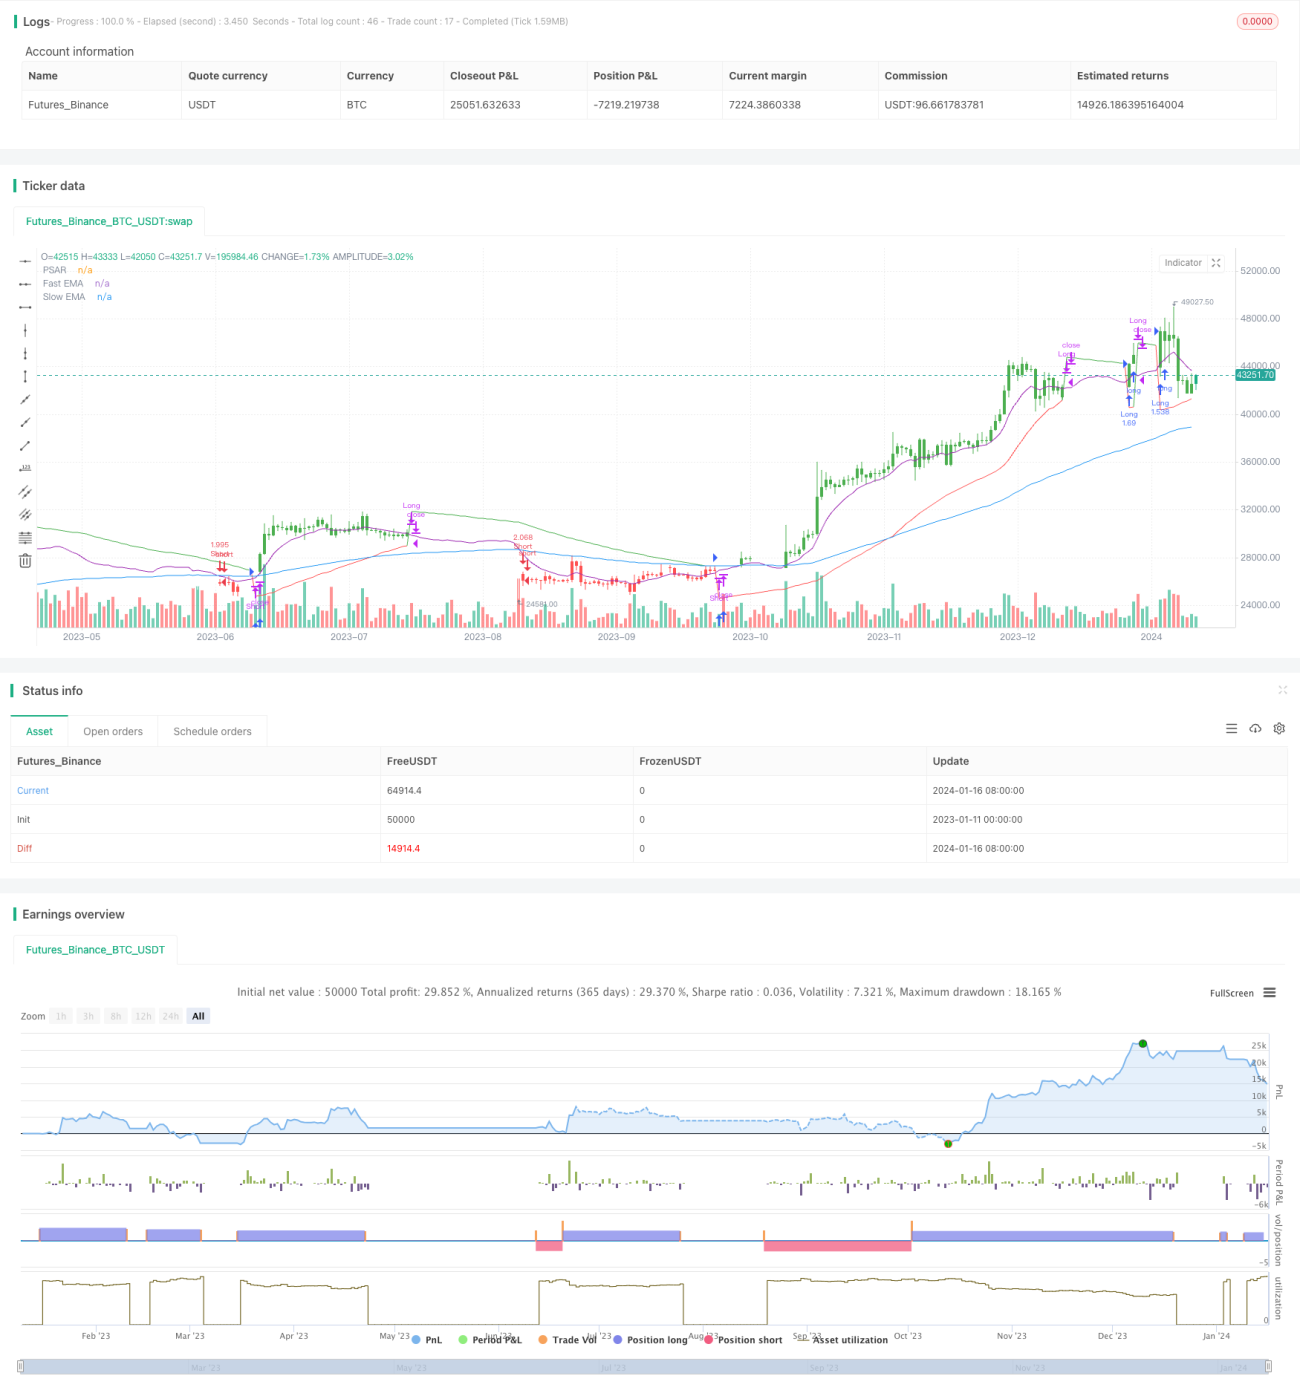
/*backtest
start: 2023-01-11 00:00:00
end: 2024-01-17 00:00:00
period: 1d
basePeriod: 1h
exchanges: [{"eid":"Futures_Binance","currency":"BTC_USDT"}]
*/

//@version=3
strategy("SAR Trend Trader Strategy By: jhanson107", shorttitle="SAR Trend Trader Strategy", overlay=true, default_qty_type=strategy.percent_of_equity, default_qty_value=100)
- 1