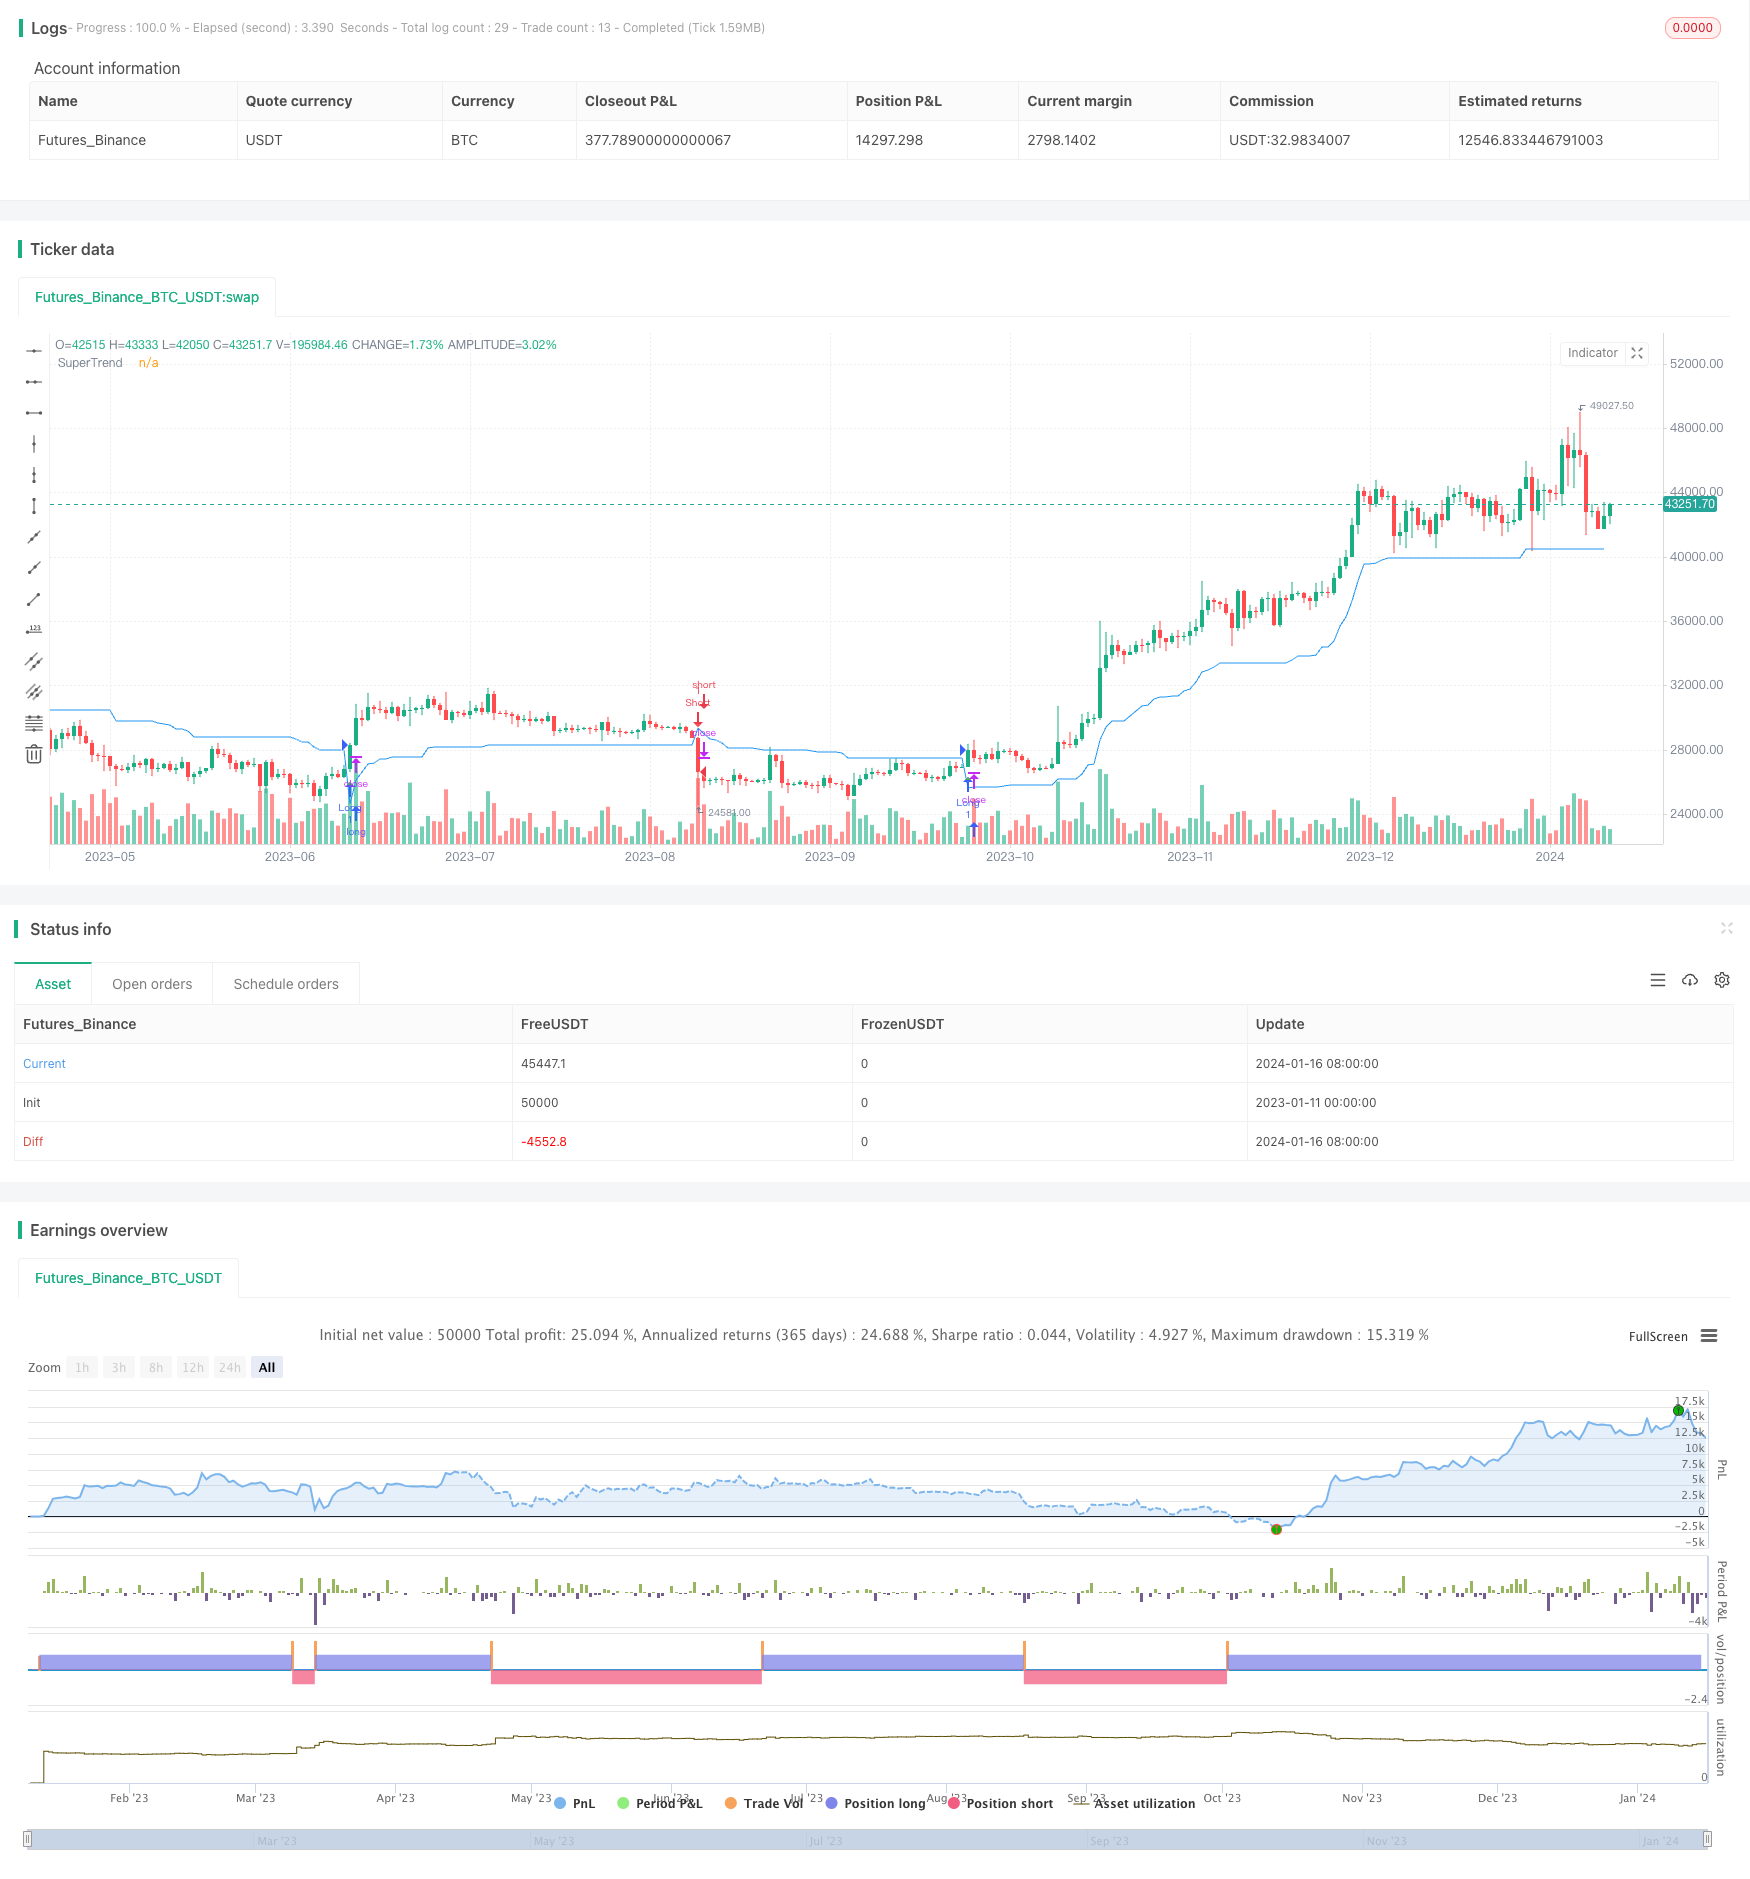
개요
이 전략은 평균 실제 파도 (Average True Range, ATR) 지표를 기반으로 초 트렌드 (SuperTrend) 채널을 구축하고, 가격의 초 트렌드 채널을 뚫고 구매 및 판매 신호를 생성한다. 이 전략은 트렌드 추적과 스톱 관리의 장점을 결합하여 트렌드 방향을 효과적으로 추적 할 수 있다.
전략 원칙
슈퍼 트렌드 채널의 상단 궤도와 하단 궤도는 다음과 같은 공식으로 계산된다:
오프 레일 = (최고 가격 + 최저 가격) / 2 + ATR (n) * 인수 하도 = (최고 가격 + 최소 가격) / 2 - ATR (n) * 인자
그 중, ATR(n) 은 n 일 동안의 평균 실제 진폭을 나타내며, 인자는 조정 가능한 변수이며, 기본적으로 3。이다.
종결 가격이 상반기보다 높을 때 보이스 신호, 종결 가격이 하반기보다 낮을 때 보이스 신호. 전략은 보이스 신호와 보이스 신호에 따라 입시와 출시를 결정한다.
우위 분석
- ATR 지표는 시장의 파동에 따라 채널 범위를 결정하여 트렌드를 효과적으로 추적할 수 있습니다.
- 통로 돌파구와 함께 시장 진입 시기를 판단하여 가짜 돌파구를 피하십시오.
- 변수 변수에 따라 채널 범위를 조정하여 다양한 변동률 시장에 맞게 조정할 수 있습니다
- 트렌드 추적과 손해 관리 통합의 장점
위험 분석
- 인수 파라미터를 잘못 설정하면 수익이 부족하거나 손실이 너무 많을 수 있습니다.
- 시장이 흔들릴 때, 초상향 채널에서 나오는 거래 신호가 자주 발생하여 과다 거래가 발생할 수 있습니다.
- ATR 주기 변수와 인수 변수의 매칭을 최적화해야 합니다.
위험 해결 방법:
- 다른 시장에 맞는 변수 조정 요소, 과도한 손실 위험을 낮추기
- 조건 필터링을 추가하여 흔들리는 시장에서 자주 거래되는 것을 방지합니다.
- 시장의 변동성, 포지션 보유 시간 등의 요소를 종합적으로 고려하여 ATR 주기와 일치합니다.
최적화 방향
- 다른 지표와 함께 필터링 신호를 사용하여 출전 시기를 최적화합니다.
- 더 많은 수익을 확보하기 위해 모바일 정지 추적을 추가합니다.
- 다양한 품종, 주기 파라미터 최적화
- ATR 주기 및 인수 매개 변수의 최적화
요약하다
이 전략은 초 트렌드 채널을 사용하여 트렌드 추적 및 손실 관리를 구현한다. ATR 주기 및 인자 파라미터의 매칭은 전략 효과에 매우 중요합니다. 다음 단계는 파라미터 최적화, 신호 필터링 등의 측면에서 전략을 더욱 최적화하여 더 복잡한 시장 환경에 적응할 수 있도록 할 것이다.
전략 소스 코드
/*backtest
start: 2023-01-11 00:00:00
end: 2024-01-17 00:00:00
period: 1d
basePeriod: 1h
exchanges: [{"eid":"Futures_Binance","currency":"BTC_USDT"}]
*/

//@version=5
strategy("Supertrend Backtest", shorttitle="STBT", overlay=true)

// Input for ATR Length
atrLength = input.int(10, title="ATR Length", minval=1)
atrFactor = input.float(3.0, title="Factor", minval=0.01, step=0.01)

// Calculate SuperTrend
[supertrend, direction] = ta.supertrend(atrFactor, atrLength)
supertrend := barstate.isfirst ? na : supertrend

// Define entry and exit conditions
longCondition = ta.crossover(close, supertrend)
shortCondition = ta.crossunder(close, supertrend)

// Plot the SuperTrend
plot(supertrend, color=color.new(color.blue, 0), title="SuperTrend")

// Plot Buy and Sell signals
plotshape(series=longCondition, style=shape.triangleup, location=location.belowbar, color=color.green, size=size.small, title="Buy Signal")
plotshape(series=shortCondition, style=shape.triangledown, location=location.abovebar, color=color.red, size=size.small, title="Sell Signal")

// Strategy Entry and Exit
strategy.entry("Long", strategy.long, when=longCondition)
strategy.entry("Short", strategy.short, when=shortCondition)