개요
이 전략은 퍼센티지 기반의 간단한 트래킹 스톱 로즈와 트래킹 바이드 포트폴리오를 구현한다. 다양한 시간 프레임과 다른 차트에서 다양한 퍼센티지 포트폴리오를 시험함으로써 전략 매개 변수를 최적화 할 수 있다.
전략 원칙
이 전략은 주로 두 가지 지표를 통해 트래킹 스톱 손실과 트래킹 구매를 구현합니다:
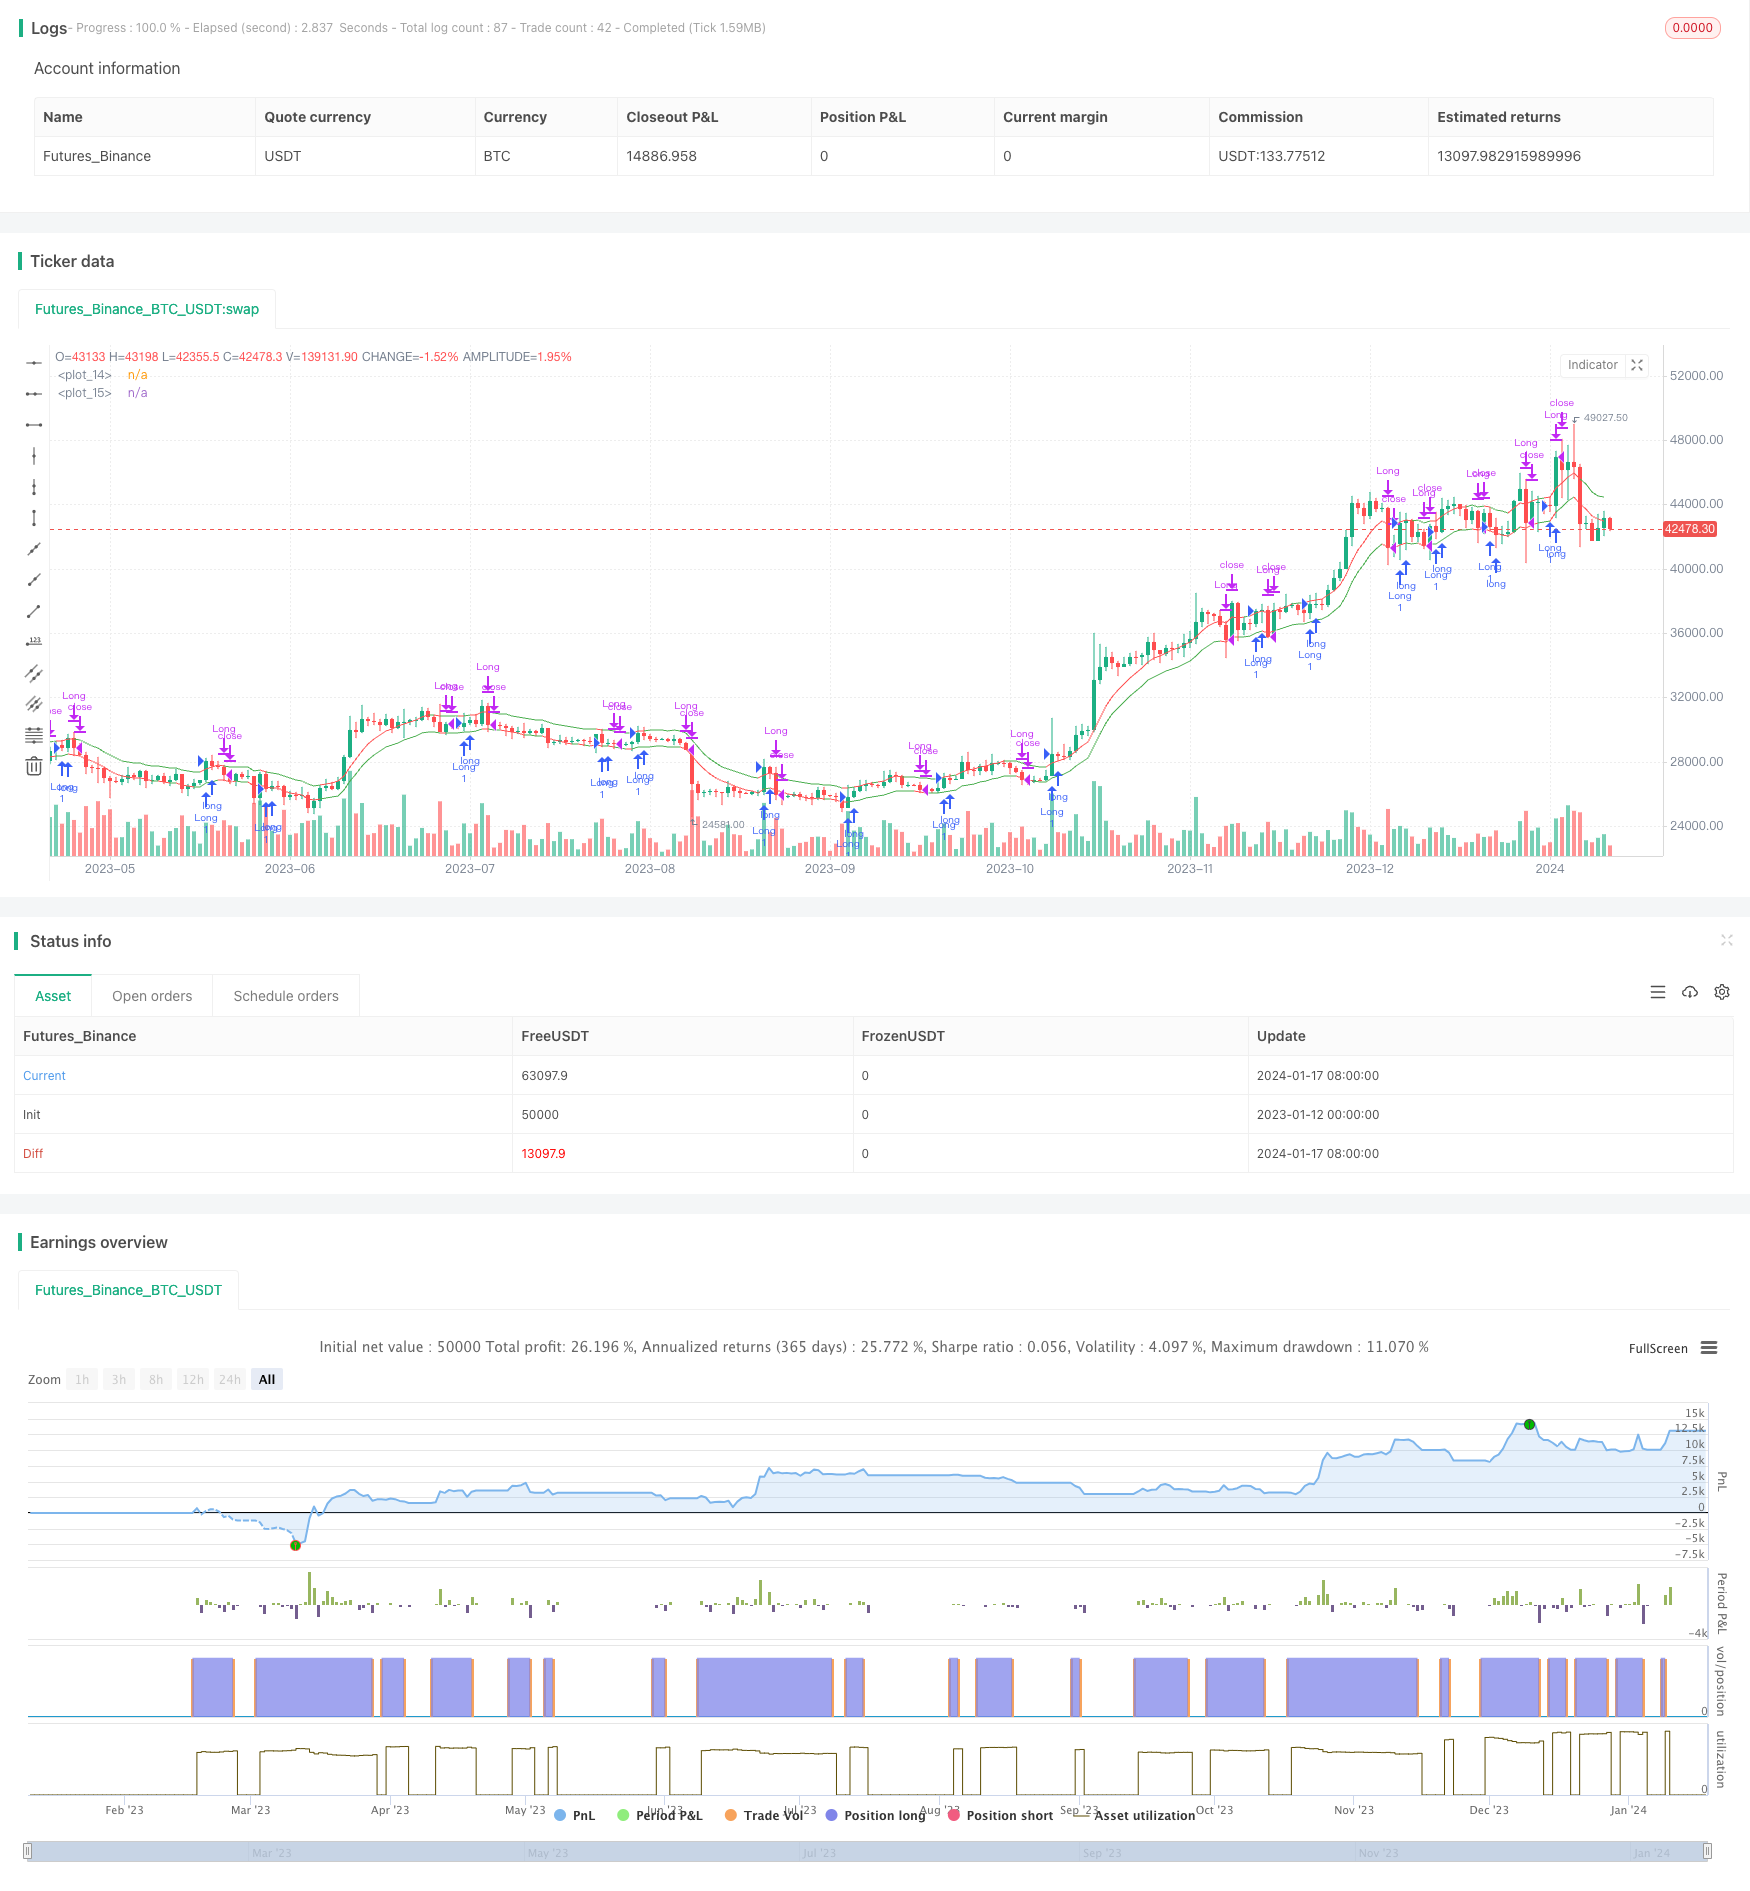
- 트레일링 스톱 라인 (Trailing Stop Line, TSL): 사용자가 설정한 스톱 편차 비율에 따라, 가장 최근의 N 루트 K 라인의 종결 가격의 이동 평균을 기반으로 계산된다. 가격이 이 라인보다 낮을 때, 매장 중지한다.
- 트레일링 바이 라인 (Trailing Buy Line, TBL): 사용자가 설정한 구매 편차 비율에 따라 가장 높은 가격의 N 루트 K 라인에 기반한 이동 평균을 계산한다. 가격이 이 라인보다 높을 때 다단위 포지션을 설정한다.
가격과 두 지표의 관계를 비교하여 스톱로스 및 인수 규칙을 구현합니다.
전략적 이점
이 전략은 다음과 같은 장점을 가지고 있습니다.
- 간단하고 직관적이고, 이해하기 쉽고, 실행하기 쉽습니다.
- 매출을 늘리는 데 도움이 될 것입니다.
- 다른 시장과 다른 시간대에 적용할 수 있습니다.
- 트렌드 추적, 시간적 상쇄.
전략적 위험
이 전략에는 다음과 같은 위험도 있습니다.
- 변수 설정이 잘못되면 너무 급진적인 정지 또는 차입이 발생할 수 있습니다.
- 이 경우, 거래의 빈번함과 흔들리는 시장에서의 점유율 손실이 발생할 수 있습니다.
- 다른 시장의 특성에 맞게 적절히 최적화 된 매개 변수가 필요합니다.
전략 최적화 방향
이 전략은 다음과 같은 부분에서 최적화될 수 있습니다.
- 적응형 알고리즘을 사용하여 자동으로 중지 위치 및 구매 매개 변수를 최적화합니다.
- 포지션 수와 리스크 관리 모듈을 늘립니다.
- 다른 지표들과 함께 큰 추세를 판단하여, 위기 상황 속에서 갇히지 않도록 한다.
요약하다
이 전략은 전체적으로 매우 단순하고 직관적인 트렌드 추적 전략이다. 매개 변수를 조정하여 다른 시장에 적용할 수 있으며, 자기 적응 알고리즘과 다른 지표와 결합하면 전략의 안정성과 실용성을 더욱 강화할 수 있다.
전략 소스 코드
/*backtest
start: 2023-01-12 00:00:00
end: 2024-01-18 00:00:00
period: 1d
basePeriod: 1h
exchanges: [{"eid":"Futures_Binance","currency":"BTC_USDT"}]
*/

//@version=2
//Developed from ©Finnbo code
strategy("Simple Trailing Buy & Stop Strategy", overlay=true)
offset = input(defval=1.5, title="Stop Offset %", type=float, minval=0.1, maxval=100, step=0.1)
buyoffset = input(defval=1.9, title="Trailing Buy Offset %", type=float, minval=0.1, maxval=100, step=0.1)

sumbars = input(defval=6, title="Use last x bars for calculation",  minval=1)
srcts = input(title="Source Trailing Stop calculation",  defval=close)
srctb = input(title="Source Trailing Buy calculation",  defval=close)
srctrigger = input(title="Source Stop Trigger",  defval=low)
srctriggerbuy = input(title="Source Buy Trigger",  defval=high)
tsl = rma(srcts, sumbars)*(1-(offset/100))// = (sum(srcts,sumbars)/sumbars)*(1-(offset/100))
tbuy = rma(srctb, sumbars)*(1+(buyoffset/100))
plot(tsl, color=(srctrigger<tsl)?red:green)
plot(tbuy, color=(srctriggerbuy>tbuy)?red:green)
//plotshape(crossunder(srctrigger,tsl), text="Long Stop", style=shape.circle, color=red)
alertcondition(crossunder(srctrigger,tsl), "Long Stop alert", "SELL")
//plotshape(crossover(srctriggerbuy,tbuy), text="Long", style=shape.circle, color=green)
alertcondition(crossover(srctriggerbuy,tbuy), "Long alert", "BUY")

longCondition =  crossover(srctriggerbuy,tbuy)
if (longCondition)
    strategy.entry("Long", strategy.long)
closeCondition = crossunder(srctrigger,tsl)
if (closeCondition)
    strategy.close("Long")