해조류 지표 기반 암호화폐 추세 추종 전략

개요
이 전략은 Seagull 지표를 기반으로 한 암호화폐 추세 추적 전략입니다. 두 개의 서로 다른 기간의 지수이동평균(EMA)과 Seagull 지표를 결합하여 여러 조건을 통해 거래 신호를 생성합니다. 이 전략은 중장기 가격 추세를 식별하고, 추세가 전환되는 시점에 적시에 진입하는 것을 목표로 합니다.
전략 원리
이 전략은 50주기 및 100주기 EMA를 사용합니다. 동시에 시장 노이즈를 필터링하는 특수 캔들 라인인 Seagull 라인을 계산합니다. 전략은 Seagull 라인의 시가, 종가, 고가, 저가를 사용하여 100주기 EMA에 적용함으로써 더 정확한 거래 신호를 발생시킵니다.
구체적으로, 100주기 Seagull 라인의 시가가 종가보다 높고, 이전 캔들의 시가가 종가보다 낮은 경우가 매수 신호입니다. 반대로, 100주기 Seagull 라인의 시가가 종가보다 낮고, 이전 캔들의 시가가 종가보다 높은 경우가 매도 신호입니다.
이 전략은 이중 EMA 시스템과 Seagull 지표를 결합하여 중장기 추세가 형성될 때 적시에 기회를 포착하는 것을 목표로 합니다. Seagull 지표를 사용하여 단기 시장 노이즈를 필터링함으로써 거래 신호를 더욱 신뢰할 수 있게 합니다.
전략 장점
- Seagull 지표를 사용하면 노이즈를 효과적으로 필터링하여 거래 신호를 더욱 명확하고 신뢰할 수 있게 함
- 다중 기간 EMA와 Seagull 지표의 결합으로 강한 중장기 추세 식별 가능
- 여러 조건을 결합한 판단으로 기회를 놓치는 것을 방지
- 이 전략은 특히 고변동성 암호화폐 시장에 적합
- 롱 전용 전략으로 구성 가능하여 운영 위험 감소
전략 위험
- 손절매가 너무 느슨하게 설정되어 손실 위험이 클 수 있음
- 변동성이 적은 횡보장에서는 무효 거래가 많이 발생할 수 있음
- Seagull 지표도 어느 정도 가격 지연이 있어 위험을 완전히 회피할 수 없음
- 추세 반전 지점을 판단할 수 없어 손실 확대 위험 존재
위험을 줄이기 위해 손절매 폭을 적절히 줄이거나 다른 지표를 결합하여 추세 반전을 판단할 수 있습니다. 시장이 횡보 구간에 진입하면 전략을 중단하고 새로운 추세를 기다리는 것도 좋습니다.
전략 최적화 방향
- EMA 매개변수 최적화, 최적의 매개변수 조합 찾기
- Seagull 지표 대신 KDJ, MACD 등 다른 지표 시도
- 가격 돌파를 진입 확인 조건으로 추가
- 변동성 지표를 결합하여 추세 반전 판단
- 머신러닝 방법을 사용하여 매개변수 동적 최적화
요약
Seagull 지표 기반의 암호화폐 추세 추적 전략은 추세 판단, 진입 시점, 손절매 통제 등 여러 측면을 종합적으로 고려하여 높은 변동성을 가진 암호화폐에 잘 적응합니다. 이 전략은 Seagull 지표를 사용하여 노이즈를 필터링하고, 견고한 위험 관리 방법을 통해 중장기 가격 추세에서 발생하는 거래 기회를 효과적으로 포착할 수 있습니다. 매개변수 설정, 지표 선택 및 위험 관리 방법을 추가로 최적화한다면 이 전략의 성능은 더욱 향상될 여지가 있습니다.
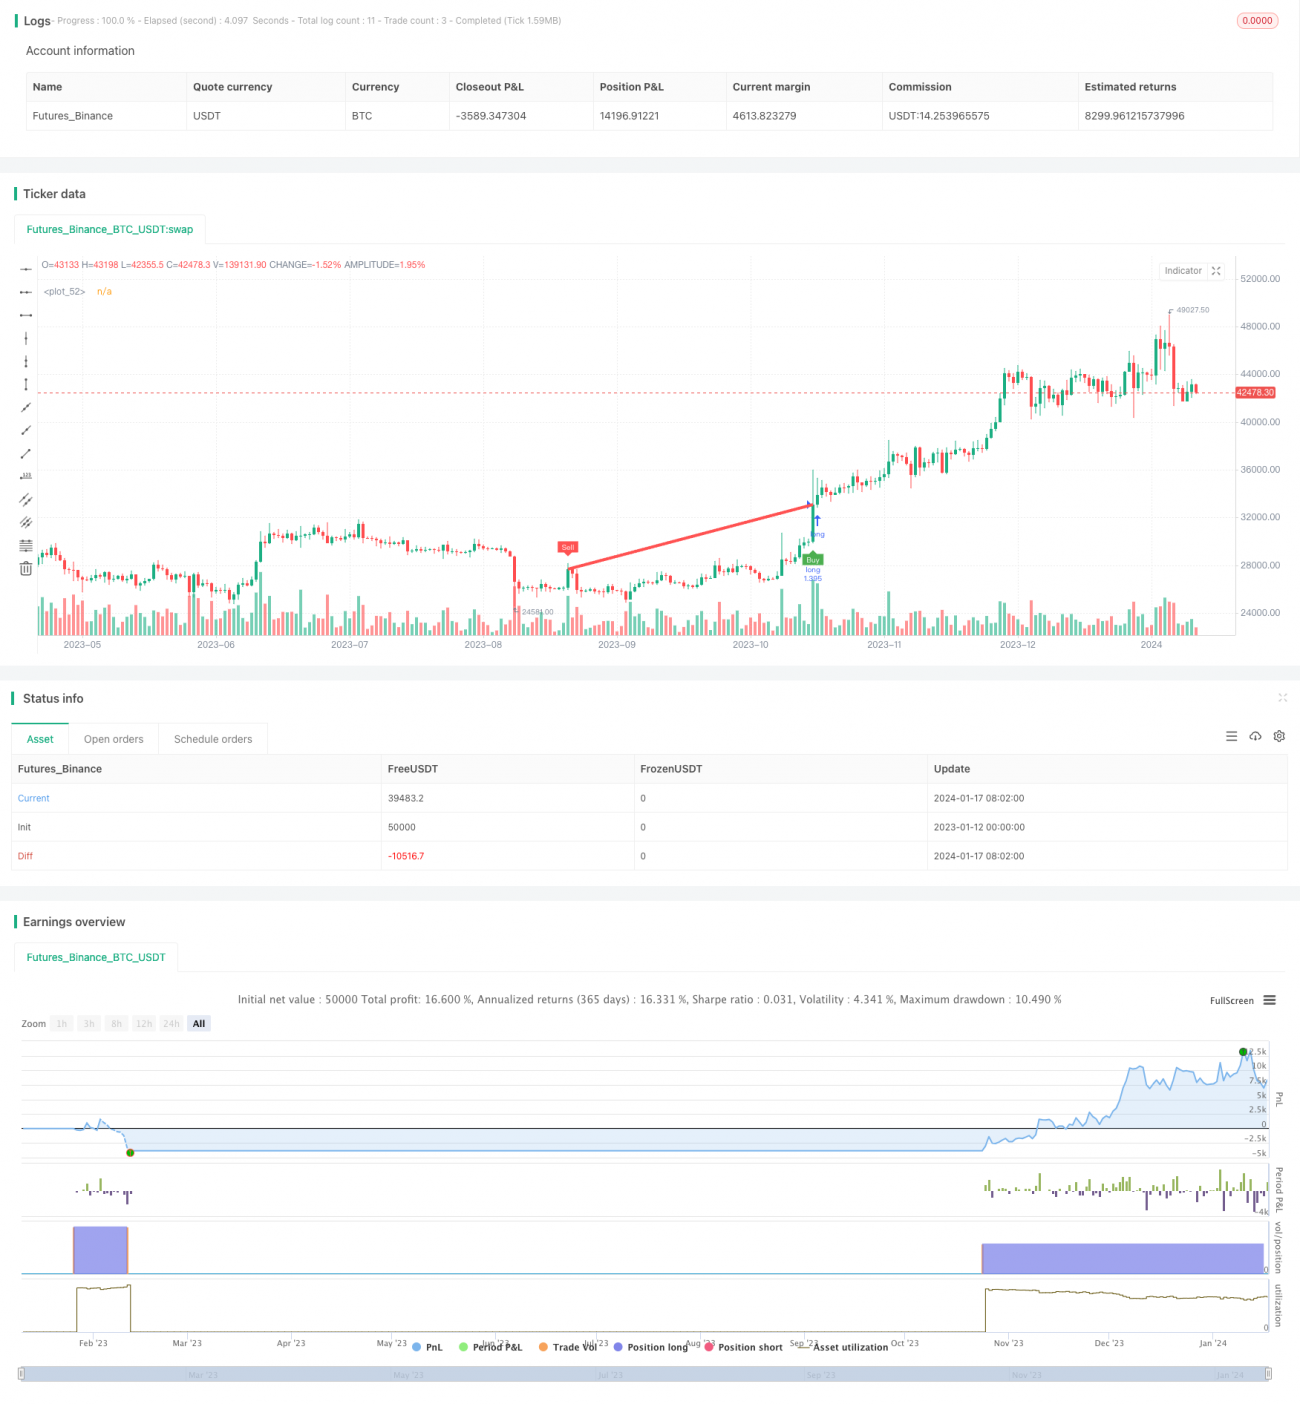
/*backtest
start: 2023-01-12 00:00:00
end: 2024-01-18 00:00:00
period: 1d
basePeriod: 1h
exchanges: [{"eid":"Futures_Binance","currency":"BTC_USDT"}]
*/

//@version=4
//@SoftKill21
strategy(title="CRYPTO HA Strategy", shorttitle="CRYPTO HA Strategy", overlay=true , default_qty_type =strategy.percent_of_equity, default_qty_value =100, commission_type= strategy.commission.percent,commission_value =0.1 )
- 1