개요
이 전략은 RSI (상대적으로 강한 지표) 를 기반으로 한 단선 거래 전략이다. RSI 지표를 사용하여 시장의 잠재적인 강한 약 상태를 식별하여 거래 결정을 보조한다.
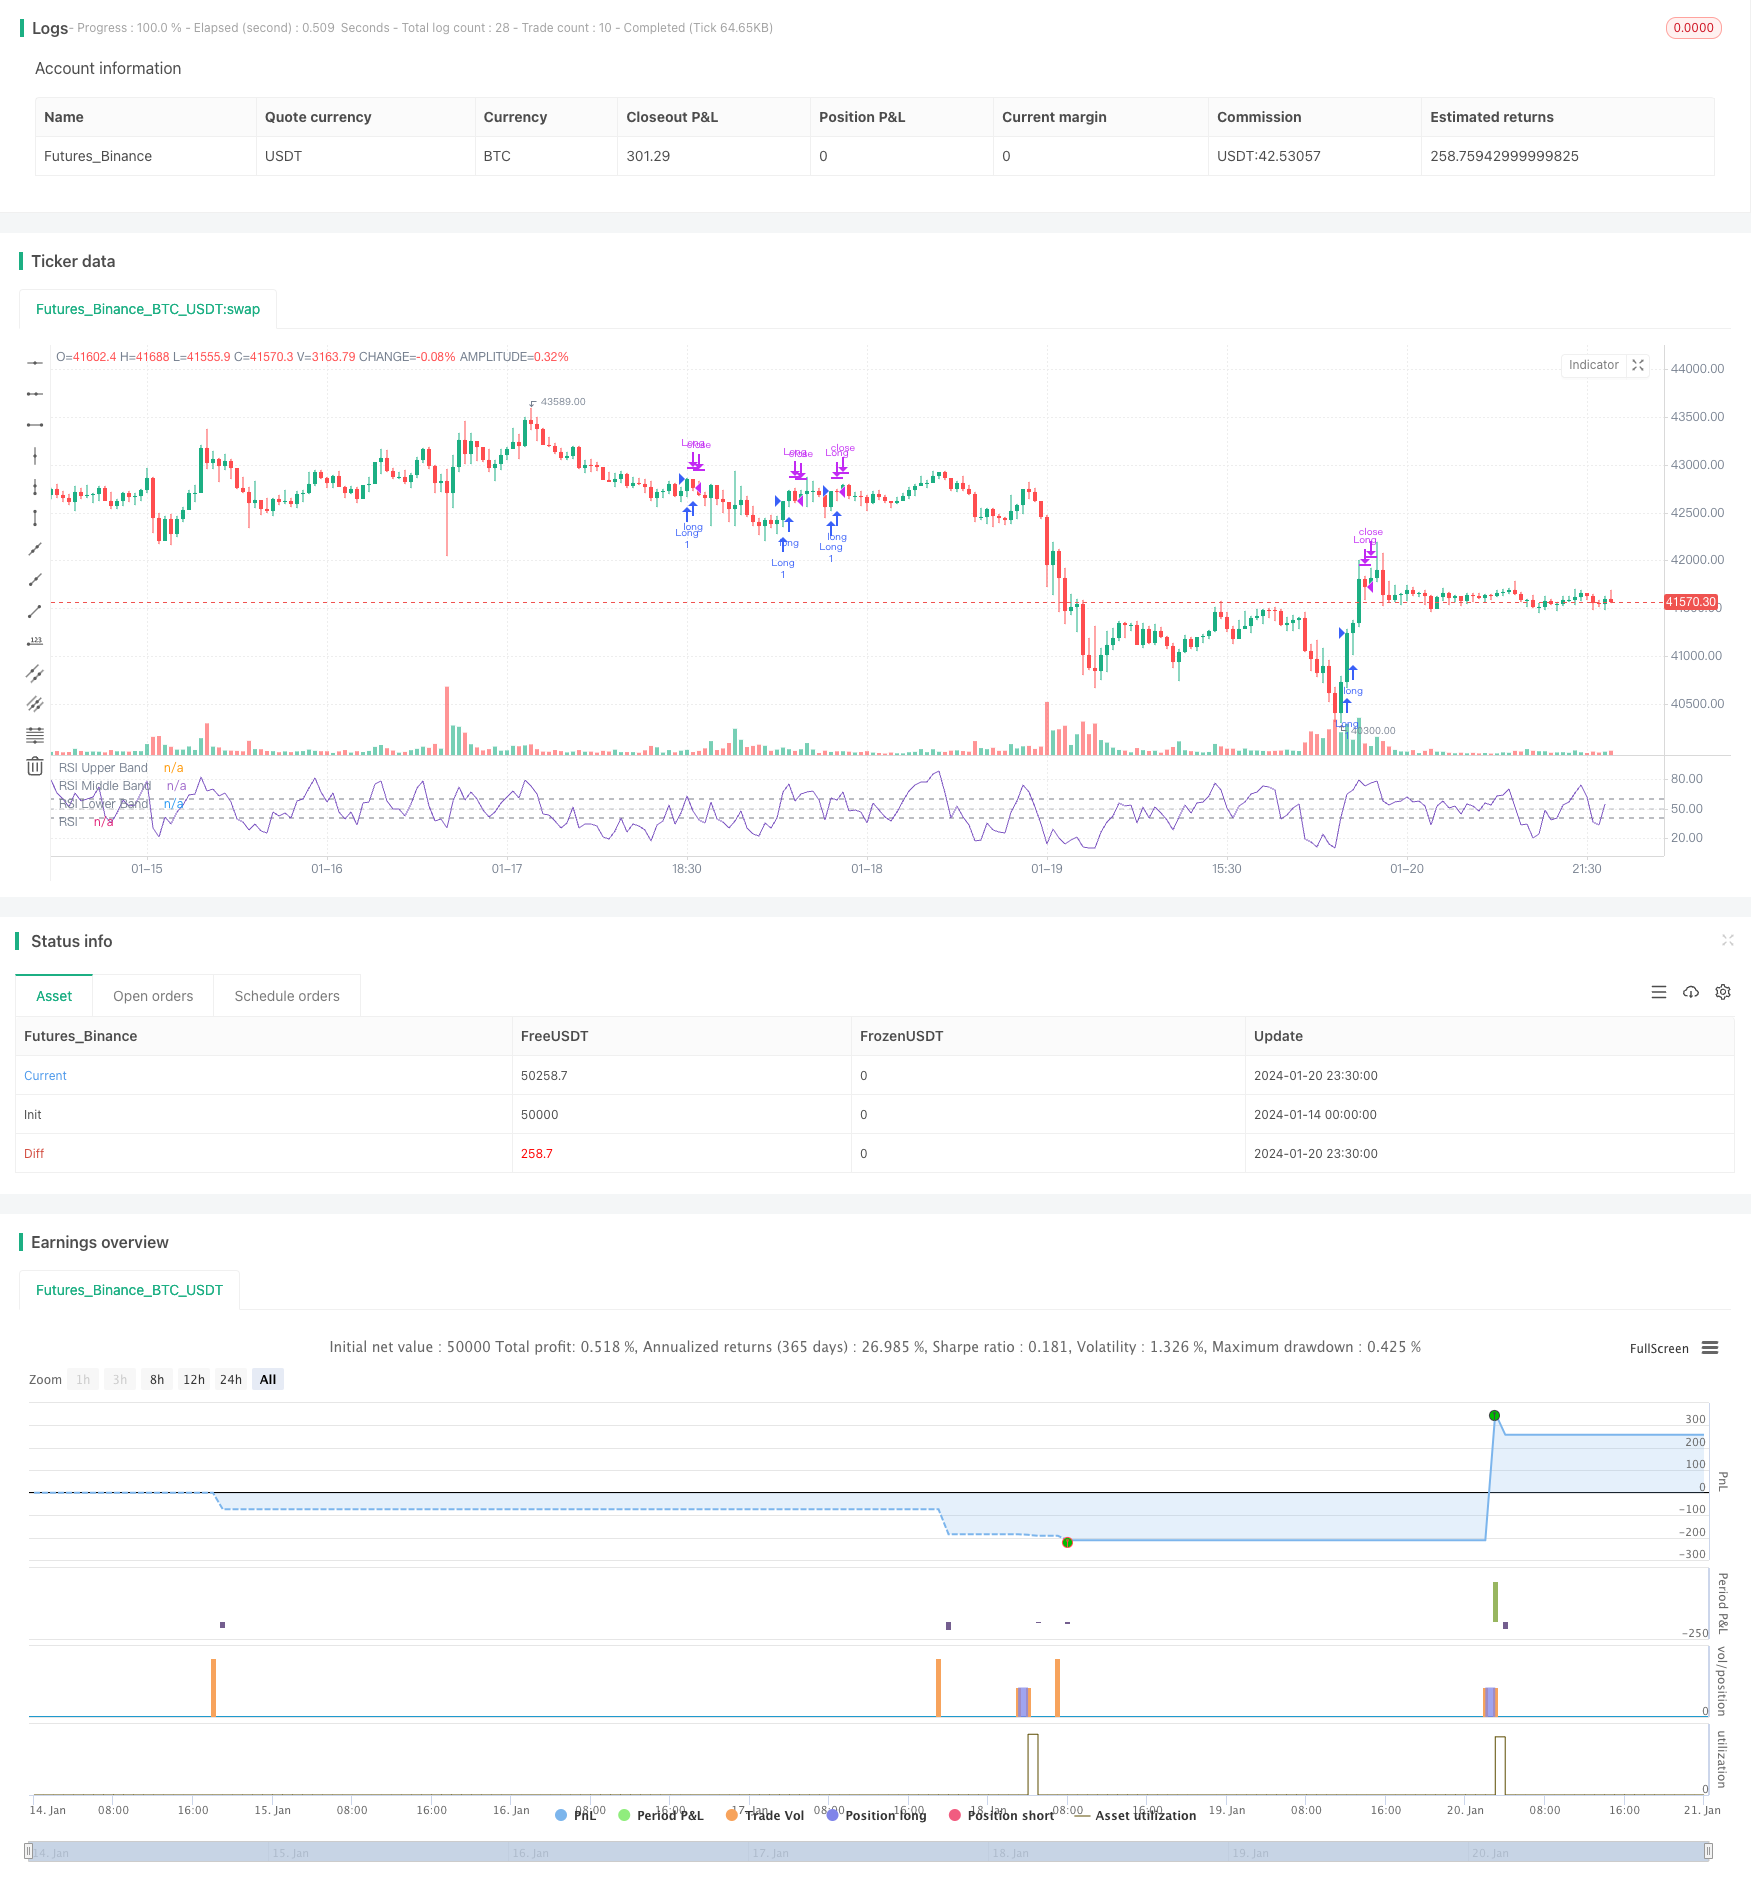
이 전략은 5주기 RSI 지표를 사용하여 단선 가격 움직임을 포착합니다. RSI 곡선의 높음과 낮음에 따라 입점과 종료 시기를 판단합니다.
전략 원칙
다단계 포지션에 들어가는 조건은: 이전 K선의 RSI 값이 50보다 낮고, 현재 K선의 RSI 값이 60보다 높다.
평정 포지션 조건은: RSI 곡선이 더 낮은 낮은 지점을 나타낼 때, 트렌드가 약해진 것을 나타냅니다. 이 시점에는 다수 상위 포지션을 평정합니다.
우위 분석
- RSI 지표를 사용하면 시장에서 가격의 전환점을 효과적으로 식별할 수 있다. RSI의 높은 낮은 점의 조합 턴트는 강력한 지시 작용을 한다.
- 5주기 RSI는 단선 가격의 급격한 변화를 포착하여 단선 거래에 적합합니다.
- 전략적 의사결정의 규칙은 명확하고 간단하며, 실행하기 쉽다.
위험 분석
- RSI 지표는 잘못된 신호로 인해 손실이 발생할 수 있습니다.
- 단선 운영은 거래 빈도와 슬라이드 포인트 비용을 증가시킬 수 있습니다.
- 실제 거래에는 RSI 주기의 수, 높은 낮은 시점의 경량 등과 같은 합리적인 조정 매개 변수가 필요합니다.
최적화 방법:
- 다른 지표의 필터링 신호와 결합하여 오류율을 줄인다. 예를 들어 MACD, KD 등이다.
- 제약이 너무 민감한 것을 피하기 위해 제약선을 적절하게 풀어주세요.
- RSI 변수를 조정하여 최적의 변수 조합을 찾습니다.
요약하다
이 전략은 RSI 지표의 하위점 반전 특성을 활용하여 명확한 다중 입점 및 중지 규칙을 설정합니다. 간단한 실용적인 거래 아이디어이지만 약간의 불안정성이 있습니다. 변수 최적화 및 지표 조합을 통해 전략의 안정성을 높일 수 있습니다.
전략 소스 코드
/*backtest
start: 2024-01-14 00:00:00
end: 2024-01-21 00:00:00
period: 30m
basePeriod: 15m
exchanges: [{"eid":"Futures_Binance","currency":"BTC_USDT"}]
*/

//@version=5
strategy("*RSI 5 - Long only- Daily charts & above*", overlay = false)

// Define inputs
rsi_length = input(5, "RSI Length")

// Calculate indicators
rsi = ta.rsi(close, rsi_length)

// Entry conditions
long = rsi[1] < 50 and rsi > 60

// Exit conditions
longExit = rsi < rsi[1]


// Execute trade with adjusted position size
if (long)
    strategy.entry("Long", strategy.long)


if  (longExit)
	strategy.close("LongExit")


// Close long position if long exit condition is met
if (longExit)
    strategy.close("Long", comment="Long exit")

rsiPlot = plot(rsi, "RSI", color=#7E57C2)
rsiUpperBand = hline(60, "RSI Upper Band", color=#787B86)
midline = hline(50, "RSI Middle Band", color=color.new(#787B86, 50))
rsiLowerBand = hline(40, "RSI Lower Band", color=#787B86)
fill(rsiUpperBand, rsiLowerBand, color=color.rgb(126, 87, 194, 90), title="RSI Background Fill")