개요
동력 흔들기 트렌드 추적 전략은 동력 지표, 흔들기 및 이동 평균을 동시에 사용하는 복합 전략입니다. 그것은 단계 2의 상승 추세와 단계 4의 하락 추세를 식별하는 데 노력하고 있으며, 두 단계에서 정확한 상장 및 상장 신호를 생성합니다. 이 전략은 시장 주기 이론을 최대한 활용하여 가장 수익성이있는 시장 단계에서만 입장을 취하고 입장을 구축합니다. 동시에 동력 분석, 추세 판단 및 변동률 평가와 같은 여러 가지 기술 지표를 통합하여 현대 고속 거래 환경에 적합한 포괄적이고 효율적인 의사 결정 프레임 워크를 형성합니다.
전략 원칙
신호 생성 및 트렌드 판단
이 전략의 신호는 주로 3대 기술 지표의 통합 판단에서 비롯된다. 강화된 버전의 동력 RSI, EMA 평균선 교차, 그리고 ATR의 실제 변동 범위이다. 구체적으로, 전략은 단기 EMA에서 장기 EMA를 통과할 때 상승 추세로 간주하여 다중 신호를 형성한다. 단기 EMA 아래에서 장기 EMA를 통과하면 하향 추세로 안내하여 공백 신호를 생성한다.
분단 신호 생성
이 전략의 특이한 점은, 이 전략은 황소 시장의 스테이지 2와 곰 시장의 스테이지 4 두 단계에서만 신호를 생성한다는 것입니다. 즉, 이것은 상승 추세가 가장 강하고 하향 추세가 가장 명확한 시기에만 포지션을 만듭니다. 이 방법은 불확실한 통합 및 분산 단계의 위험을 최소화하고, 수익률을 매우 높일 수 있습니다.
전체적인 의사결정 과정
요약하면, 이 전략의 의사 결정 논리는 다음과 같이 요약 될 수 있습니다. 단계적 추세를 확인하기 (단계 2 또는 단계 4) 운동량 RSI의 다공간 의도를 결정하기 (동적) EMA 평행선의 방향을 판단하기 (동적) ATR과 함께 적절한 스톱을 설정하고 모든 조건이 충족되면 입장을 열기. 이 일련의 프로세스는 명확하고 효율적입니다.
전략적 이점
시장주기를 이용해서 승률을 높여라
이 전략의 가장 큰 장점은 시장의 주기적 특성을 깊이 이해하는 데 있습니다. 가장 밝은 상승과 하락 단계에서만 거래함으로써 많은 불확실한 소음을 필터링하여 80% 이상의 성공 가능성을 높일 수 있습니다.
다중 지표 필터링으로 가짜 신호를 줄인다.
이 전략은 동력, 경향, 변동율과 같은 여러 지표를 사용하여 교차 검증을 수행한다. 이것은 어떤 단일 지표가 생성 할 수있는 잘못된 신호를 피하여 전략의 전반적인 안정성과 신뢰성을 크게 향상시킵니다.
파라미터가 풍부하고 고도로 사용자 정의 가능합니다.
이 전략은 매우 풍부한 조정 가능한 매개 변수를 제공하며, 사용자는 개인 스타일과 시장 환경에 따라 많은 사용자 정의를 할 수 있으며, 전략을 최고 수준으로 최적화하여 전략의 적응력을 향상시킵니다.
위험과 해결책
시장의 객관적 위험
어떤 양적 전략도 시장 자체의 위험을 완전히 피할 수 없습니다. 예를 들어, 예측할 수 없는 주요 블랙 스 사건. 그러나 이것은 시장의 객관적인 위험에 속하며, 전략 자체의 문제가 아니며, 상인이 정신을 차리고, 입지를 합리적으로 제어하고, 레버리지를 사용해야합니다.
매개변수 최적화 위험
전략의 매개 변수가 자유롭게 조정될 수 있기 때문에, 부적절한 조정으로 인해 과조합 현상이 발생할 수 있다. 이것은 엄격한 회귀를 통해 예방할 필요가 있으며, 어떤 매개 변수 조정도 충분히 검증되어 더 넓은 시장 상황에 적응할 수 있으며, 특정 역사적 상황에 국한되는 것을 피한다.
최적화 방향
포지션 수 관리 기능 추가
현재 전략은 고정 금액으로 포지션을 구축하는데, 이는 큰 트렌드 상황에서 포지션이 너무 가벼워질 수 있다. 따라서, 최적화 가능한 방향은 포지션 관리 모듈을 추가하는 것이며, 트렌드가 충분히 명확할 때, 포지션을 단계적으로 확대하여 큰 트렌드 상황에서 더 뛰어난 효과를 얻을 수 있다.
기계 학습과 함께 신호를 필터링합니다.
이 전략은 기계학습과 결합하여 신호 품질을 평가하고 품질이 낮은 신호를 필터링하는 훈련된 모델을 구축하여 전략 전반의 성능을 더욱 향상시킬 수 있습니다. 이것은 전략 최적화의 중요한 방향입니다.
요약하다
동력 진동기 트렌드 추적 전략은 고도로 지능화되고 파라미터화 된 전략이다. 시장의 주기 법칙을 성공적으로 활용하여 신호 품질을 향상시키고, 다중 지표 교차 검증 방식을 사용하여 높은 신뢰도 출시 신호를 생성한다. 동시에, 풍부한 조정 가능한 파라미터는 사용자에게 큰 유연성을 제공한다. 종합적으로 언급하면, 신뢰할 만한 고도의 복합 전략이다.
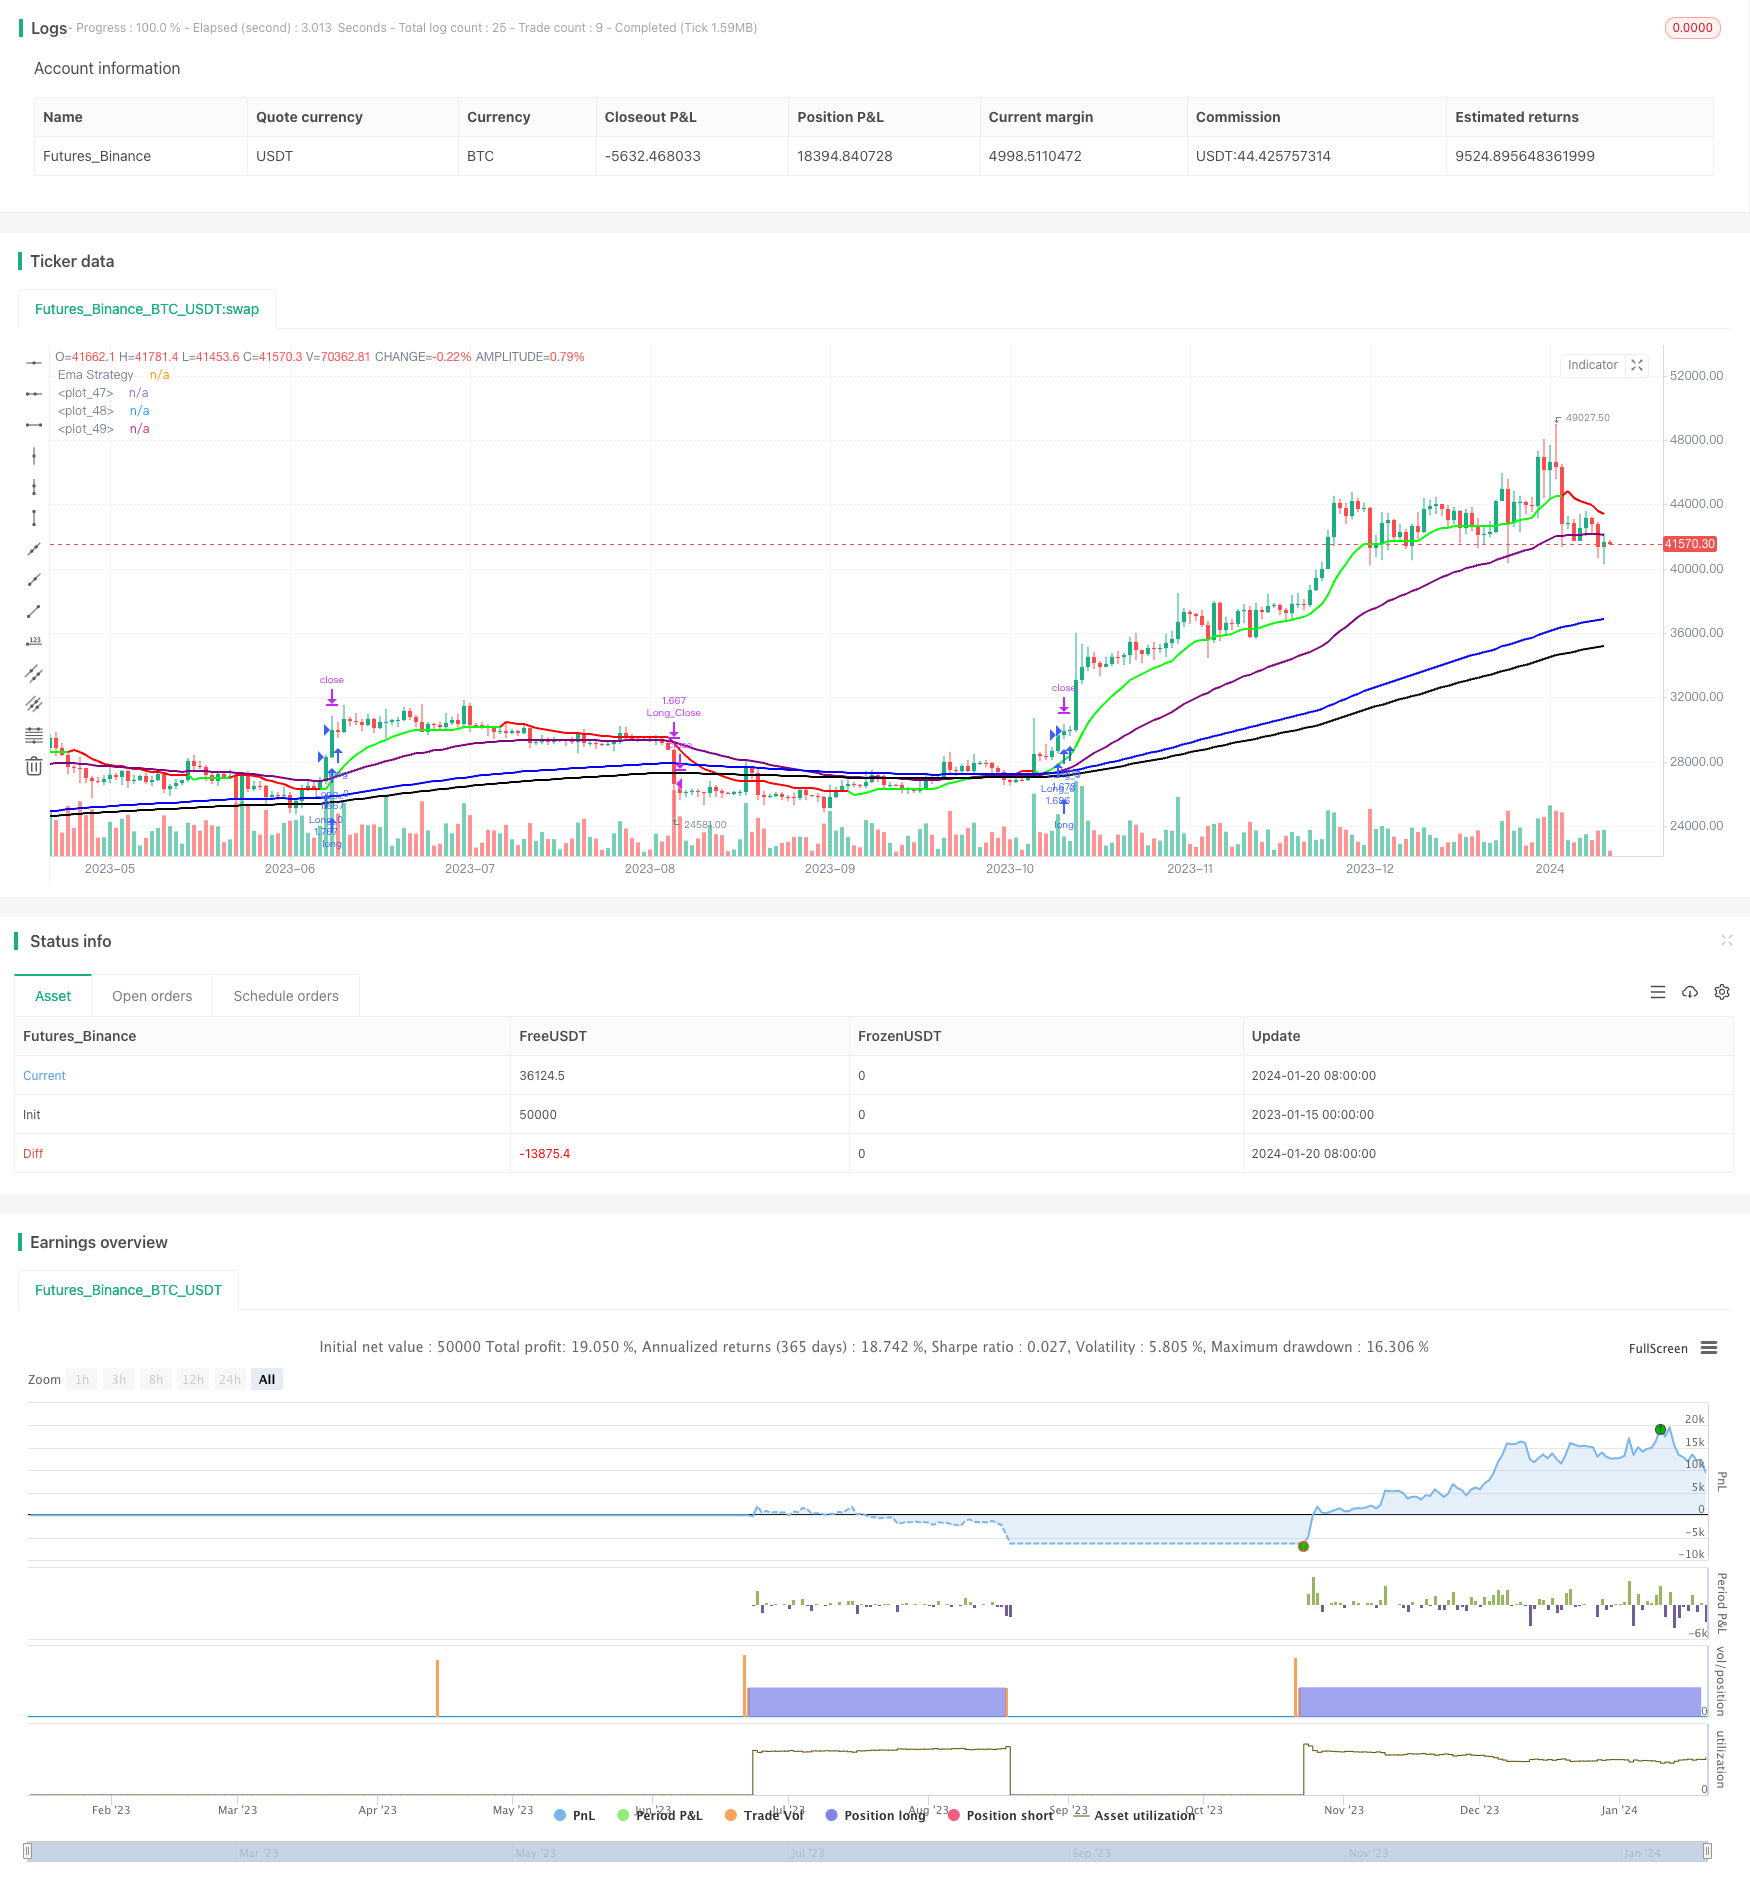
/*backtest
start: 2023-01-15 00:00:00
end: 2024-01-21 00:00:00
period: 1d
basePeriod: 1h
exchanges: [{"eid":"Futures_Binance","currency":"BTC_USDT"}]
*/

// This Pine Script™ code is subject to the terms of the Mozilla Public License 2.0 at https://mozilla.org/MPL/2.0/
// © JS_TechTrading

//@version=5
strategy('The Flash-Strategy (Momentum-RSI, EMA-crossover, ATR)', shorttitle='The Flash-Strategy (Momentum-RSI, EMA-crossover, ATR)', overlay=true,initial_capital = 1000)
//// author -  JS-TechTrading

// MOM Rsi indicator
group_mom_rsi = "Rsi Of Momentum "
len = input.int(10, minval=1, title="Length Mom-Rsi", group =group_mom_rsi ,tooltip = 'This ind calculate Rsi value of Momentum we use this ind to determine power of trend')
src2 = close
mom = src2 - src2[len]
rsi_mom = ta.rsi(mom, len)
mom_rsi_val = input.int(60, minval=1, title="Mom-Rsi Limit Val", group =group_mom_rsi, tooltip = "When our Mom-Rsi value more then this we open LONG or Short, with help of this indicator we we determine the status of the trend")

// Super Trend Ind
group_supertrend = "SuperTrend indicator"
atrPeriod = input(10, "ATR Length SuperTrend", group = group_supertrend)
factor = input.float(3.0, "Factor SuperTrend", step = 0.01, group = group_supertrend)

[supertrend, direction] = ta.supertrend(factor, atrPeriod)

// Ema Indicator
group_most = "Ema indicator"
src = input(close, 'Source Ema Ind',group = group_most)
AP2 = input.int(defval=12, title='Length Ema Ind', minval=1,group = group_most)
Trail1 = ta.ema(src, AP2) //Ema func
AF2 = input.float(defval=1, title='Percent Ema Ind', minval=0.1,group = group_most) / 100
SL2 = Trail1 * AF2  // Stoploss Ema
Trail2 = 0.0
iff_1 = Trail1 > nz(Trail2[1], 0) ? Trail1 - SL2 : Trail1 + SL2
iff_2 = Trail1 < nz(Trail2[1], 0) and Trail1[1] < nz(Trail2[1], 0) ? math.min(nz(Trail2[1], 0), Trail1 + SL2) : iff_1
Trail2 := Trail1 > nz(Trail2[1], 0) and Trail1[1] > nz(Trail2[1], 0) ? math.max(nz(Trail2[1], 0), Trail1 - SL2) : iff_2

//EMA50/150/200
group_50_150_200="EMA50/150/200"
show_emas=input.bool(defval = true, title = "SHOW EMAS", group = group_50_150_200)
ema50= ta.ema(src, 50)
ema150 = ta.ema(src, 150)
ema200 = ta.ema(src, 200)
ema50_color=input.color(defval = color.purple, title = "EMA50 COLOR",group = group_50_150_200)
ema50_linewidth=input.int(defval = 2, title = "EMA50 LINEWIDTH", group = group_50_150_200)
ema150_color=input.color(defval = color.blue, title = "EMA150 COLOR", group = group_50_150_200)
ema150_linewidth=input.int(defval = 2, title = "EMA150 LINEWIDTH", group = group_50_150_200)
ema200_color=input.color(defval = color.black, title = "EMA200 COLOR", group = group_50_150_200)
ema200_linewidth=input.int(defval = 2, title = "EMA200 LINEWIDTH", group = group_50_150_200)
plot(show_emas ? ema50 : na, color = ema50_color, linewidth = ema50_linewidth)
plot(show_emas ? ema150 : na, color=ema150_color, linewidth = ema150_linewidth)
plot(show_emas ? ema200 : na, color = ema200_color, linewidth = ema200_linewidth)

//Bull = ta.barssince(Trail1 > Trail2 and close > Trail2 and low > Trail2) < ta.barssince(Trail2 > Trail1 and close < Trail2 and high < Trail2)

//TS1 = plot(Trail1, 'ExMov', style=plot.style_line, color=Trail1 > Trail2 ? color.rgb(33, 149, 243, 100) : color.rgb(255, 235, 59, 100), linewidth=2)
//TS2 = plot(Trail2, 'ema', style=plot.style_line, color=Trail1 > Trail2 ? color.rgb(76, 175, 79, 30) : color.rgb(255, 82, 82, 30), linewidth=2)
//fill(TS1, TS2, Bull  ? color.green : color.red, transp=90)


// Strategy Sett
group_strategy = "Settings of Strategy"
Start_Time = input(defval=timestamp('01 January 2000 13:30 +0000'), title='Start Time of BackTest', group =group_strategy)
End_Time = input(defval=timestamp('30 April 2030 19:30 +0000'), title='End Time of BackTest', group =group_strategy)
dollar = input.float(title='Dollar Cost Per Position* ', defval=50000, group =group_strategy)
trade_direction = input.string(title='Trade_direction', group =group_strategy, options=['LONG', 'SHORT', 'BOTH'], defval='BOTH')
v1 = input(true, title="Version 1 - Uses SL/TP Dynamically ", group =group_strategy ,tooltip = 'With this settings our stoploss price increase or decrease with price to get better PNL score')

v2 = input(false, title="Version 2 -  Uses SL/TP Statically", group =group_strategy)
v2stoploss_input = input.float(5, title='Static Stop.Loss % Val', minval=0.01, group =group_strategy)/100
v2takeprofit_input = input.float(10, title='Static Take.Prof % Val', minval=0.01, group =group_strategy)/100

v2stoploss_level_long = strategy.position_avg_price * (1 - v2stoploss_input)
v2takeprofit_level_long = strategy.position_avg_price * (1 + v2takeprofit_input)

v2stoploss_level_short = strategy.position_avg_price * (1 + v2stoploss_input)
v2takeprofit_level_short = strategy.position_avg_price * (1 - v2takeprofit_input)

group_line = "Line Settings"
show_sl_tp = input.bool(title='  Show StopLoss - TakeProf Lines',inline = "1", defval=true, group =group_line)
show_trend_line = input.bool(title='  Show Trend Line',inline = '3' ,defval=true, group =group_line)
stoploss_colour = input.color(title='StopLoss Line Colour',inline = '2' ,defval=color.rgb(255, 255, 0), group =group_line)
up_trend_line_colour = input.color(title='Up Trend line Colour',inline = '4' ,defval=color.rgb(0, 255, 0, 30), group =group_line)
down_trend_line_colour = input.color(title='Down Trend line Colour',inline = '4' ,defval=color.rgb(255, 0, 0, 30), group =group_line)

//plot(supertrend ,color = strategy.position_size > 0 and show_sl_tp ? color.rgb(255, 0, 0) :show_sl_tp ? color.rgb(0, 255, 0) : na , style = plot.style_steplinebr,linewidth = 2)
// plot(supertrend ,color = show_sl_tp and v1 ? stoploss_colour : na , style = plot.style_steplinebr,linewidth = 2)

// plot(v2stoploss_level_long ,color = strategy.position_size > 0 and show_sl_tp and v2 ? stoploss_colour : na , style = plot.style_steplinebr,linewidth = 2)
// plot(v2stoploss_level_short ,color = strategy.position_size < 0 and show_sl_tp and v2 ? stoploss_colour : na , style = plot.style_steplinebr,linewidth = 2)
// plot(v2takeprofit_level_long  ,color = strategy.position_size > 0 and show_sl_tp and v2 ? up_trend_line_colour : na , style = plot.style_steplinebr,linewidth = 2)
// plot(v2takeprofit_level_short ,color = strategy.position_size < 0 and show_sl_tp and v2 ? up_trend_line_colour : na , style = plot.style_steplinebr,linewidth = 2)


TS2 = plot(Trail2, 'Ema Strategy', style=plot.style_line, color=show_trend_line and Trail1 < Trail2 ? down_trend_line_colour : show_trend_line ? up_trend_line_colour  : na, linewidth=2)

// bgcolor(buy_signal ? color.rgb(0, 230, 119, 80) : na)
// bgcolor(sell_signal ? color.rgb(255, 82, 82, 80) : na)

Time_interval = true
buy_signal = Trail1 > Trail2 and direction < 0 and rsi_mom > mom_rsi_val and Time_interval
sell_signal =Trail1 < Trail2 and direction > 0 and rsi_mom > mom_rsi_val and Time_interval


// Strategy entries
stop_long = (close < supertrend and v1) or (v2 and strategy.position_size > 0)
stop_short = (close > supertrend and v1) or (v2 and strategy.position_size < 0)
long_cond = ((close > ema150 ) and (ema50 > ema150) and (ema150 > ema200))
short_cond = ((close < ema150) and (ema50 < ema150) and (ema150 < ema200))
if (not stop_long) and (not short_cond) and long_cond and strategy.opentrades == 0 and (trade_direction == 'LONG' or trade_direction == 'BOTH') and buy_signal
    strategy.entry('Long_0', strategy.long, qty=dollar / close)

if (not stop_short) and (not long_cond) and short_cond and strategy.opentrades == 0 and (trade_direction == 'SHORT' or trade_direction == 'BOTH') and sell_signal
    strategy.entry('Short_0', strategy.short, qty=dollar / close)


if close < supertrend and v1
    strategy.exit('Long_Close',from_entry = "Long_0", stop=supertrend, qty_percent=100)
if  v2 and strategy.position_size > 0
    strategy.exit('Long_Close',from_entry = "Long_0", stop=v2stoploss_level_long,limit= v2takeprofit_level_long  , qty_percent=100)

if close > supertrend and v1
    strategy.exit('Short_Close',from_entry = "Short_0", stop=supertrend, qty_percent=100)
if  v2 and strategy.position_size < 0
    strategy.exit('Short_Close',from_entry = "Short_0", stop=v2stoploss_level_short,limit= v2takeprofit_level_short ,qty_percent=100)