개요
이 전략은 상대적으로 강하고 약한 지수 ((RSI) 와 부린 밴드 두 지표를 결합하여, 쌍방 확인의 포지션 개시 및 포지션 논리를 구현한다. RSI와 부린 밴드가 동시에 과매 또는 과매 신호를 표시할 때만 거래 신호를 발산한다. 이것은 가짜 신호를 효과적으로 줄이고 전략의 안정성을 높일 수 있다.
전략 원칙
- RSI 지표 판단 논리
- RSI가 45을 넘으면 과매매 신호입니다.
- RSI 아래 55을 넘으면 과매매 신호입니다.
- 브린은 논리적으로 판단합니다.
- 가격 상승과 하락은 과매매로 간주됩니다.
- 가격 하락으로 브린을 탈 때 과대 구매로 간주됩니다.
- 이중 확인 논리
- RSI와 브린이 오버셀 신호를 동시에 표시할 때만 오버 포지션을 열 수 있습니다.
- RSI와 브린이 오버 바이 신호를 동시에 표시할 때만 포지션을 열 수 있습니다.
이 논리들은 안정적인 쌍중확인된 평점점 전략을 구현한다.
우위 분석
이중 확인 메커니즘은 많은 잡음 거래를 필터링하여 불필요한 거래 수를 방지하여 거래 비용을 절감하고 수익률을 높일 수 있습니다.
RSI 지표는 동향과 반향을 효과적으로 식별할 수 있고, 브린 밴드 지표는 지지 저항을 효과적으로 판단할 수 있다. 이 둘은 결합되어 완벽한 조합을 형성한다.
매개 변수 설정은 다양한 품종과 거래 선호도에 따라 조정할 수 있는 유연하며, 적응력이 강하다.
위험 분석
불안정한 상황에서는 RSI와 브린 벨트 지표가 동시에 잘못된 신호를 발산하여 불필요한 손실을 초래할 수 있습니다. 변수를 최적화하여 잘못된 판단 가능성을 줄일 수 있습니다.
이중 확인 메커니즘은 입시 지연을 약간 증가시킬 수 있으며, 매우 짧은 라인의 거래 기회를 놓칠 수 있습니다. 지연에 매우 민감한 전략에는 적합하지 않습니다.
이 전략은 변수에 매우 민감하며, 부적절한 변수 설정은 수익률을 크게 떨어뜨릴 수 있다. 최적의 변수 조합을 찾기 위해 충분한 회귀 및 회귀가 필요합니다.
최적화 방향
다양한 주기 RSI 지표를 테스트하여 가장 적합한 주기 변수를 찾아서 지표의 효과를 향상시킬 수 있습니다.
스톱 로직을 추가하여 합리적인 이동 스톱 또는 고정 스톱을 설정하여 단독 손실 위험을 제어 할 수 있습니다.
브린 띠 통로 너비 파라미터를 테스트하여 통로 범위를 최적화하고 브린 띠의 식별 효과를 향상시킬 수 있다.
다양한 가격 입력을 테스트할 수 있습니다. 예를 들어, 종식 가격, 최고 가격, 최저 가격 등과 같이, 최적의 가격 입력을 찾고 전략의 안정성을 높일 수 있습니다.
요약하다
이 전략은 RSI와 브린 밴드 지표를 성공적으로 결합하여 두 가지 확인 논리를 구현하여 충분한 거래 기회를 보장하고 노이즈 거래를 효과적으로 줄일 수 있습니다. 합리적인 매개 변수 최적화 및 위험 통제를 통해 이 전략은 매우 안정적이고 신뢰할 수있는 트렌드 추적 및 거래 전략이 될 수 있습니다.
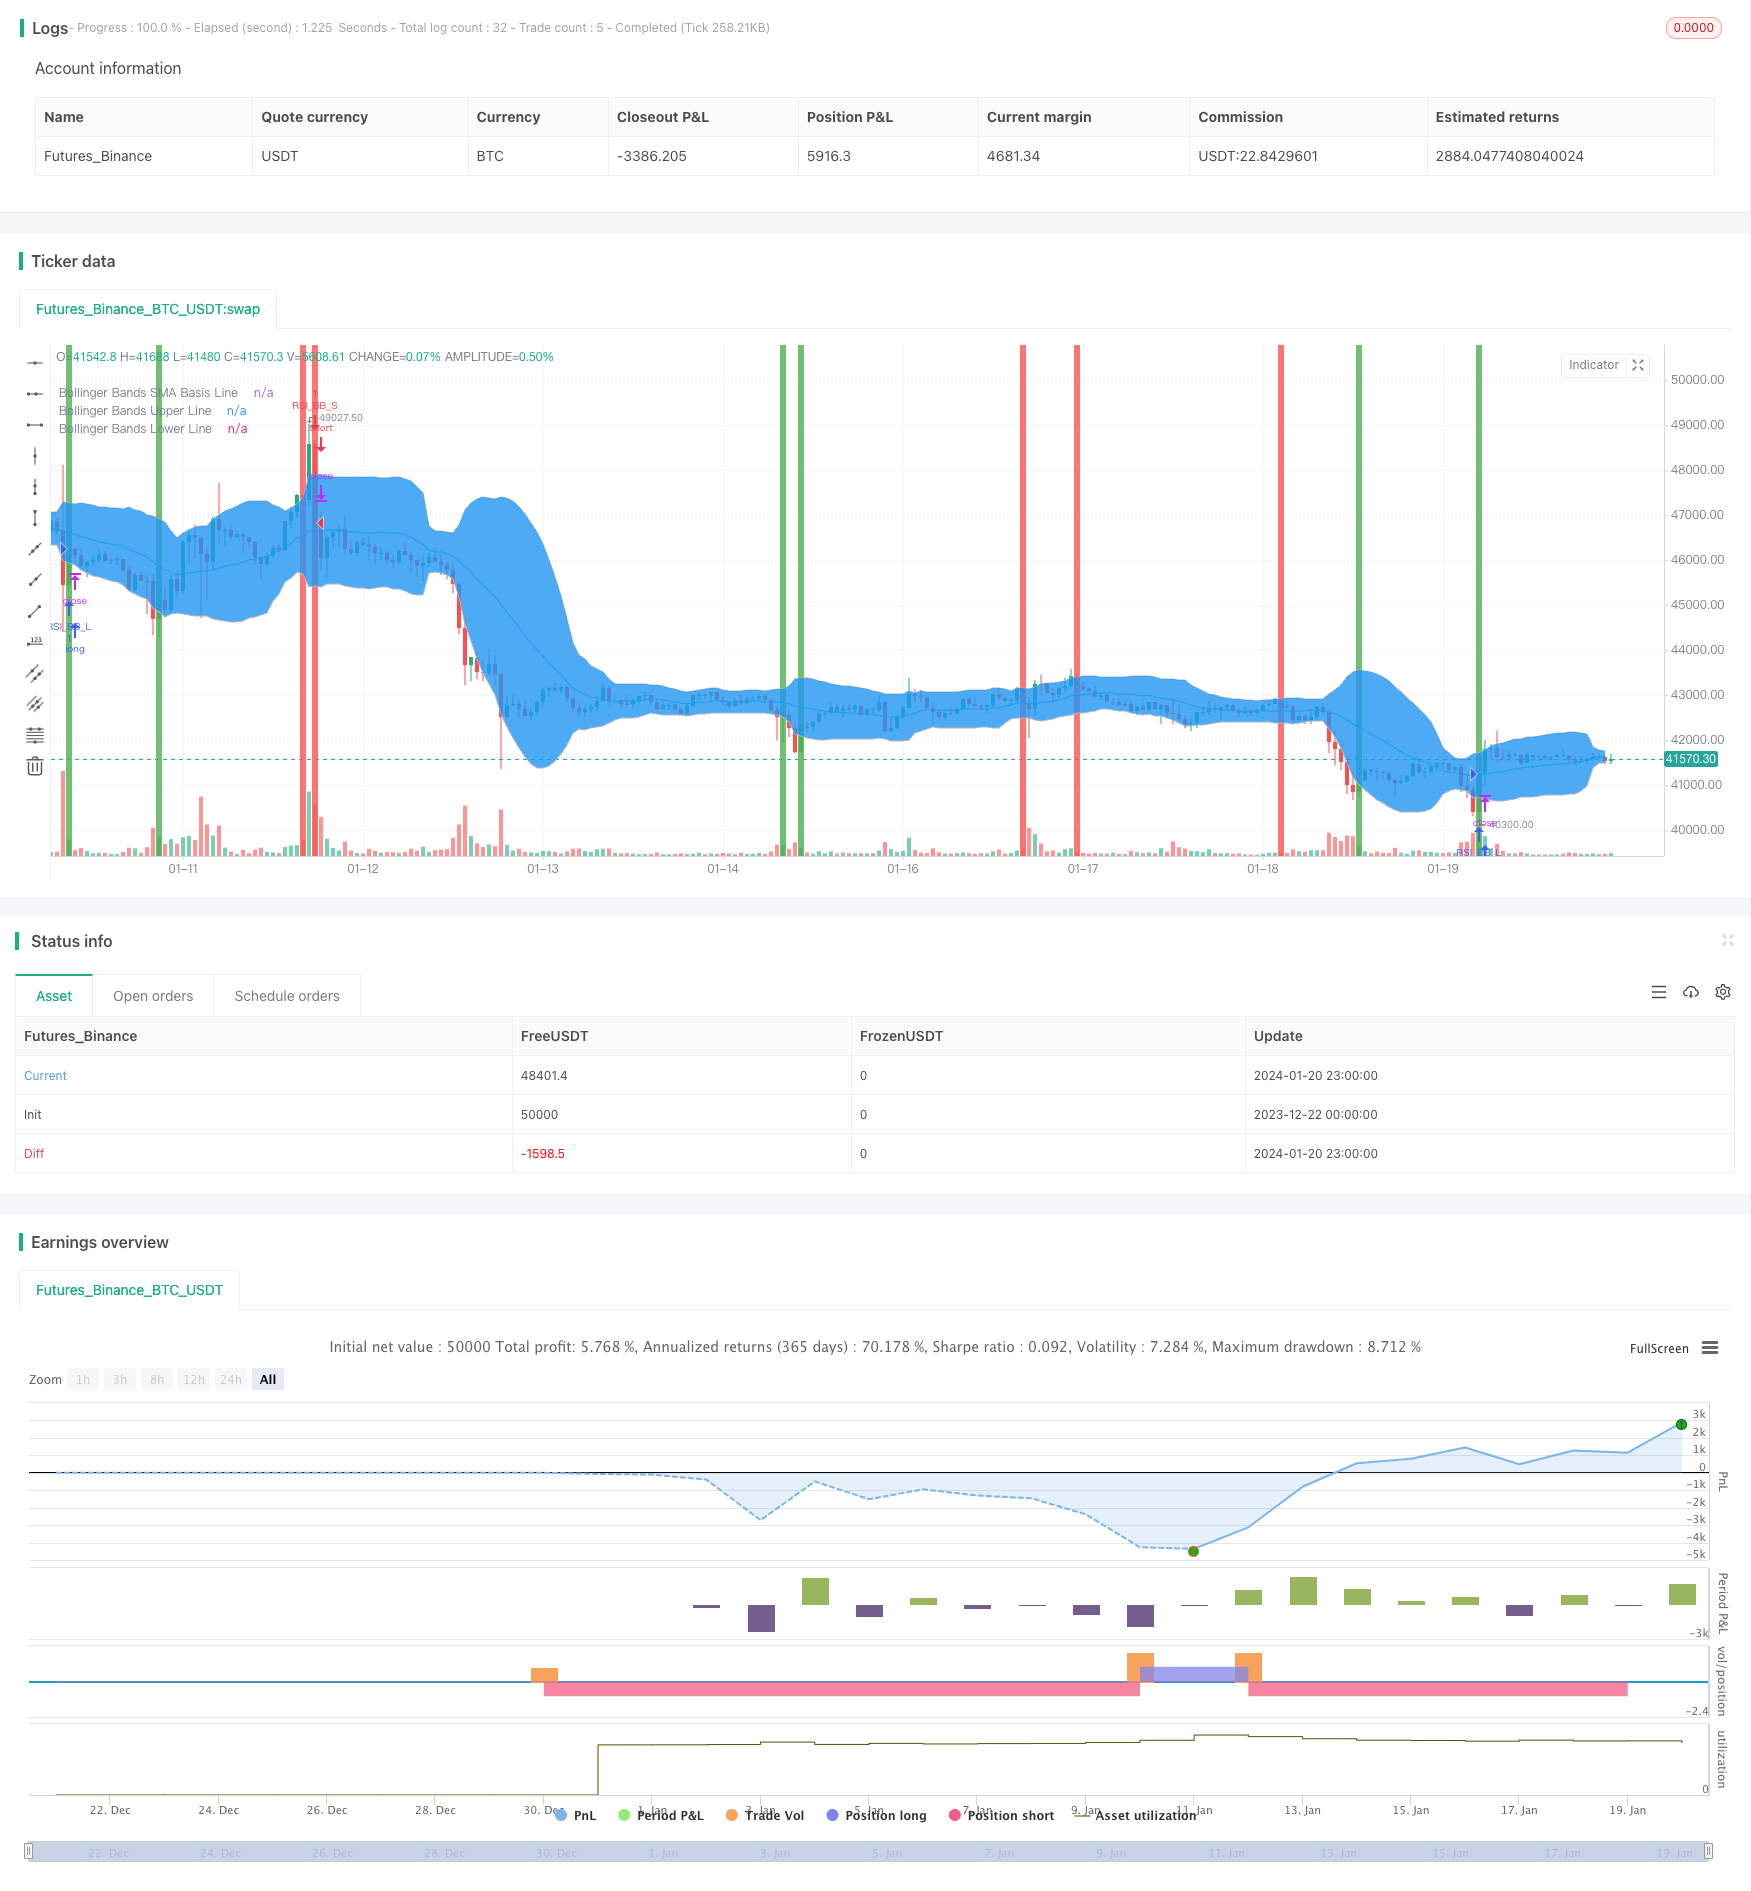
/*backtest
start: 2023-12-22 00:00:00
end: 2024-01-21 00:00:00
period: 1h
basePeriod: 15m
exchanges: [{"eid":"Futures_Binance","currency":"BTC_USDT"}]
*/

//@version=2
strategy("Bollinger + RSI, Double Strategy (by ChartArt)", shorttitle="CA_-_RSI_Bol_Strat", overlay=true)

// ChartArt's RSI + Bollinger Bands, Double Strategy
//
// Version 1.0
// Idea by ChartArt on January 14, 2015.
//
// This strategy uses a modfied RSI to sell
// when the RSI increases over the value of 55
// (or to buy when the value falls below 45),
// with the classic Bollinger Bands strategy
// to sell when the price is above the
// upper Bollinger Band (and to buy when
// this value is below the lower band).
//
// This simple strategy only triggers when
// both the RSI and the Bollinger Bands
// indicators are at the same time in
// a overbought or oversold condition.
//
// List of my work:
// https://www.tradingview.com/u/ChartArt/
//
//  __             __  ___       __  ___
// /  ` |__|  /\  |__)  |   /\  |__)  |
// \__, |  | /~~\ |  \  |  /~~\ |  \  |
//
//


///////////// RSI
RSIlength = input( 16 ,title="RSI Period Length")
RSIvalue = input( 45 ,title="RSI Value Range")
RSIoverSold = 0 + RSIvalue
RSIoverBought = 100 - RSIvalue
price = close
vrsi = rsi(price, RSIlength)


///////////// Bollinger Bands
BBlength = input(20, minval=1,title="Bollinger Bands SMA Period Length")
BBmult = input(2.0, minval=0.001, maxval=50,title="Bollinger Bands Standard Deviation")
BBbasis = sma(price, BBlength)
BBdev = BBmult * stdev(price, BBlength)
BBupper = BBbasis + BBdev
BBlower = BBbasis - BBdev
source = close
buyEntry = crossover(source, BBlower)
sellEntry = crossunder(source, BBupper)
plot(BBbasis, color=aqua,title="Bollinger Bands SMA Basis Line")
p1 = plot(BBupper, color=silver,title="Bollinger Bands Upper Line")
p2 = plot(BBlower, color=silver,title="Bollinger Bands Lower Line")
fill(p1, p2)


///////////// Colors
switch1=input(true, title="Enable Bar Color?")
switch2=input(true, title="Enable Background Color?")
TrendColor = RSIoverBought and (price[1] > BBupper and price < BBupper) ? red : RSIoverSold and (price[1] < BBlower and price > BBlower)  ? green : na
barcolor(switch1?TrendColor:na)
bgcolor(switch2?TrendColor:na,transp=50)


///////////// RSI + Bollinger Bands Strategy
if (not na(vrsi))

    if (crossover(vrsi, RSIoverSold) and crossover(source, BBlower))
        strategy.entry("RSI_BB_L", strategy.long, stop=BBlower,  comment="RSI_BB_L")
    else
        strategy.cancel(id="RSI_BB_L")

    if (crossunder(vrsi, RSIoverBought) and crossunder(source, BBupper))
        strategy.entry("RSI_BB_S", strategy.short, stop=BBupper, comment="RSI_BB_S")
    else
        strategy.cancel(id="RSI_BB_S")

//plot(strategy.equity, title="equity", color=red, linewidth=2, style=areabr)