개요
다중 시간축 트렌드 추적 전략은 다양한 이동 평균과 회귀 라인을 결합한 트렌드 추적 전략이다. 이 전략은 20개 이상의 다양한 트렌드 지표 중에서 선택하여 자동으로 구매 및 판매를 가능하게 한다.
전략 원칙
이 전략의 핵심은 사용자가 선택한 트렌드 지표에 따라 가격이 상승 또는 하락 추세에 있는지 판단하는 것입니다. 전략은 먼저 20 가지 이상의 이동 평균과 회귀선을 계산합니다. 이러한 지표는 일반 이동 평균, 가중 이동 평균, 지수 이동 평균과 같은 파인 프로그래밍 언어 표준 라이브러리의 지표를 포함하고 있으며, 또한 파인 커뮤니티가 작성한 사용자 지정 지표도 포함합니다.
우위 분석
이 전략은 20개 이상의 지표 판단 트렌드를 통합하여 단일 지표 판단 오류의 가능성을 방지한다. 그리고 이 지표들은 커뮤니티 개발자의 검증을 거쳐 왔다. 다양한 매개 변수를 사용하여 조정할 수 있으며, 여러 시장 환경에 적용된다.
간단한 이중 이동 평균 전략에 비해, 이 전략은 단일 지표에만 의존하여 트렌드 방향을 판단할 수 있으며, 트렌드를 더 잘 표현할 수 있으며, 지표와 정반대의 잘못된 신호가 발생하지 않습니다.
위험 분석
이 전략은 지표 판단 트렌드에 의존하여, 트렌드가 전환되었는지 판단할 수 없습니다. 따라서 어느 정도의 지연이 발생할 수 있습니다. 이것은 손실이나 놓친 기회를 초래할 수 있습니다. 지표 매개 변수를 조정하여 문제를 줄일 수 있습니다.
모든 트렌드형 전략은 급격한 사건이 발생하면 큰 손실을 초래합니다. 위험을 제어하기 위해 스톱을 설정해야합니다.
최적화 방향
다른 지표 판단과 결합하여 트렌드 회전을 예측하는 것이 뒤처진 문제를 줄이는 것을 고려할 수 있습니다. 예를 들어, 부린 띠 지표 판단과 결합하여 가격이 과도하게 확장되는지 판단합니다.
급격한 사건에 대응하는 긴급 손실 메커니즘을 설계할 수 있다. 예를 들어, 하루 동안 5% 이상의 손실이 발생했을 때 강제적인 손실을 시작한다.
요약하다
다중 시간축 트렌드 추적 전략은 20개 이상의 지표 판단 트렌드를 통합하여 시장의 흐름을 충분히 표현하고 가짜 신호를 방지할 수 있습니다. 동시에 높은 사용자 정의를 유지하면서 큰 차이의 시장 환경에 적용 할 수 있습니다. 매우 효과적인 트렌드 추적 전략입니다. 적절한 스톱 로드 및 최적화 지표 매개 변수를 설정하여 위험을 통제하는 조건에서 더 나은 수익을 얻을 수 있습니다.
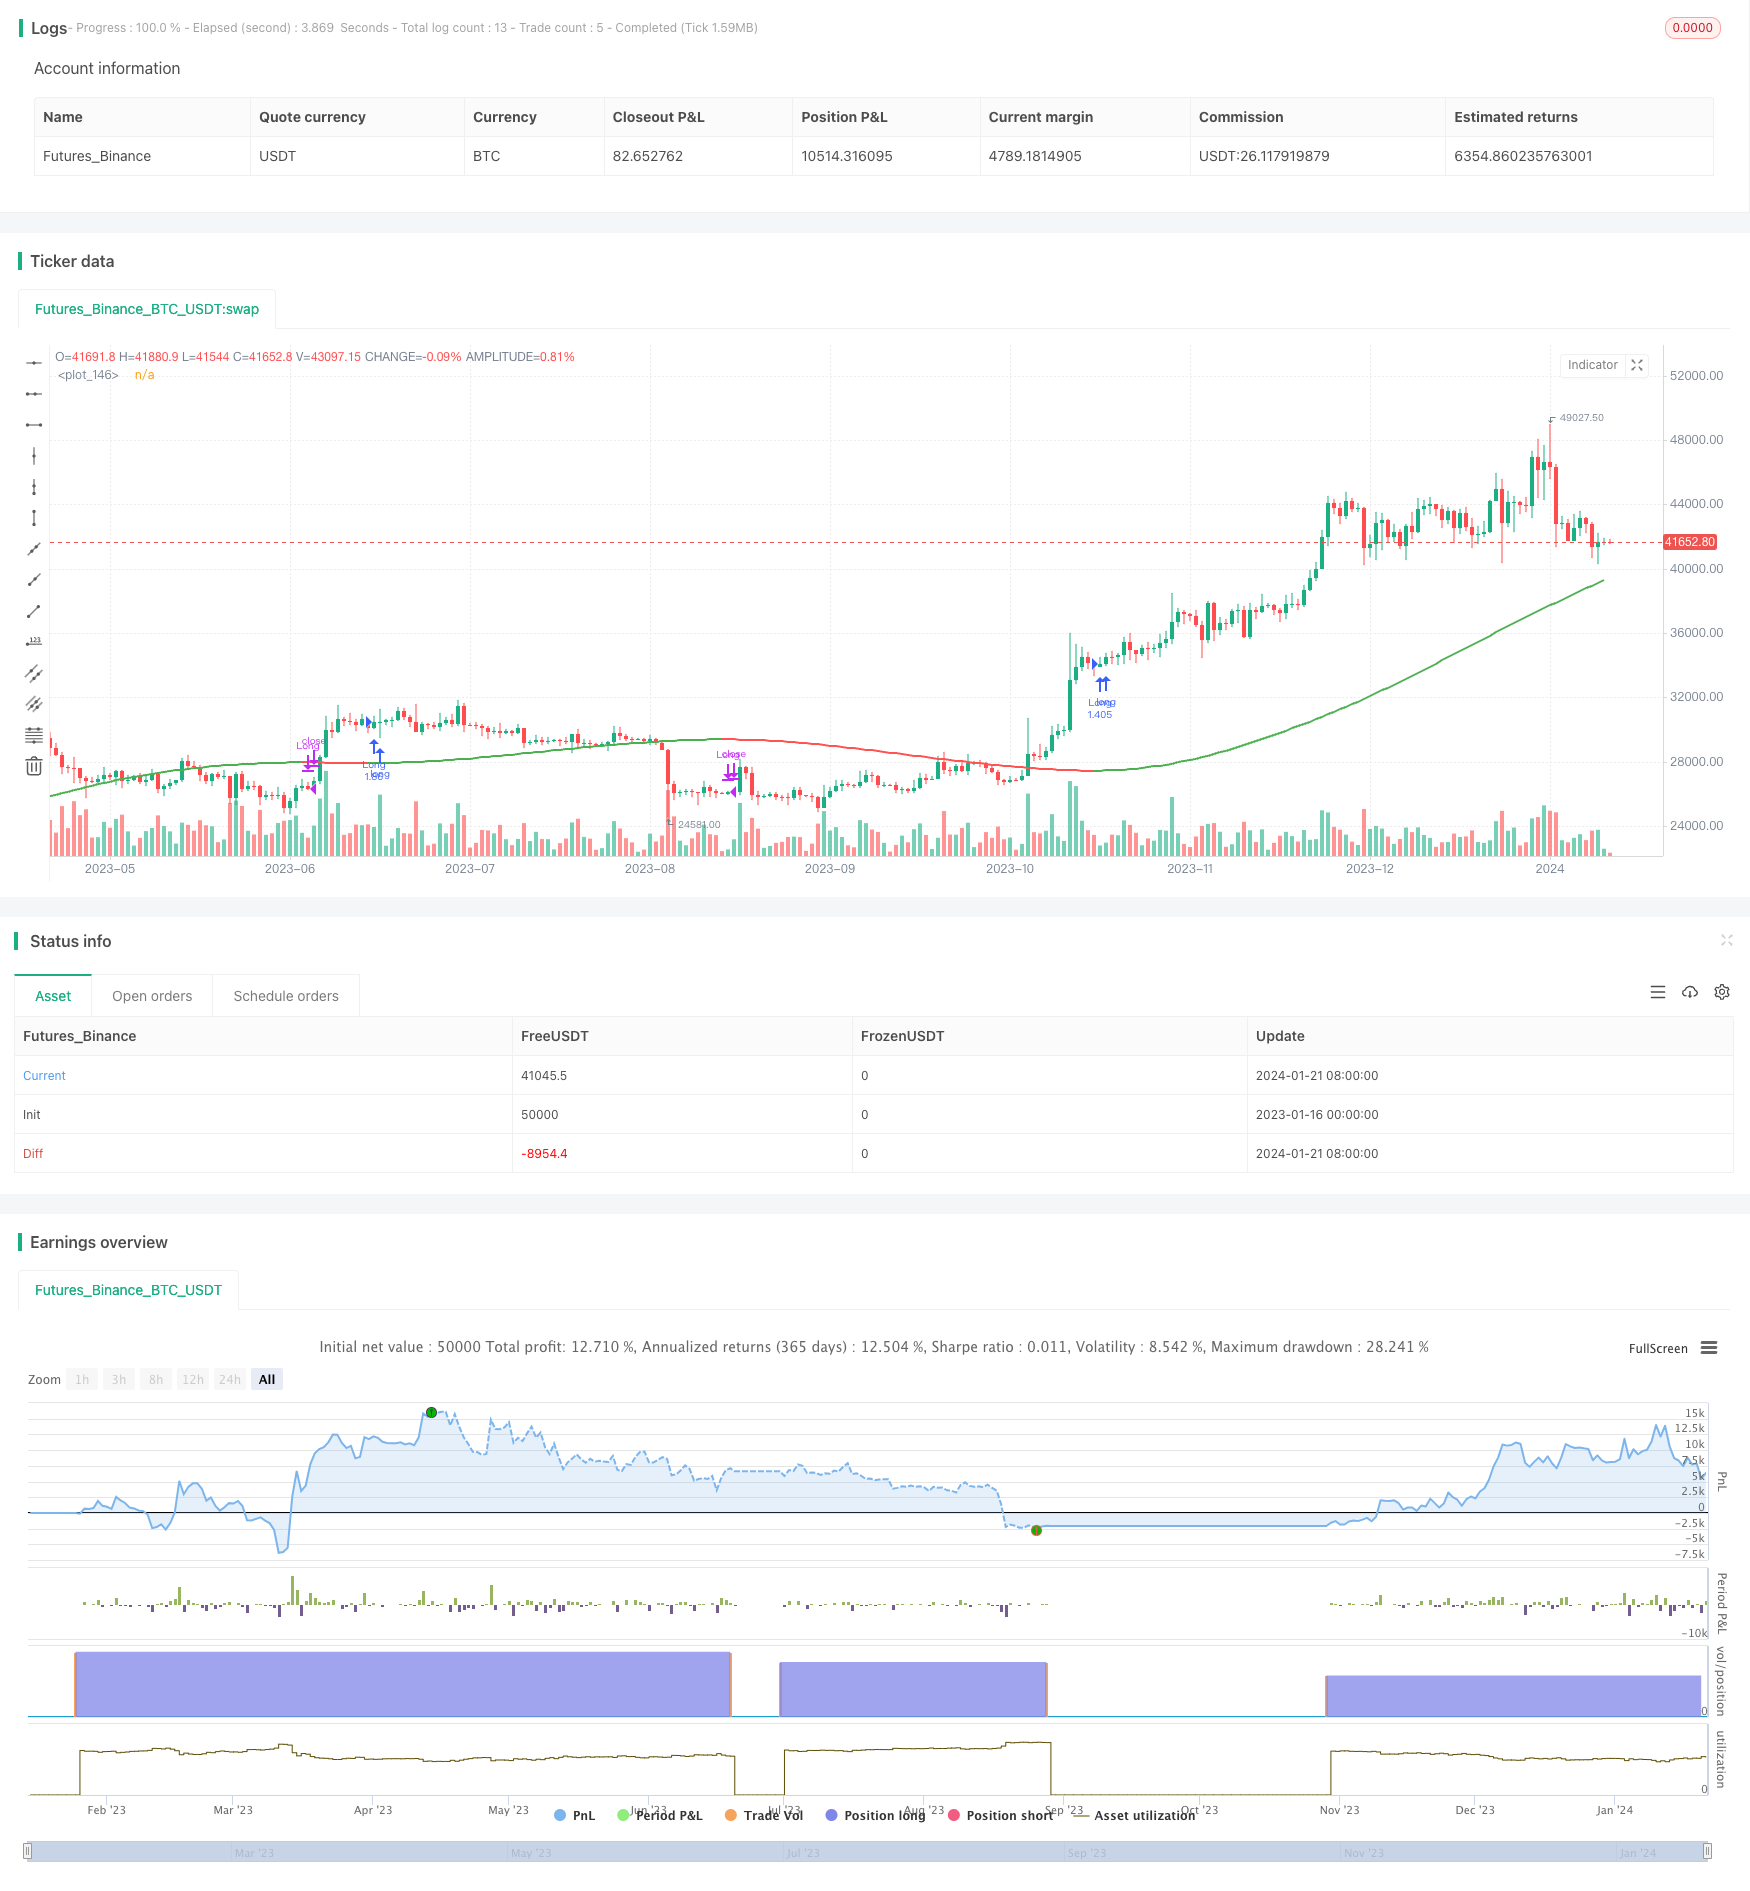
/*backtest
start: 2023-01-16 00:00:00
end: 2024-01-22 00:00:00
period: 1d
basePeriod: 1h
exchanges: [{"eid":"Futures_Binance","currency":"BTC_USDT"}]
*/

// This source code is subject to the terms of the Mozilla Public License 2.0 at https://mozilla.org/MPL/2.0/
// @version=5
// Author = TradeAutomation


strategy(title="Multi MA Trend Following Strategy Template", shorttitle="Multi Trend", process_orders_on_close=true, overlay=true, commission_type=strategy.commission.cash_per_order, commission_value=1, slippage = 0, margin_short = 75, margin_long = 75, initial_capital = 100000000, default_qty_type=strategy.percent_of_equity, default_qty_value=100)

// Backtest Date Range Inputs //
StartTime = input(defval=timestamp('01 Jan 2019 05:00 +0000'), group="Date Rangte", title='Start Time')
EndTime = input(defval=timestamp('01 Jan 2099 00:00 +0000'), group="Date Range", title='End Time')
InDateRange = true

// Trend Selector //
TrendSelectorInput = input.string(title="Trend Selector", defval="JMA", group="Core Settings", options=["ALMA", "DEMA", "EMA", "HMA", "JMA", "KAMA", "Linear Regression (LSMA)", "RMA", "SMA", "SMMA", "Source", "SuperTrend", "TEMA", "TMA", "VAMA", "VIDYA", "VMA", "VWMA", "WMA", "WWMA", "ZLEMA"], tooltip="Select your moving average")
src = input.source(close, "Source", group="Core Settings", tooltip="This is the price source being used for the moving averages to calculate based on")
length = input.int(200, "MA Length", group="Core Settings", tooltip="This is the amount of historical bars being used for the moving averages to calculate based on")
LineWidth = input.int(2, "Line Width", group="Core Settings", tooltip="This is the width of the line plotted that represents the selected trend")

// Individual Moving Average / Regression Setting //
AlmaOffset = input.float(0.85, "ALMA Offset", group="Individual MA Settings", tooltip="This only applies when ALMA is selected")
AlmaSigma = input.float(6, "ALMA Sigma", group="Individual MA Settings", tooltip="This only applies when ALMA is selected")
ATRFactor = input.float(3, "ATR Multiplier For SuperTrend", group="Individual MA Settings", tooltip="This only applies when SuperTrend is selected")
ATRLength = input.int(12, "ATR Length For SuperTrend", group="Individual MA Settings", tooltip="This only applies when SuperTrend is selected")
JMApower = input.int(2, "JMA Power Parameter", group="Individual MA Settings", tooltip="This only applies when JMA is selected")
KamaAlpha = input.float(3, "KAMA's Alpha", minval=1,step=0.5, group="Individual MA Settings", tooltip="This only applies when KAMA is selected")
LinRegOffset = input.int(0, "Linear Regression Offset", group="Individual MA Settings", tooltip="This only applies when Linear Regression is selected")
VAMALookback =input.int(12, "VAMA Volatility lookback", group="Individual MA Settings", tooltip="This only applies when VAMA is selected")

// Trend Indicators in Library //
ALMA = ta.alma(src, length, AlmaOffset, AlmaSigma)
EMA = ta.ema(src, length)
HMA = ta.hma(src, length)
LinReg = ta.linreg(src, length, LinRegOffset)
RMA = ta.rma(src, length)
SMA = ta.sma(src, length)
VWMA = ta.vwma(src, length)
WMA = ta.wma(src, length)

// Additional Trend Indicators Written and/or Open Sourced //
//DEMA
de1 = ta.ema(src, length)
de2 = ta.ema(de1, length)
DEMA = 2 * de1 - de2

//JMA [Capissmo]
beta = 0.45*(length-1)/(0.45*(length-1)+2)
alpha = math.pow(beta, JMApower)
L0=0.0, L1=0.0, L2=0.0, L3=0.0, JMA=0.0
L0 := (1-alpha)*src + alpha*nz(L0[1])
L1 := (src - L0[0])*(1-beta) + beta*nz(L1[1])
L2 := L0[0] + L1[0]
L3 := (L2[0] - nz(JMA[1]))*((1-alpha)*(1-alpha)) + (alpha*alpha)*nz(L3[1])
JMA := nz(JMA[1]) + L3[0]

//KAMA
var KAMA = 0.0
fastAlpha = 2.0 / (KamaAlpha + 1)
slowAlpha = 2.0 / 31
momentum = math.abs(ta.change(src, length))
volatility = math.sum(math.abs(ta.change(src)), length)
efficiencyRatio = volatility != 0 ? momentum / volatility : 0
smoothingConstant = math.pow((efficiencyRatio * (fastAlpha - slowAlpha)) + slowAlpha, 2)
KAMA := nz(KAMA[1], src) + smoothingConstant * (src - nz(KAMA[1], src))

//SMMA
var SMMA = 0.0
SMMA := na(SMMA[1]) ? ta.sma(src, length) : (SMMA[1] * (length - 1) + src) / length

//SuperTrend
ATR = ta.atr(ATRLength)
Signal = ATRFactor*ATR
var SuperTrend = 0.0
SuperTrend := if src>SuperTrend[1] and src[1]>SuperTrend[1]
    math.max(SuperTrend[1], src-Signal)
else if src<SuperTrend[1] and src[1]<SuperTrend[1]
    math.min(SuperTrend[1], src+Signal)
else if src>SuperTrend[1]
    src-Signal
else
    src+Signal

//TEMA
t1 = ta.ema(src, length)
t2 = ta.ema(t1, length)
t3 = ta.ema(t2, length)
TEMA = 3 * (t1 - t2) + t3

//TMA
TMA = ta.sma(ta.sma(src, math.ceil(length / 2)), math.floor(length / 2) + 1)

//VAMA
mid=ta.ema(src,length)
dev=src-mid
vol_up=ta.highest(dev,VAMALookback)
vol_down=ta.lowest(dev,VAMALookback)
VAMA = mid+math.avg(vol_up,vol_down)

//VIDYA [KivancOzbilgic]
var VIDYA=0.0
VMAalpha=2/(length+1)
ud1=src>src[1] ? src-src[1] : 0
dd1=src<src[1] ? src[1]-src : 0
UD=math.sum(ud1,9)
DD=math.sum(dd1,9)
CMO=nz((UD-DD)/(UD+DD))
VIDYA := na(VIDYA[1]) ? ta.sma(src, length) : nz(VMAalpha*math.abs(CMO)*src)+(1-VMAalpha*math.abs(CMO))*nz(VIDYA[1])

//VMA [LazyBear]
sc = 1/length
pdm = math.max((src - src[1]), 0)
mdm = math.max((src[1] - src), 0)
var pdmS = 0.0
var mdmS = 0.0
pdmS := ((1 - sc)*nz(pdmS[1]) + sc*pdm)
mdmS := ((1 - sc)*nz(mdmS[1]) + sc*mdm)
s = pdmS + mdmS
pdi = pdmS/s
mdi = mdmS/s
var pdiS = 0.0
var mdiS = 0.0
pdiS := ((1 - sc)*nz(pdiS[1]) + sc*pdi)
mdiS := ((1 - sc)*nz(mdiS[1]) + sc*mdi)
d = math.abs(pdiS - mdiS)
s1 = pdiS + mdiS
var iS = 0.0
iS := ((1 - sc)*nz(iS[1]) + sc*d/s1)
hhv = ta.highest(iS, length)
llv = ta.lowest(iS, length)
d1 = hhv - llv
vi = (iS - llv)/d1
var VMA=0.0
VMA := sc*vi*src + (1 - sc*vi)*nz(VMA[1])

//WWMA
var WWMA=0.0
WWMA := (1/length)*src + (1-(1/length))*nz(WWMA[1])

//Zero Lag EMA
EMA1 = ta.ema(src,length)
EMA2 = ta.ema(EMA1,length)
Diff = EMA1 - EMA2
ZLEMA = EMA1 + Diff

// Trend Mapping and Plotting //
Trend = TrendSelectorInput == "ALMA" ? ALMA : TrendSelectorInput == "DEMA" ? DEMA : TrendSelectorInput == "EMA" ? EMA : TrendSelectorInput == "HMA" ? HMA : TrendSelectorInput == "JMA" ? JMA : TrendSelectorInput == "KAMA" ? KAMA : TrendSelectorInput == "Linear Regression (LSMA)" ? LinReg : TrendSelectorInput == "RMA" ? RMA : TrendSelectorInput == "SMA" ? SMA : TrendSelectorInput == "SMMA" ? SMMA : TrendSelectorInput == "Source" ? src : TrendSelectorInput == "SuperTrend" ? SuperTrend : TrendSelectorInput == "TEMA" ? TEMA : TrendSelectorInput == "TMA" ? TMA : TrendSelectorInput == "VAMA" ? VAMA : TrendSelectorInput == "VIDYA" ? VIDYA : TrendSelectorInput == "VMA" ? VMA : TrendSelectorInput == "VWMA" ? VWMA : TrendSelectorInput == "WMA" ? WMA : TrendSelectorInput == "WWMA" ? WWMA : TrendSelectorInput == "ZLEMA" ? ZLEMA : SMA
plot(Trend, color=(Trend>Trend[1]) ? color.green : (Trend<Trend[1]) ? color.red : (Trend==Trend[1]) ? color.gray : color.black, linewidth=LineWidth)

// Entry & Exit Functions //

if (InDateRange)
    strategy.entry("Long", strategy.long, when = ta.crossover(Trend, Trend[1]))
    strategy.close("Long", when = ta.crossunder(Trend, Trend[1]))
if (not InDateRange)
    strategy.close_all()