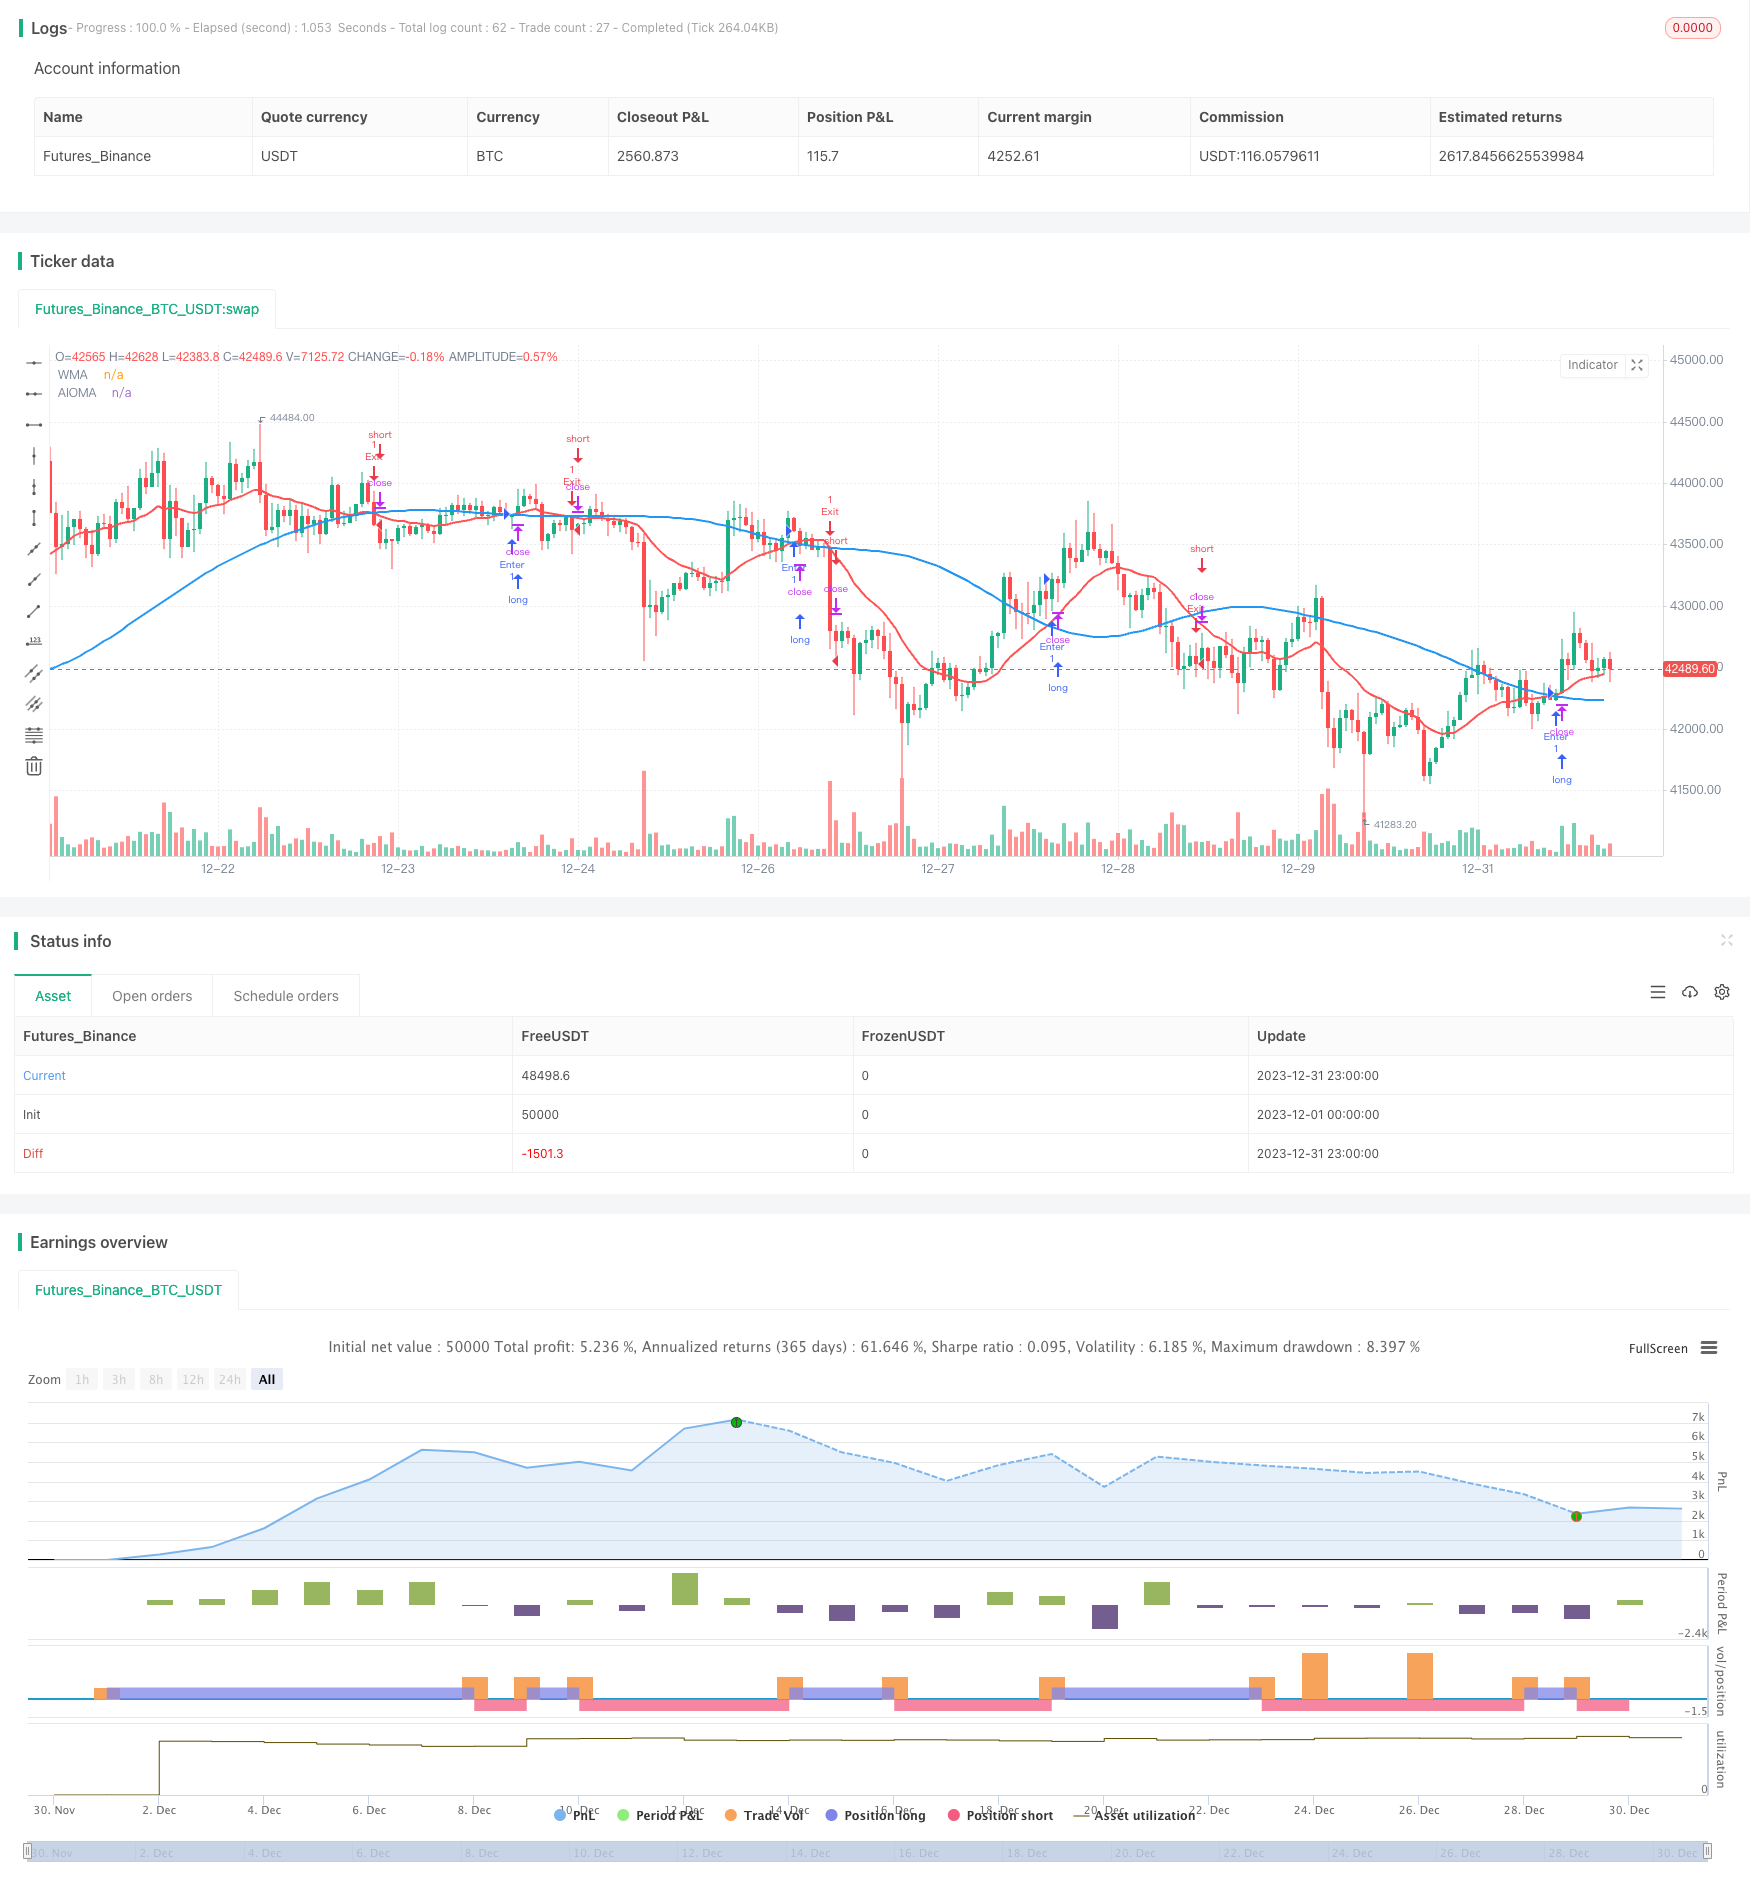
개요
이 전략은 자기 적응 이동 평균 지표 (AIOMA) 와 중화 이동 평균 지표 (WMA) 를 기반으로 거래 신호를 구현한다. AIOMA와 WMA의 교차로 구매 및 판매 신호를 생성한다.
전략 이름
AIOMA-WMA 적응 교차 전략
전략 원칙
이 전략은 다음과 같은 부분들을 포함하고 있습니다.
AIOMA 지표 계산
- 길이 변수를 지정하여 일련의 지수 이동 평균을 계산합니다.
- 이 EMA들을 매끄럽게 연결해서 매끄러운 순서를 만들어
- 최종 AIOMA는 마지막 평준화 값의 EMA입니다
WMA 지수 계산
- WMA를 계산하기 위해 길이 변수를 지정합니다.
거래 신호 생성
- WMA가 AIOMA를 사용하면 구매 신호가 생성됩니다.
- WMA는 AIOMA를 통과하면 판매 신호를 생성합니다.
거래 로직
- 시그널을 사면 다단계 포지션에 들어갑니다.
- 시그널을 팔 때, 공백점으로 들어갑니다
- 평평한 포지션 신호가 있을 때, 대응 방향의 포지션을 닫습니다.
전략적 이점
- 두 가지 다른 유형의 이동 평균을 사용하여 거래 신호의 정확성을 향상시킬 수 있습니다.
- AIOMA는 여러 개의 지수를 매끄럽게 하여 잘못된 신호를 줄일 수 있습니다.
- WMA는 주요 지표로서 가격 변화에 더 민감하여 동향을 더 일찍 잡을 수 있습니다.
- 간단한 거래 논리, 이해하기 쉽고 실행하기 쉽습니다.
전략적 위험
- EMA를 여러 번 완화하면 과도한 지연이 발생할 수 있습니다.
- WMA는 단기 가격 변동에 취약하여 잘못된 신호를 발생시킵니다.
- 막부 논리가 고려되지 않아 큰 손실이 발생할 수 있습니다.
적절한 최적화 매개 변수, 정지점 설정, 또는 다른 지표 필터링과 결합하여 위험을 줄일 수 있습니다.
전략 최적화 방향
- 다양한 길이의 변수를 조합하여 최적의 변수를 테스트합니다.
- 구매/판매 신호와 동시에 중지 명령을 발동
- 위조 신호를 필터링하는 시장 변동성 지표와 결합
- 포지션 관리 전략
요약하다
이 전략은 AIOMA와 WMA의 두 지표의 장점을 통합하여 교차하여 거래 신호를 생성한다. 단일 이동 평균에 비해 신호 품질을 향상시킬 수 있다. 파라미터 최적화, 스톱 손실 전략 및 변동성 필터링 등의 추가적인 개선을 통해 안정적이고 신뢰할 수있는 거래 시스템이 될 수 있다.
전략 소스 코드
/*backtest
start: 2023-12-01 00:00:00
end: 2023-12-31 23:59:59
period: 1h
basePeriod: 15m
exchanges: [{"eid":"Futures_Binance","currency":"BTC_USDT"}]
*/

// This Pine Script™ code is subject to the terms of the Mozilla Public License 2.0 at https://mozilla.org/MPL/2.0/
// © SDTA

//@version=5
strategy("AIOMA-WMA Strategy", overlay=true)

// Parametreler
aioma_length = input(14, "AIOMA Length")
wma_length = input(21, "WMA Length")

// AIOMA hesaplama
length1 = aioma_length
ema1 = ta.ema(close, length1)
length2 = aioma_length
ema2 = ta.ema(ema1, length2)
length3 = aioma_length
ema3 = ta.ema(ema2, length3)
length4 = aioma_length
ema4 = ta.ema(ema3, length4)
aioma = ta.ema(ema4, aioma_length)

// WMA hesaplama
wma = ta.wma(close, wma_length)

// Kesişim kontrolü
cross_up = ta.crossover(wma, aioma)
cross_down = ta.crossunder(wma, aioma)

// İşlem fonksiyonu
enterTrade(dir, price, signalText, color) =>
    if dir
        strategy.entry("Enter", strategy.long)
        label.new(x = bar_index, y = price, text = signalText, color = color, textcolor = color, style = label.style_label_up, size = size.small, tooltip = "Entry Signal")
    else if not dir
        strategy.entry("Exit", strategy.short)
        label.new(x = bar_index, y = price, text = signalText, color = color, textcolor = color, style = label.style_label_down, size = size.small, tooltip = "Exit Signal")

// Long pozisyon girişi
if cross_up
    enterTrade(true, low, "Buy Signal", color.green)

// Short pozisyon girişi
if cross_down
    enterTrade(false, high, "Sell Signal", color.red)

// Pozisyon kapatma
if cross_up and strategy.position_size > 0
    strategy.close("Enter")
if cross_down and strategy.position_size < 0
    strategy.close("Exit")

// Grafiğe plot
plot(aioma, color=color.blue, linewidth=2, title="AIOMA")
plot(wma, color=color.red, linewidth=2, title="WMA")