개요
이것은 이동 평균, 무한 펄스 응답 평균 (IIR) 및 자기 적응형 선형 이동 평균 (ALMA) 을 이용한 양적 전략이다. 이 전략은 다양한 지표의 조합을 가지고 있어 거래자에게 풍부한 거래 신호를 제공할 수 있다.
전략 원칙
이 전략은 다음과 같은 부분들로 구성되어 있습니다.
그리고 SMA, ALMA, IIR를 사용하여 거래시점으로 그들의 교차 신호를 감지합니다.
3개의 다른 주기의 IIR를 사용하여, 그들 사이의 거리를 계산하여, 가격이 압축 상태에 있는지 판단하십시오. 압축 상태는 변동성이 감소하는 것을 나타내며, 종종 가격이 더 큰 변화를 일으킬 것을 예고합니다.
IIR의 기울기를 판단하기 위해, 기울기가 올라갈 때, 녹색, 내려갈 때 파란색으로. IIR의 움직임을 직관적으로 판단할 수 있다.
SMA 사이의 거리가 확장되고 있는지 계산하고, 만약 그렇다면, 扇形의 확장을 나타내는 특별한 표기를 수행합니다. 이는 일반적으로 가격이 트렌드 상태에 들어간다는 것을 의미합니다.
상대적으로 약한 지표 (RSI) 와 결합된 오버 바이 오버 셀 신호가 거래 신호를 보완한다.
이 전략은 위의 몇 가지 부분을 조합하여 보다 포괄적이고 풍부한 거래 입시, 판단 및 퇴출 신호를 제공할 수 있습니다.
전략적 강점 분석
이 전략의 가장 큰 장점은 지표 포트폴리지가 포괄적이고 풍부하다는 점입니다. 트렌드 판단뿐만 아니라 변동률과 과매매 과매매 상태를 고려하여 거래 의사 결정에 다차원적 인 참조를 제공합니다.
또 다른 장점은 매개 변수와 지표가 쉽게 조정되고 최적화될 수 있다는 점이며, 사용자는 자신의 필요에 따라 관련 매개 변수와 지표를 활성화할 수 있다.
위험 관리 측면에서, 이 전략은 빠른 평균선과 느린 평균선을 동시에 고려하여 가격 변동으로 인한 잘못된 신호의 가능성을 줄일 수 있습니다.
위험 분석
이 전략의 주요 위험은 다음과 같습니다.
너무 복잡하여 지표 충돌이 발생할 수 있으며, 특정 파라미터 조합을 선택하면 과합이 발생할 수 있습니다.
다중조합평평선 시스템을 사용하면 시장이 급격하게 변할 때 (중대 경제 사건과 같은) 큰 손실이 발생할 수 있습니다.
실전에서는 생존 선비 bias의 위험이 있을 수 있다.
적용 과정에서 우리는 위험 관리에 주의를 기울이고 포지션 규모를 적절히 조정해야 합니다. 그리고 전략의 실전 효과를 보장하기 위해 더 긴 시간 범위와 더 큰 데이터 세트에 대해 여러 번 재검토해야합니다.
전략 최적화 방향
이 전략의 지표 조합은 복잡하고, 많은 변수들을 고려하여, 다음의 몇 가지 측면에서 최적화할 수 있습니다:
지표 선택을 간소화하고, 부적절하거나 충돌하는 지표를 제거한다.
IIR 평균선에서 최적화된 길이를 선택하여 시장 특성에 맞는 길이를 선택합니다.
속속평선 조합을 최적화하여 교차 신호의 안정성을 향상한다.
기계학습 모델의 보조 판단을 높이고, 전략의 적응력을 향상시킵니다.
전체 지수와 연관성을 최적화하여 트렌드 판단의 성공률을 높여줍니다.
요약하다
지표의 유연한 조합과 최적화를 통해, 이 전략은 시장 상태를 보다 포괄적으로 반영하여 거래 의사결정에 다차원적 지원을 제공할 수 있다. 그러나 또한 실제와 데이터 과잉 맞춤의 위험이 있다.
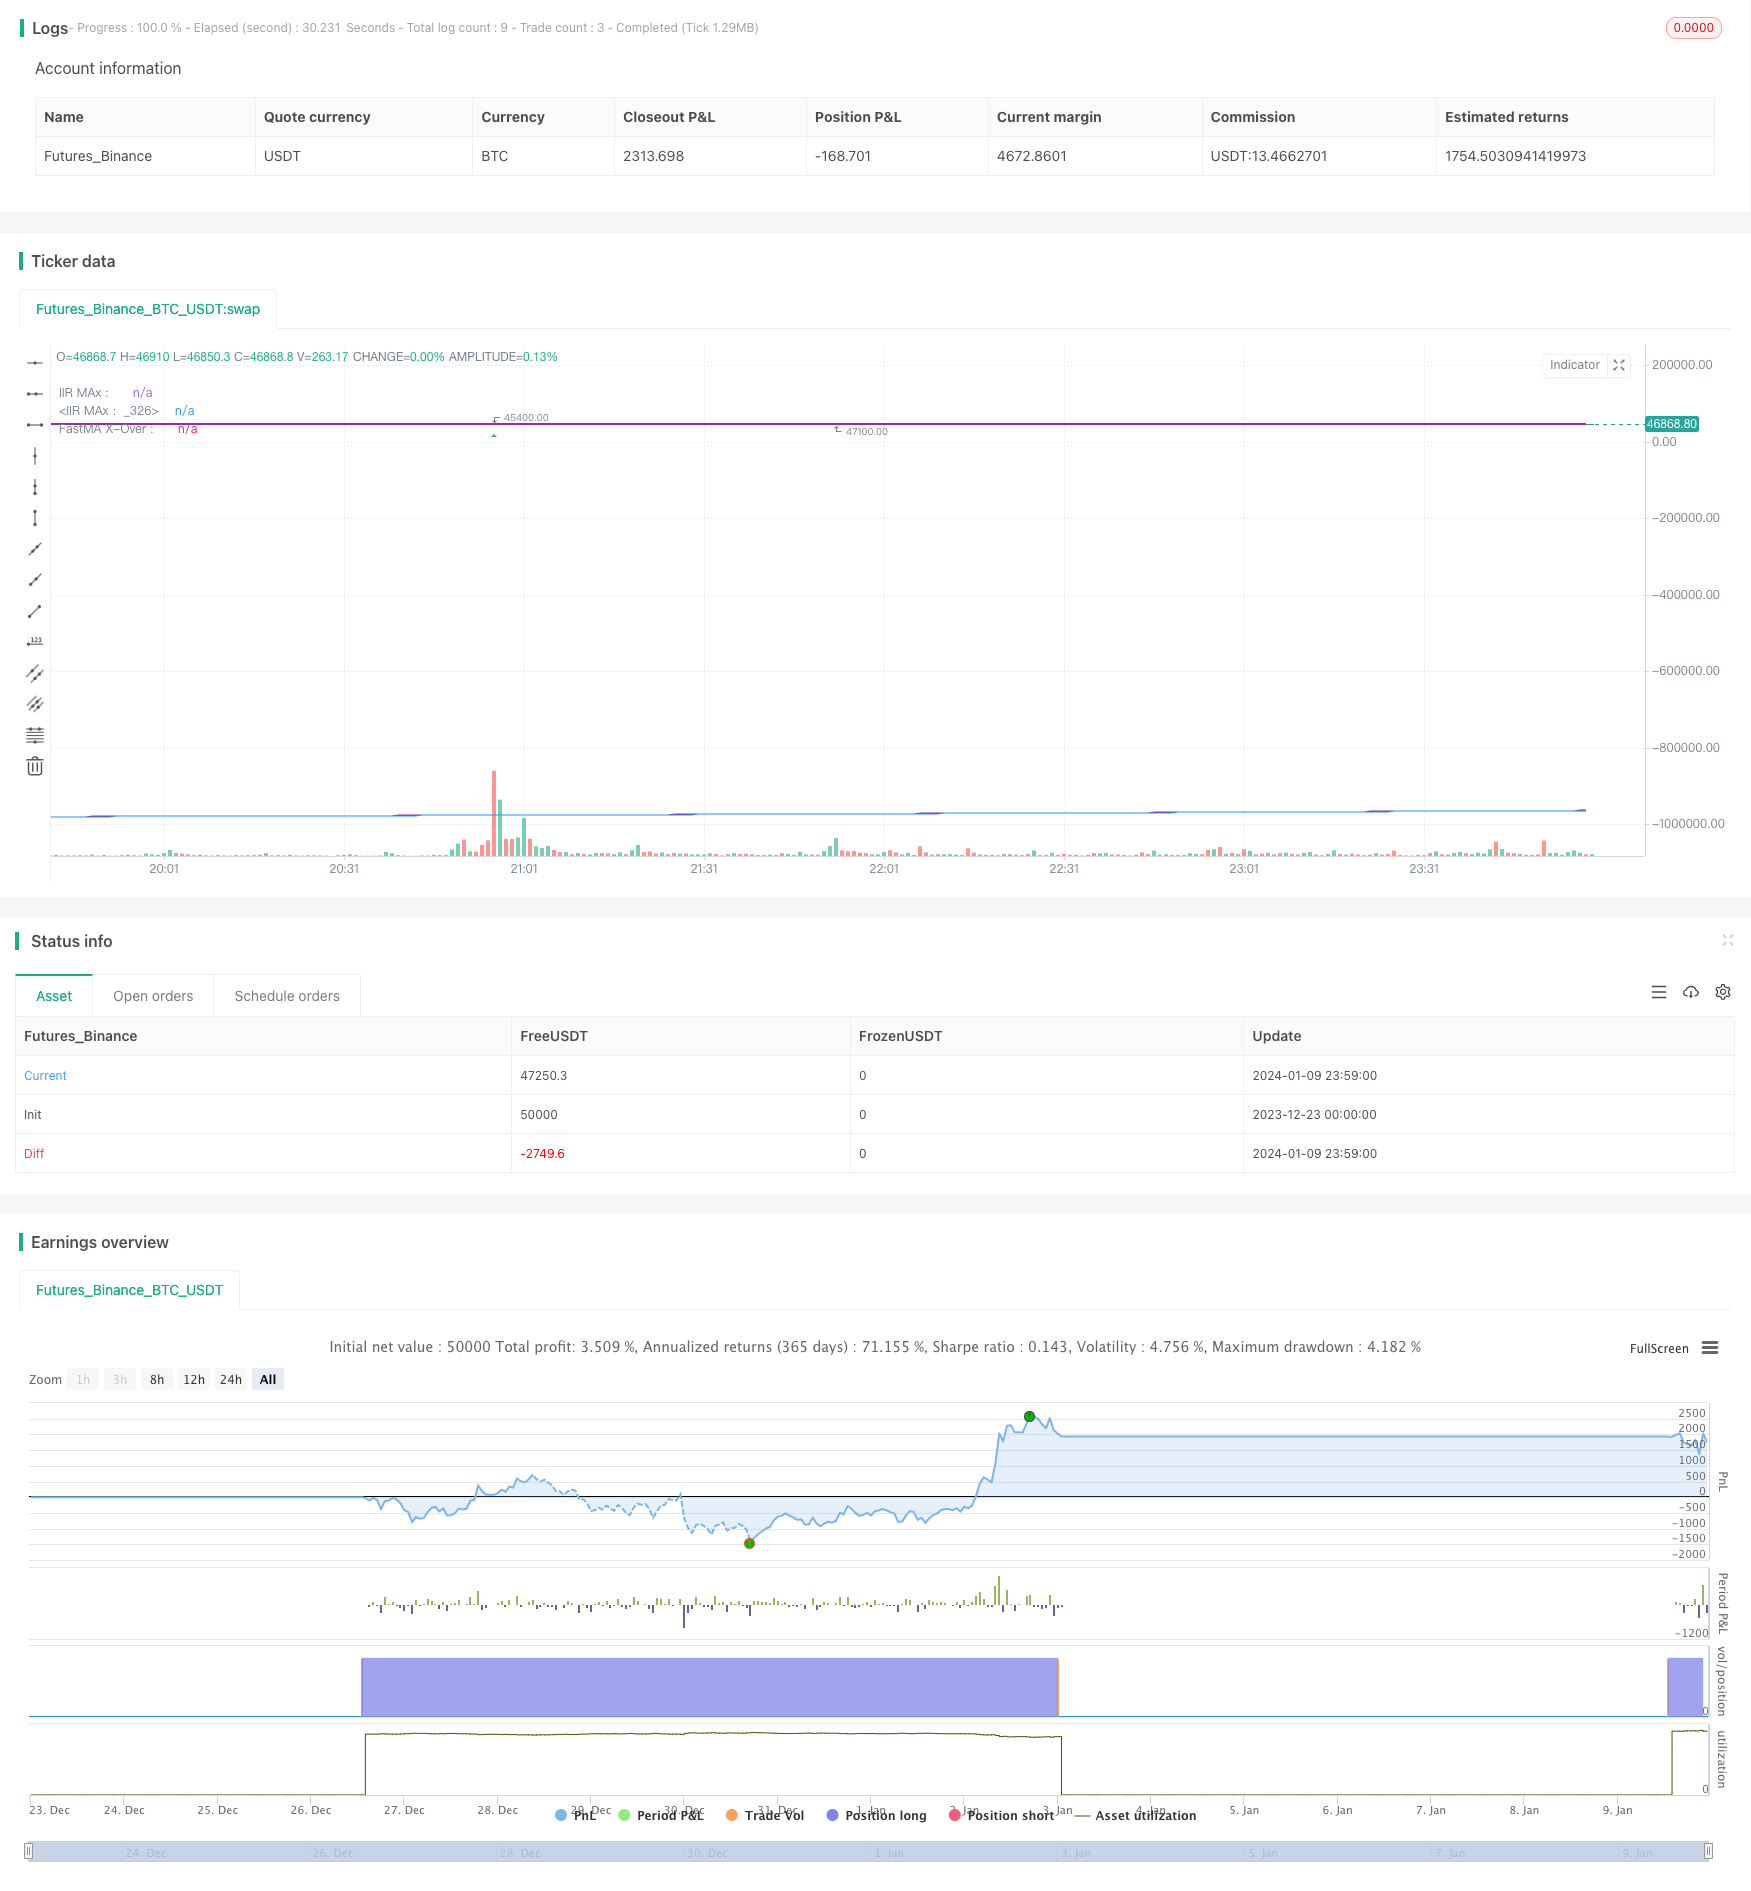
/*backtest
start: 2023-12-23 00:00:00
end: 2024-01-10 00:00:00
period: 1m
basePeriod: 1m
exchanges: [{"eid":"Futures_Binance","currency":"BTC_USDT"}]
*/

//The plotchar UP/DOWN Arrows  is the crossover of the fastest MA and fastest IIR MAs
//
//The dots at the bottom are the two simple averages crossing over
//
//The count over/under the candles is the count of bars that the SMAs on their
//respective resolution are fanning out.
//
//The colored background indicates a squeeze, lime=kinda tight : green=very tight squeeze.  based on the 3 IIRs
//
//To answer my own question in a forum, looking at the code, i couldn't figure out how to get it from another timeframe
//and run the same calculations with the same results.  My answer in the end was to scale the chosen MA length
//in the corresponding CurrentPeriod/ChosenMAPeriod proportion.  This results in the same line in the same place when browsing through the
//different time resolutions.  Somebody might find this invaluable
//
//The counts are for MA's fanning out, or going parabolic.  Theres IIRs, Almas, one done of the other.  A lot.
//The arrows above and below bars are from standard RSI numbers for OB/OS
//
//The IIRs changes color depending on their slope, which can be referenced easily with a variable.
//
//The backgrond on a bar-by-bar basis is colored when 2 sets of moving averages are in a squeeze, aka
//when price is consolidating.
//
//This aims to help the trader combine conditions and entry criteria of the trade and explore these options visually.
//They detail things from all time-frames on the current one.  I prefer it because of the fractal nature of price-action, both large and small,
//either yesterday or last year.  For best results, go long in short-term trades when the long-term trend is also up.
//and other profitable insights.  This is also a great example of an automation algorith.
//
//The pretty ribbon is my script called 'Trading With Colors'. Use them together for fanciest results.  55/233 is my Fib Cross (golden/death)  Compare it to the classic 50/200 if
//you get bored.  I believe it simply works better, at least for Crypto.
//
//Evidently, I am a day-trader.  But this yields higher profits on larger time-frames anyways, so do play around with it. Find what works for you.

//Thanks and credit for code snippets goes to:
//matryskowal
//ChrisMoody, probably twice
//Alex Orekhov (everget)
//author=LucF and midtownsk8rguy, for PineCoders
//If you use code from this, real quick search for perhaps the original and give them a shoutout too.  I may have missed something

//Author: Sean Duffy
//@version=4
strategy(title = "Combination Parabolic MA/IIR/ALMA Strategy",
         shorttitle = "MA-QuickE",
         overlay = true )
        //  calc_on_order_fills = true,
        //  calc_on_every_tick = true,
// Input Variables
showFIBMAs = input(false, type=input.bool, title="═══════════════ Show Fibby MAs ═══════════════")
maRes = input(960, type=input.integer, title="MA-Cross Resolution")
mal1 = input(8, type=input.integer, title="MA#1 Length")
mal2 = input(13, type=input.integer, title="MA#2 Length")
mal3 = input(34, type=input.integer, title="MA#3 Length")
loosePercentClose = input(1.1, type=input.float, title="SMA LooseSqueeze Percent")
showIIRs = input(false, type=input.bool, title="═══════════════════ Show IIRs ═══════════════════")
iirRes = input(60, type=input.integer, title="IIR Resolution")
percentClose = input(title="IIR Squeeze PercentClose", type=input.float, defval=.8)
iirlength1 = input(title="IIR Length 1", type=input.integer, defval=34)
iirlength2 = input(title="IIR Length 2", type=input.integer, defval=144)//input(title="ATR Period", type=input.integer, defval=1)
iirlength3 = input(title="IIR Length 3", type=input.integer, defval=720)//input(title="ATR Period", type=input.integer, defval=1)
showIIR1 = input(true, type=input.bool, title="Show IIR1")
showIIR2 = input(true, type=input.bool, title="Show IIR2")
showIIR3 = input(true, type=input.bool, title="Show IIR3")
showCounts = input(true, type=input.bool, title="═════════════ Show Parabolic MA Counts ════════════")
showSignals = input(true, type=input.bool, title="══════════════ Show Buy/Sell Signals ══════════════")
showBackground = input(true, type=input.bool, title="══════════════ Show Background Colors ══════════════")
//runStrategy = input(true, type=input.bool, title="══════════════ Run Strategy  ══════════════")
debug = input(false, type=input.bool, title="══════════════ Show Debug ══════════════")

barLookbackPeriod = input(title="══ Bar Lookback Period ══", type=input.integer, defval=5)
percentageLookbackPeriod = input(title="══ Percentage Lookback Period ══", type=input.integer, defval=1)

bullcolor = color.green
bearcolor = color.red
color bgcolor = na

var bool slope1Green = na
var bool slope2Green = na
var bool slope3Green = na

var bool buySignal = na
var bool sellSignal = na
var bool bigbuySignal = na
var bool bigsellSignal = na
bool smbuySignal = false
bool smsellSignal = false
var bool insqueeze = na
var bool intightsqueeze = na
var bool infastsqueeze = na
var bool awaitingEntryIn = false

// My counting variables
var int count1 = 0
var float madist1 = 0
var int count2 = 0
var float madist2 = 0
var int sinceSmSignal = 0

var entryPrice = 0.0
var entryBarIndex = 0
var stopLossPrice = 0.0
// var updatedEntryPrice = 0.0
// var alertOpenPosition = false
// var alertClosePosition = false
// var label stopLossPriceLabel = na
// var line stopLossPriceLine = na
positionType = "LONG" // Strategy type, and the only current option

hasOpenPosition = strategy.opentrades != 0
hasNoOpenPosition = strategy.opentrades == 0

strategyClose() =>
    if (hasOpenPosition)
        if positionType == "LONG"
            strategy.close("LONG", when=true)
        else
            strategy.close("SHORT", when=true)
strategyOpen() =>
    if (hasNoOpenPosition)
        if positionType == "LONG"
            strategy.entry("LONG", strategy.long, when=true)
        else
            strategy.entry("SHORT", strategy.short, when=true)
checkEntry() =>
    buysignal = false
    if (hasNoOpenPosition)
        strategyOpen()
        buysignal := true
    // if (slope1Green and (trend1Green or trend2Green) and awaitingEntryIn and hasNoOpenPosition)
    //     strategyOpen()
    //     buysignal := true
    buysignal
checkExit() =>
    sellsignal = false
    // if (trend1Green == false and trend2Green == false) // to later have quicker exit strategy
    //     sellsignal := true
    //     strategyClose()
    if (hasOpenPosition)
        sellsignal := true
        strategyClose()
    sellsignal

multiplier(_adjRes, _adjLength) => // returns adjusted length
    multiplier = _adjRes/timeframe.multiplier
    round(_adjLength*multiplier)


//reset the var variables before new calculations
buySignal := false
sellSignal := false
smbuySignal := false
smsellSignal := false
bigbuySignal := false
bigsellSignal := false

ma1 = sma(close, multiplier(maRes, mal1))
ma2 = sma(close, multiplier(maRes, mal2))
ma3 = sma(close, multiplier(maRes, mal3))


madist1 := abs(ma1 - ma2)
madist2 := abs(ma1 - ma3) // check if MA's are fanning/going parabolic
if (ma1 >= ma2 and ma2 >= ma3 and madist1[0] > madist1[1]) //and abs(dataB - dataC >= madist2)  // dataA must be higher than b, and distance between gaining, same with C
    count1 := count1 + 1
else
    count1 := 0
if (ma1 <= ma2 and ma2 <= ma3 and madist1[0] > madist1[1])  //<= madist2 and dataB <= dataC) //and abs(dataB - dataC >= madist2)  // dataA must be higher than b, and distance between gaining, same with C
    count2 := count2 + 1
else
    count2 := 0


crossoverAB = crossover(ma1, ma2)
crossunderAB = crossunder(ma1, ma2)

plot(showFIBMAs ? ma1 : na, linewidth=3)
plot(showFIBMAs ? ma2 : na)
plot(showFIBMAs ? ma3 : na)


// Fast Squeese Check WORK IN PROGRESS
//
float singlePercent = close / 100
if max(madist1, madist2) <= singlePercent*loosePercentClose
    bgcolor := color.yellow
    infastsqueeze := true
else
    infastsqueeze := false


// IIR MOVING AVERAGE
f(a) => a[0] // fixes mutable error
iirma(iirlength, iirsrc) =>
    cf = 2*tan(2*3.14159*(1/iirlength)/2)
    a0 = 8 + 8*cf + 4*pow(cf,2) + pow(cf,3)
    a1 = -24 - 8*cf + 4*pow(cf,2) + 3*pow(cf,3)
    a2 = 24 - 8*cf - 4*pow(cf,2) + 3*pow(cf,3)
    a3 = -8 + 8*cf - 4*pow(cf,2) + pow(cf,3)
    //----
    c = pow(cf,3)/a0
    d0 = -a1/a0
    d1 = -a2/a0
    d2 = -a3/a0
    //----
    out = 0.
    out := nz(c*(iirsrc + iirsrc[3]) + 3*c*(iirsrc[1] + iirsrc[2]) + d0*out[1] + d1*out[2] + d2*out[3],iirsrc)
    f(out)


iirma1 = iirma(multiplier(iirRes, iirlength1), close)
iirma2 = iirma(multiplier(iirRes, iirlength2), close)
iirma3 = iirma(multiplier(iirRes, iirlength3), close)

// adjusts length for current resolution now, length is lengthened/shortened accordingly, upholding exact placement of lines
// iirmaD1 = security(syminfo.tickerid, tostring(iirRes), iirma1, barmerge.gaps_on, barmerge.lookahead_on)
// iirmaD2 = security(syminfo.tickerid, tostring(iirRes), iirma2, barmerge.gaps_on, barmerge.lookahead_on)
// iirmaD3 = security(syminfo.tickerid, tostring(iirRes), iirma3, barmerge.gaps_on, barmerge.lookahead_on)

slope1color = slope1Green ? color.lime : color.blue
slope2color = slope2Green ? color.lime : color.blue
slope3color = slope3Green ? color.lime : color.blue

plot(showIIR1 and showIIRs ? iirma1 : na, title="IIR1", color=slope1color, linewidth=2, transp=30)
plot(showIIR2 and showIIRs ? iirma2 : na, title="IIR2", color=slope2color, linewidth=3, transp=30)
plot(showIIR3 and showIIRs ? iirma3 : na, title="IIR3", color=slope3color, linewidth=4, transp=30)

// checks slope of IIRs to create a boolean variable and and color it differently
if (iirma1[0] >= iirma1[1])
    slope1Green := true
else
    slope1Green := false
if (iirma2[0] >= iirma2[1])
    slope2Green := true
else
    slope2Green := false
if (iirma3[0] >= iirma3[1])
    slope3Green := true
else
    slope3Green := false

// calculate space between IIRs and then if the price jumps above both
//float singlePercent = close / 100  // = a single percent
var float distIIR1 = na
var float distIIR2 = na
distIIR1 := abs(iirma1 - iirma2)
distIIR2 := abs(iirma1 - iirma3)

if (distIIR1[0] < percentClose*singlePercent and close[0] >= iirma1[0])
    if close[0] >= iirma2[0] and close[0] >= iirma3[0]
        bgcolor := color.green
        insqueeze := true
        intightsqueeze := true
    else
        bgcolor := color.lime
        insqueeze := true
        intightsqueeze := false
else
    insqueeze := false
    intightsqueeze := false


// if (true)//sinceSmSignal > 0) //  cutting down on fastest MAs noise
//     sinceSmSignal := sinceSmSignal + 1
//     if (crossoverAB)
//         //checkEntry()
//         //smbuySignal := true
//         sinceSmSignal := 0
//     if (crossunderAB) // and all NOT greennot (slope1Green and slope2Green and slope3Green)
//         //checkExit()
//         //smsellSignal := true
//         sinceSmSignal := 0
// else
//     sinceSmSignal := sinceSmSignal + 1


f_draw_infopanel(_x, _y, _line, _text, _color)=>
    _rep_text = ""
    for _l = 0 to _line
        _rep_text := _rep_text + "\n"
    _rep_text := _rep_text + _text
    var label _la = na
    label.delete(_la)
    _la := label.new(
         x=_x, y=_y,
         text=_rep_text, xloc=xloc.bar_time, yloc=yloc.price,
         color=color.black, style=label.style_labelup, textcolor=_color, size=size.normal)

posx = timenow + round(change(time)*60)
posy = highest(50)

// CONSTRUCTION ZONE
// TODO:  program way to eliminate noise and false signals
// MAYBEDO: program it to differentiate between a moving average bump and a cross
//          I think the best way would be to calculate the tangent line... OR
//          Take the slope of both going back a couple bars and if it's close enough, its a bounce off
//          and an excellent entry signal
// program in quickest exit, 2 bars next to eachother both closing under, as to avoid a single wick from
// prompting to close the trade
// Some other time, have it move SMA up or down depending on whether trending up or down.  Then use those MA crosses

//THIS CHECKS THE SLOPE FROM CURRENT PRICE TO BACK 10 BARS
checkSlope(_series) =>  (_series[0]/_series[10])*100 // it now returns it as a percentage

doNewX = input(true, type=input.bool, title="══════════ Show misc MA Cross Strategy ══════════")

iirX = input(555, title="IIRx Length: ", type=input.integer)
iirXperiod = input(30, title="IIRx Period/TF: ", type=input.integer)

iirX2 = input(13, title="IIRx2 Length: ", type=input.integer)
iirX2period = input(5, title="IIRx2 Period/TF: ", type=input.integer) //15

almaXperiod = input(defval=15, title="Alma of IIR1 Period: ", type=input.integer)
almaXalpha = input(title="Alma Alpha Value: ", defval=.7, maxval=.95, type=input.float) // dont forget to try .99
almaXsigma = input(title="Alma Sigma Value: ", defval=500, type=input.float)

iirmaOTF = iirma(multiplier(iirXperiod, iirX), close)
iirma2OTF = iirma(multiplier(iirX2period, iirX2), close)
smaOTF = alma(iirmaOTF, almaXperiod, almaXalpha, almaXsigma) // maybe dont touch, its precise  // I took the ALMA of the IIRMA, and i hope thats not cheating ;)

// I could have removed this.  the multiplier function adjusts the length to fit the current timeframe while displaying the same
// smaXOTF = security(syminfo.tickerid, smaXperiod, smaOTF, barmerge.gaps_on, barmerge.lookahead_on)
// iirmaXOTF = security(syminfo.tickerid, iirXperiod, iirmaOTF, barmerge.gaps_on, barmerge.lookahead_on)
// iirmaX2OTF = security(syminfo.tickerid, iirX2period, iirma2OTF, barmerge.gaps_on, barmerge.lookahead_on)
plot(doNewX ? smaOTF : na, title="FastMA X-Over :  ", color=color.blue, linewidth=1, transp=40)
plot(doNewX ? iirmaOTF : na, title="IIR MAx :  ", color=color.purple, linewidth=1, transp=30)
plot(doNewX ? iirma2OTF : na, title="IIR MAx :  ", color=color.purple, linewidth=2, transp=20)

iirma2Up = checkSlope(iirma2OTF) > 0 // just another slope up/down variable.

//calculate spaces between averages
distiiralma = abs(iirmaOTF - smaOTF)

crossoverFast = crossover(iirmaOTF, smaOTF) // and (iirmaOTF[1] <= smaOTF[1])
crossunderFast = crossunder(iirmaOTF, smaOTF) // and (iirmaOTF[1] >= smaOTF[1])

if (crossoverFast and iirma2Up == true and infastsqueeze == false and intightsqueeze == false) // and (count1 != 0))// or close[0] < (lowest(barLookbackPeriod) + singlePercent*3))) // must be at most a few percent up from a recent low.  Avoid buying highs :P
    buySignal := true
    strategyOpen()
    // if (slope1Green and slope2Green and slope3Green and infastsqueeze == false)
    //     checkEntry()
if (crossunderFast)
    sellSignal := true
    checkExit()

// I feel like I didn't cite the OG author for this panel correctly. I hope I did, but there are extentions of his/her work in multiple places.
// I could have gotten it confused.
if (debug)
    f_draw_infopanel(posx, posy, 18, "distiiralma from IIR: " + tostring(distiiralma), color.lime)
    //f_draw_infopanel(posx, posy, 16, "distiirs: " + tostring(distiirX1), color.lime)
    f_draw_infopanel(posx, posy, 14, "Value of iirmaOTF: " + tostring(iirmaOTF), color.lime)
    f_draw_infopanel(posx, posy, 6, "slope X: " + tostring(abs(100 - checkSlope(iirmaOTF))), color.lime)
    f_draw_infopanel(posx, posy, 12, "value of smaOTF: " + tostring(smaOTF), color.lime)
    f_draw_infopanel(posx, posy, 6, "slopeAlma: " + tostring(abs(100 - checkSlope(smaOTF))), color.lime)
    f_draw_infopanel(posx, posy, 2, "slopeIIR2 " + tostring(abs(100 - checkSlope(iirma2OTF))), color.lime)
    f_draw_infopanel(posx, posy, 2, "slopeIIR2 " + tostring(abs(100 - checkSlope(iirma2OTF))), color.lime)


// I kept this separate because it discludes the calculations.  Its hard to hold a train of thought while fishing for the right section
bgcolor(showBackground ? bgcolor : na)
plotshape(showSignals ? buySignal : na, location=location.bottom, style=shape.circle, text="", size=size.tiny, color=color.blue, transp=60)
plotshape(showSignals ? sellSignal : na, location=location.bottom, style=shape.circle, text="", size=size.tiny, color=color.red, transp=60)
plotchar(showSignals and smbuySignal, title="smBuy", location=location.belowbar, char='↑', size=size.tiny, color=color.green, transp=0)
plotchar(showSignals and smsellSignal, title="smSell", location=location.abovebar, char='↓', size=size.tiny, color=color.orange, transp=0)

// can not display a variable. Can only match the count to a corresponding plotchar
// to display a non-constant variable, use the debug box, which was so kindly offered up by our community.
plotchar(showCounts and count1==1, title='', char='1', location=location.belowbar, color=#2c9e2c, transp=0)
plotchar(showCounts and count1==2, title='', char='2', location=location.belowbar, color=#2c9e2c, transp=0)
plotchar(showCounts and count1==3, title='', char='3', location=location.belowbar, color=#2c9e2c, transp=0)
plotchar(showCounts and count1==4, title='', char='4', location=location.belowbar, color=#2c9e2c, transp=0)
plotchar(showCounts and count1==5, title='', char='5', location=location.belowbar, color=#2c9e2c, transp=0)
plotchar(showCounts and count1==6, title='', char='6', location=location.belowbar, color=#2c9e2c, transp=0)
plotchar(showCounts and count1==7, title='', char='7', location=location.belowbar, color=#2c9e2c, transp=0)
plotchar(showCounts and count1==8, title='', char='8', location=location.belowbar, color=#2c9e2c, transp=0)
plotchar(showCounts and count1==9, title='', char='9', location=location.belowbar, color=#2c9e2c, transp=0)
plotchar(showCounts and count1>=10, title='', char='$', location=location.belowbar, color=#2c9e2c, transp=0)

plotchar(showCounts and count2==1, title='', char='1', location=location.abovebar, color=#e91e63, transp=0)
plotchar(showCounts and count2==2, title='', char='2', location=location.abovebar, color=#e91e63, transp=0)
plotchar(showCounts and count2==3, title='', char='3', location=location.abovebar, color=#e91e63, transp=0)
plotchar(showCounts and count2==4, title='', char='4', location=location.abovebar, color=#e91e63, transp=0)
plotchar(showCounts and count2==5, title='', char='5', location=location.abovebar, color=#e91e63, transp=0)
plotchar(showCounts and count2==6, title='', char='6', location=location.abovebar, color=#e91e63, transp=0)
plotchar(showCounts and count2==7, title='', char='7', location=location.abovebar, color=#e91e63, transp=0)
plotchar(showCounts and count2==8, title='', char='8', location=location.abovebar, color=#e91e63, transp=0)
plotchar(showCounts and count2==9, title='', char='9', location=location.abovebar, color=#e91e63, transp=0)
plotchar(showCounts and count2>=10, title='', char='$', location=location.abovebar, color=#e91e63, transp=0)

showRSIind = input(true, type=input.bool, title="═══════════════════ Show RSI Arrows ═══════════════════")
// Get user input
rsiSource = input(title="RSI Source", type=input.source, defval=close)
rsiLength = input(title="RSI Length", type=input.integer, defval=14)
rsiOverbought = input(title="RSI Overbought Level", type=input.integer, defval=80)
rsiOversold = input(title="RSI Oversold Level", type=input.integer, defval=20)
// Get RSI value
rsiValue = rsi(rsiSource, rsiLength)
isRsiOB = rsiValue >= rsiOverbought
isRsiOS = rsiValue <= rsiOversold
// Plot signals to chart
plotshape(isRsiOB, title="Overbought", location=location.abovebar, color=color.red, transp=0, style=shape.triangledown)
plotshape(isRsiOS, title="Oversold", location=location.belowbar, color=color.green, transp=0, style=shape.triangleup)

//reset the var variables before new calculations
buySignal := false
sellSignal := false
smbuySignal := false
smsellSignal := false
bigbuySignal := false
bigsellSignal := false