개요
파워 필드 브레이크 전략은 이동 평균과 상대적으로 강한 지수를 기반으로 한 양적 거래 전략이다. 이 전략은 가격의 중요한 이동 평균을 깨는 것을 감지하여 시장의 추세 방향을 판단하고 RSI 지표와 결합하여 진입 시기를 결정한다. 핵심 아이디어는 가격이 이동 평균을 깨면 RSI 지표의 초과 오버 바이 신호에 보조하여 거래 신호를 발산하는 것이다.
전략 원칙
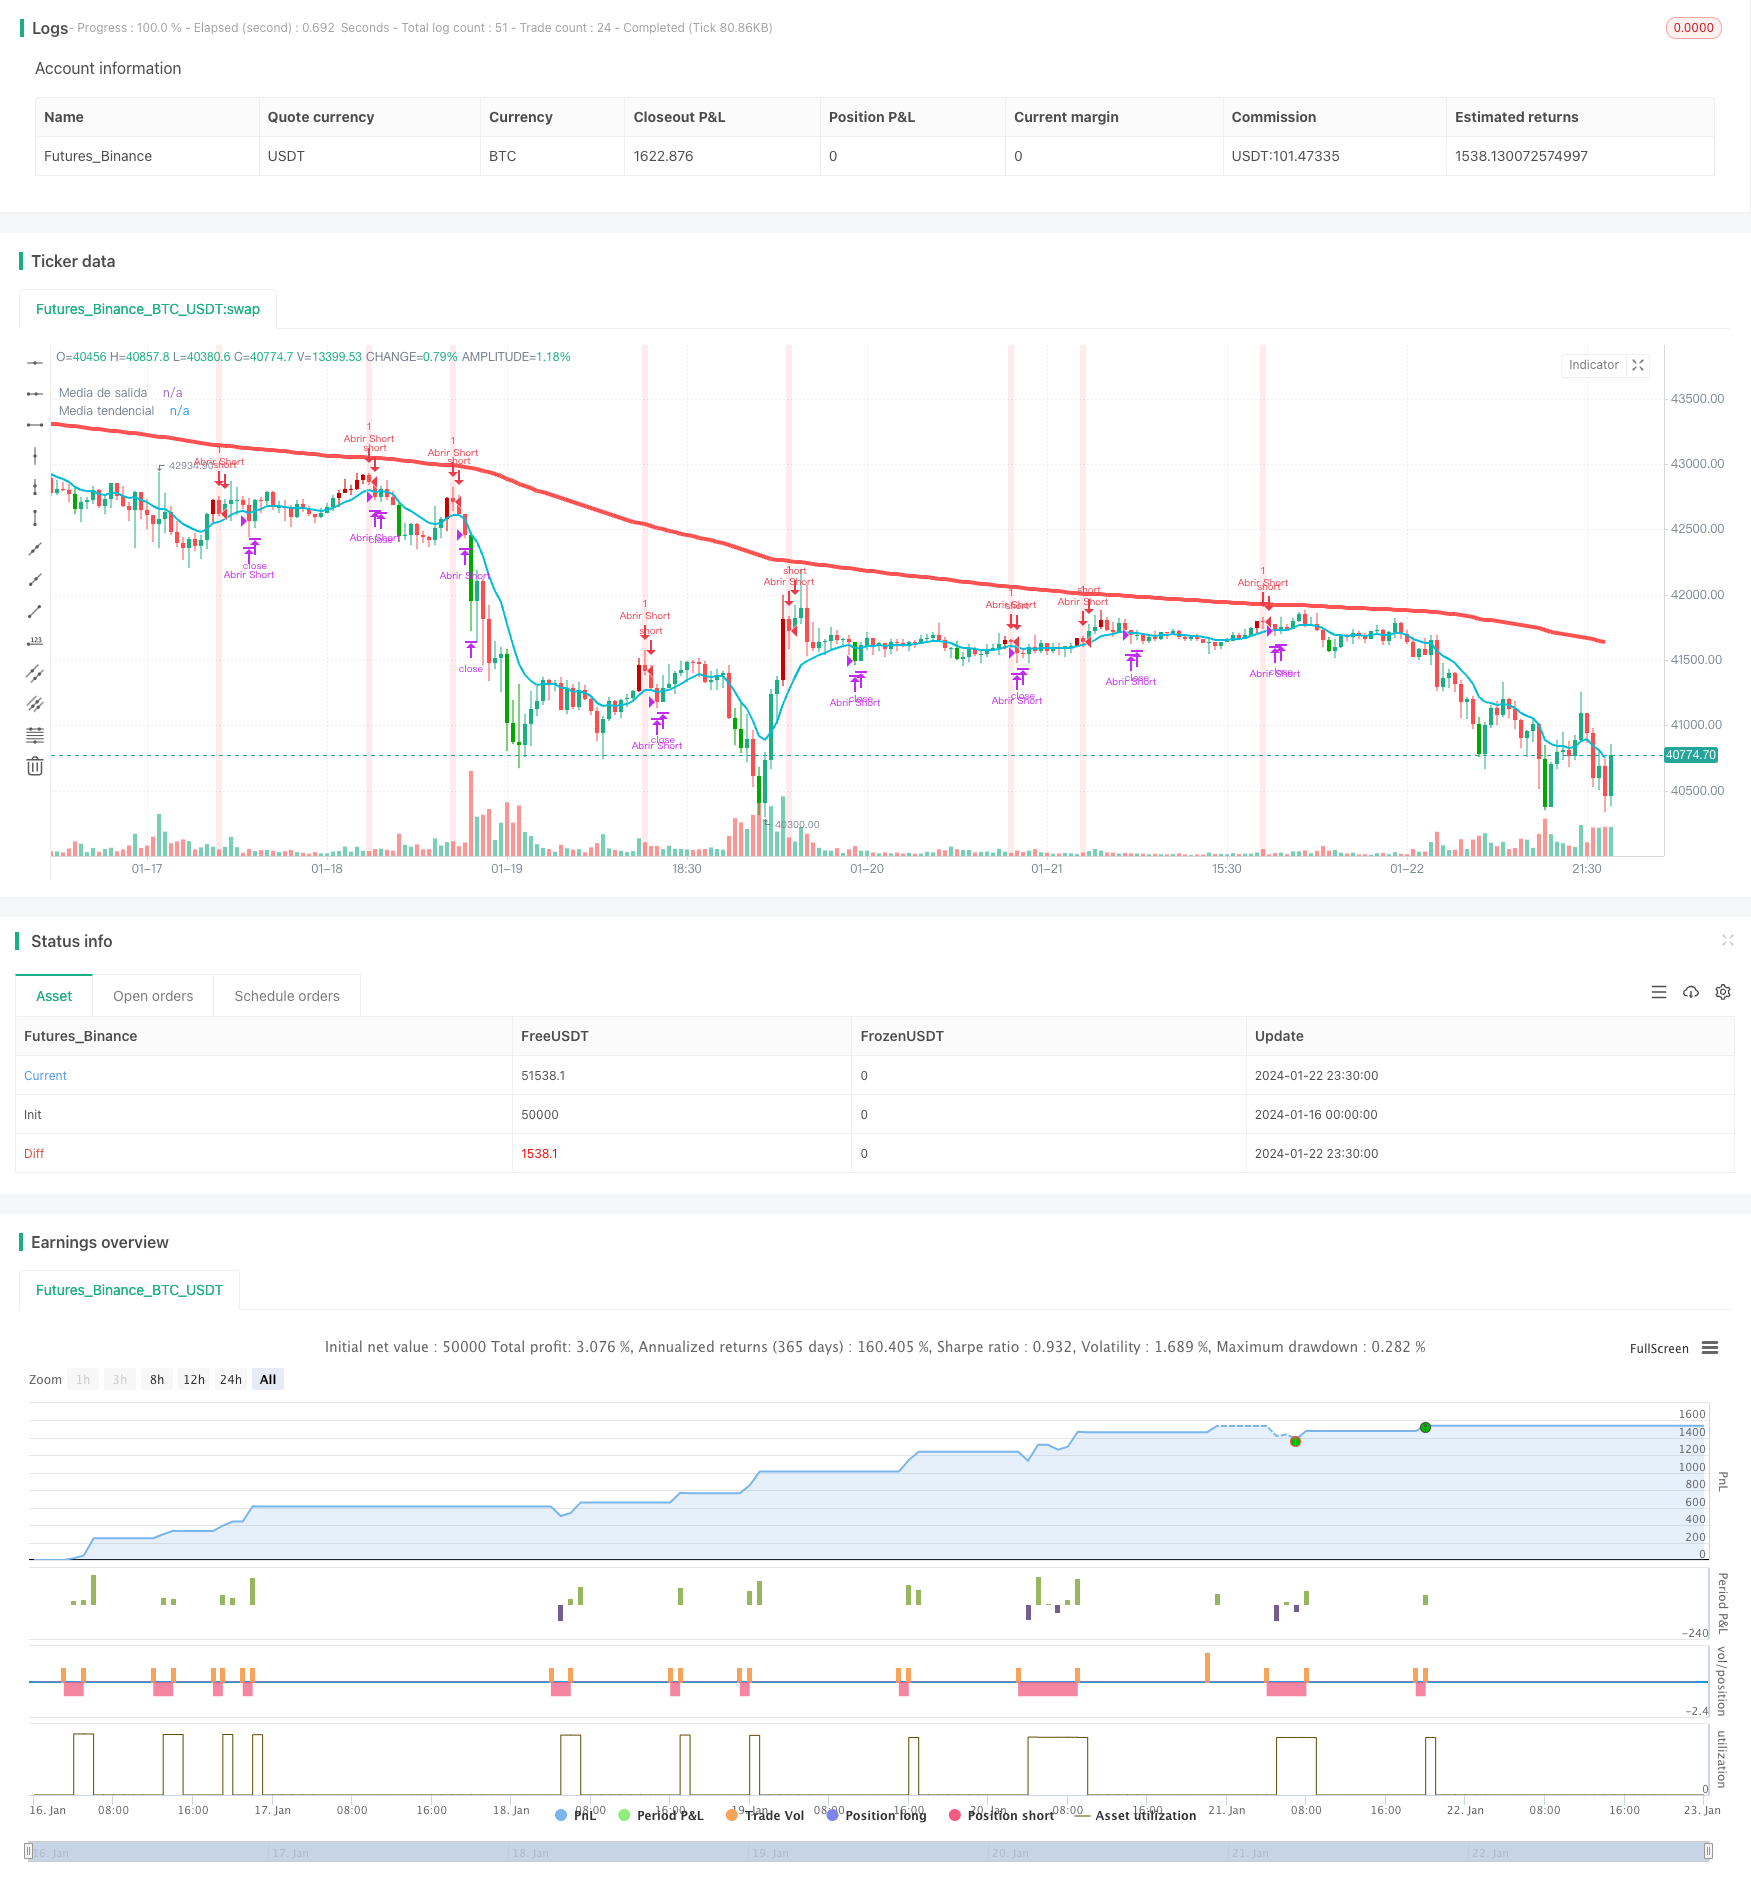
파워 필드 브레이킹 전략은 두 개의 이동 평균을 사용한다. 첫 번째는 10 주기의 EMA를 빠른 이동 평균으로, 두 번째는 200 주기의 EMA를 느린 이동 평균으로 사용한다. 빠른 라인은 현재 가격 추세를 나타내고, 느린 라인은 장기 가격 추세를 나타낸다. 가격이 상승하여 10 일 선을 돌파할 때 호불호 신호이며, 하락하여 10 일 선을 돌파할 때 호불호 신호이다.
이 전략은 또한 RSI 지표와 결합하여 특정 출입 시점을 결정합니다. 가격이 상승 추세에 있다면, RSI 낮은 지점이 빠른 이동 평균 아래있을 때 (RSI 지표가 5 미만일 때) 여러 신호를 냅니다. 가격이 하향 추세에 있다면, RSI 높은 지점이 빠른 이동 평균 위있을 때 (RSI 지표가 95 미만일 때) 휴식 신호를 냅니다.
더 많은 상장 후 손실을 막는 원칙은 가격이 10 일 선을 다시 넘어간다면 손실을 막는 것입니다.
전략적 강점 분석
이 전략의 가장 큰 장점은 트렌드 추적 능력이 강하다는 것입니다. 이동 평균은 자체적으로 좋은 트렌드 판단 기능을 가지고 있습니다. 전략은 빠른 느린 평균의 장점을 최대한 활용합니다. 빠른 라인은 단기 트렌드 방향을 판단하고 느린 라인은 장기 트렌드 방향을 판단합니다. 빠른 라인이 느린 라인을 돌파 할 때, 주가가 단기 및 장기적으로 상승 추세에 있음을 나타냅니다. 이것은 더 강한 구매 신호입니다.
RSI 지표의 추가는 전략의 장점을 증가시킵니다. RSI의 높은 낮은 점과 결합하면 과매매 과매매 현상이 발생했을 때 거래 신호를 효과적으로 발산하여 가능한 역전점에 진입하여 전략의 실전 효과를 강화합니다.
위험 분석
이 전략이 강한 트렌드 추적 능력을 가지고 있음에도 불구하고, 어떤 기술 지표 전략도 손실을 완전히 피할 수 없으며, 여전히 약간의 위험이 있습니다. 구체적으로 다음과 같은 위험이있을 수 있습니다:
- 가격의 급격한 변동이 있을 때, 이동 평균에서 생성된 거래 신호는 지연될 수 있다.
- RSI 지표는 오차가 발생하기 쉽고, 거래 신호 판단에 오류가 발생한다.
- 장기 운영에서, 잘못된 매개 변수는 과도한 거래로 이어질 수 있다.
위험을 줄이기 위해, 이동 평균 파라미터를 조정할 수 있으며, RSI 파라미터 조합을 최적화하고, 스톱 라인 거리를 적절히 완화하고, 포지션 크기를 합리적으로 제어합니다. 최적화 된 파라미터 조합은 재검토에서 충분히 검증되어야합니다.
전략 최적화 방향
이 전략에는 더 많은 최적화가 가능하며, 다음의 몇 가지 측면에 중점을 두고 있습니다.
적응형 이동 평균을 추가하고, 시장의 변동에 따라 이동 평균의 매개 변수를 자동으로 조정하여 더 유연하게 만듭니다.
부린 띠와 같은 변동률 지표가 추가되면, 가격의 급격한 변동에 대응할 수 있다.
기계 학습 알고리즘을 추가하여 AI 훈련을 통해 더 나은 배열과 거래 규칙을 얻으며 전략을 더 지능화하십시오.
다중 시장 포트폴리오는 테스트 샘플을 확대하고 다양한 시장에서 전략의 효과를 입증합니다.
기본적 분석 모듈을 도입하여 시장의 움직임을 판단하고 전략적 의사 결정에 기초를 제공합니다.
요약하다
파워 필드 브레이크 전략은 매우 실용적인 이동 평균 전략이다. 그것은 가격의 빠른 느린 평균선을 깨는 원칙을 사용하여 추세를 판단하고, RSI 지표에 의해 정확한 진입을 보조한다. 이 조합은 평균선과 초과 구매 초과 판매 지표의 장점을 충분히 발휘한다. 이 전략은 여러 시장에서 검증된, 수익은 안정적이며, 위험은 제어할 수 있으며, 추천할 만한 양적 거래 전략이다.
/*backtest
start: 2024-01-16 00:00:00
end: 2024-01-23 00:00:00
period: 30m
basePeriod: 15m
exchanges: [{"eid":"Futures_Binance","currency":"BTC_USDT"}]
*/

// This source code is subject to the terms of the Mozilla Public License 2.0 at https://mozilla.org/MPL/2.0/
// © JoseMetal
//@version=5

//== Constantes
c_blanco              = color.rgb(255, 255, 255, 0)
c_negro               = color.rgb(0, 0, 0, 0)
c_amarillo_radiactivo = color.rgb(255, 255, 0, 0)
c_cian_radiactivo     = color.rgb(0, 255, 255, 0)
c_verde_radiactivo    = color.rgb(0, 255, 0, 0)
c_verde               = color.rgb(0, 128, 0, 0)
c_verde_oscuro        = color.rgb(0, 80, 0, 0)
c_rojo_radiactivo     = color.rgb(255, 0, 0, 0)
c_rojo                = color.rgb(128, 0, 0, 0)
c_rojo_oscuro         = color.rgb(80, 0, 0, 0)
c_naranja_oscuro      = color.rgb(200, 120, 0, 0)
noneColor             = color.new(color.white, 100)
max_float             = 10000000000.0


//== Funciones

//== Declarar estrategia y período de testeo
strategy("Estrategia Larry Connors", shorttitle="Estrategia Larry Connors", overlay=true)
fecha_inicio     = input(timestamp("1 Jan 2000"), title="• Fecha de inicio", group="Período de pruebas", inline="periodo_de_pruebas")
vela_en_fecha    = true
posicion_abierta = strategy.position_size != 0
LONG_abierto     = strategy.position_size > 0
SHORT_abierto    = strategy.position_size < 0

GRUPO_P           = "Posiciones"
P_permitir_LONGS  = input.bool(title="LONGS", group=GRUPO_P, defval=true, inline="posiciones")
P_permitir_SHORTS = input.bool(title="SHORTS", group=GRUPO_P, defval=true, inline="posiciones")

GRUPO_general = "General"
mostrar_color_velas = input.bool(title="Colorear velas", defval=true, group=GRUPO_general)


//== Inputs de indicadores
// Medias móviles simples
GRUPO_SMAs = "SMAs"
SMA_1_fuente = input.source(title="• (Media de salida) Fuente / Long.", group=GRUPO_SMAs, defval=close, inline="sma_1")
SMA_1_length = input.int(title="", group=GRUPO_SMAs, defval=10, minval=1, inline="sma_1")
SMA_2_fuente = input.source(title="• (Media tendencial) Fuente / Long.", group=GRUPO_SMAs, defval=close, inline="sma_2")
SMA_2_length = input.int(title="", group=GRUPO_SMAs, defval=200, minval=1, inline="sma_2")
SMA_1        = ta.ema(SMA_1_fuente, SMA_1_length)
SMA_2        = ta.ema(SMA_2_fuente, SMA_2_length)

// RSI
GRUPO_RSI    = "RSI"
RSI_src      = input.source(title="• Fuente / Longitud", group=GRUPO_RSI, defval=close, inline="rsi_calc")
RSI_length   = input.int(title="", group=GRUPO_RSI, defval=2, minval=1, inline="rsi_calc")
RSI          = ta.rsi(RSI_src, RSI_length)
RSI_nivel_os = input.int(title="• Sobreventa / Sobrecompra", group=GRUPO_RSI, defval=5, minval=0, maxval=99, inline="rsi_niveles")
RSI_nivel_ob = input.int(title="", group=GRUPO_RSI, defval=95, minval=1, maxval=100, inline="rsi_niveles")


//== Cálculo de condiciones
cierre_sobre_SMA_1 = close > SMA_1
tendencia_alcista  = close > SMA_2
RSI_en_sobreventa  = RSI < RSI_nivel_os
RSI_en_sobrecompra = RSI > RSI_nivel_ob


//== Entrada (deben cumplirse todas para entrar)
LONG_condition_1    = tendencia_alcista
LONG_condition_2    = not cierre_sobre_SMA_1 // Vela con cierre bajo la media rápida
LONG_condition_3    = RSI_en_sobreventa[1] and not RSI_en_sobreventa // Sobreventa en la vela anterior y ya no en la actual
all_LONG_conditions = LONG_condition_1 and LONG_condition_2 and LONG_condition_3
entrar_en_LONG      = P_permitir_LONGS and all_LONG_conditions and vela_en_fecha and not LONG_abierto

SHORT_condition_1    = not tendencia_alcista
SHORT_condition_2    = cierre_sobre_SMA_1 // Vela con cierre sobre la media rápida
SHORT_condition_3    = RSI_en_sobrecompra[1] and not RSI_en_sobrecompra // Sobrecompra en la vela anterior y ya no en la actual
all_SHORT_conditions = SHORT_condition_1 and SHORT_condition_2 and SHORT_condition_3
entrar_en_SHORT      = P_permitir_SHORTS and all_SHORT_conditions and vela_en_fecha and not SHORT_abierto

if (entrar_en_LONG)
    strategy.entry("Abrir Long", strategy.long)

if (entrar_en_SHORT)
    strategy.entry("Abrir Short", strategy.short)


//== Salida
exit_LONG_conditions  = cierre_sobre_SMA_1
exit_SHORT_conditions = not cierre_sobre_SMA_1


if (LONG_abierto and exit_LONG_conditions)
    strategy.close("Abrir Long")

if (SHORT_abierto and exit_SHORT_conditions)
    strategy.close("Abrir Short")


//== Ploteo en pantalla
// SMAs
plot(SMA_1, "Media de salida", color=color.aqua, linewidth=2)
plot(SMA_2, "Media tendencial", color=tendencia_alcista ? color.green : color.red, linewidth=4)

// Color de fondo
bgcolor = entrar_en_LONG ? color.new(color.green, 85) : entrar_en_SHORT ? color.new(color.red, 85) : color.new(color.black, 100)
bgcolor(bgcolor)

// Color de las velas según sobrecompra/sobreventa del RSI
color_velas = mostrar_color_velas ? (RSI_en_sobreventa ? #00a800 : RSI_en_sobrecompra ? #ca0000 : na) : na
barcolor(color_velas)