개요
쌍평선 트렌드 추적 전략은 빠른 이동 평균과 느린 이동 평균의 조합을 사용하여 시장의 흐름을 판단하고 트렌드 방향이 변하면 거래 신호를 발산하는 전략이다. 이 전략은 평선 지표와 가격 통로 지표를 동시에 결합하여 흐름을 식별하여 시장 소음을 효과적으로 필터링하여 트렌드 방향을 판단 할 수 있습니다.
전략 원칙
쌍평준 트렌드 추적 전략은 두 가지 이동 평균 지표인 빠른 이동 평균 ((5주기) 와 느린 이동 평균 ((21주기) 을 사용합니다. 빠른 평균은 거래 신호를 생성하고 느린 평균은 시장의 추세 방향을 판단합니다. 빠른 평균이 아래에서 위로 느린 평균을 통과하면 구매 신호를 생성합니다. 빠른 평균이 위에서 아래로 느린 평균을 통과하면 판매 신호를 생성합니다.
이 전략은 또한 가격 채널 지표를 사용하여 동시 추세를 판단합니다. 가격 채널은 최고 가격과 최저 가격의 이동 평균으로 결정됩니다. 가격이 채널을 뚫을 때, 추세가 역전되는 것을 나타냅니다. 이 전략은 두 가지 가격 채널을 사용합니다. 첫 번째 가격 채널 주기는 21이며 두 번째 가격 채널 주기는 5입니다.
구매 및 판매 신호를 판단할 때, 이 전략은 빨간 기둥이 연속적으로 나타나도록 요구한다 ((사용자가 설정할 수 있는 기둥의 수), 추가적인 필터링 조건으로. 이것은 정렬 영역에서 잘못된 신호를 발산하는 것을 피할 수 있다.
전체적으로, 이중 평행선 트렌드 추적 전략의 추세를 판단하는 논리는 다음과 같습니다.
- 가격 통로를 사용하여 대차 트렌드 방향을 판단합니다.
- 빠른 평균선을 사용하여 단기 트렌드를 판단하고 거래 신호를 발산합니다.
- 추가적인 기둥 필터와 결합하여 정렬에서 잘못된 신호를 방지합니다.
트렌드 판단의 여러 레벨을 통해, 노이즈를 효과적으로 필터링하여 트렌드 방향을 결정할 수 있다.
우위 분석
이중 평행선 트렌드 추적 전략은 다음과 같은 장점이 있습니다.
- 트렌드를 효과적으로 식별하고 주요 트렌드 방향을 판단할 수 있습니다.
- 빠른 평행선은 트레이드 신호를 발산하여 트렌드 반전을 적시에 잡을 수 있습니다.
- 가격 통로에서 대폭의 추세를 판단하여 단기 시장 소음으로 오해하지 마십시오.
- 적색/녹색 기둥 필터링 조건은 회전 영역에서 잘못된 신호를 발산할 확률을 줄일 수 있습니다.
- 전략 매개 변수는 조정할 수 있으며, 다양한 시장에 맞게 매개 변수를 조정하여 전략의 안정성을 높일 수 있습니다.
- 매 거래의 위험을 효과적으로 제어할 수 있는 스톱로스 전략이 추가될 수 있습니다.
이 전략은 전체적으로 안정성이 좋으며, 큰 추세 시장에서 뛰어난 성과를 거두었습니다.
위험 분석
이중 평행선 트렌드 추적 전략에는 다음과 같은 위험도 있습니다.
- 시장이 장기적으로 정리될 때, 잘못된 신호가 발생하기 쉽고, 이로 인해 연속적으로 소액 손실이 발생할 수 있습니다.
- 전략 파라미터가 설정되지 않아 거래 신호가 늦어지고 최적의 입시 시기를 놓칠 수 있습니다.
- 효율적인 스톱 손실 전략이 없는 한, 단일 거래의 위험은 통제하기 어렵습니다.
대응적으로, 전략적 위험을 줄이는 방법은 다음과 같습니다.
- 적색/녹색 기둥 필터링 조건을 조정하여 평형 시장에서 거래 빈도를 낮추기
- 신속한 평균 변수를 최적화하여 거래 신호를 적시에 보장합니다.
- 이동 중지 또는 비율 중지 전략을 추가하고 단편 손실을 엄격하게 제어합니다.
최적화 방향
이중 평행선 트렌드 추적 전략에는 더 많은 최적화가 가능합니다. 주요 방향은 다음과 같습니다:
- ATR과 같은 변동률 지표와 함께 자동으로 스톱 손실을 조정합니다.
- 기계 학습을 사용하여 정책 변수를 자동으로 최적화합니다.
- 트렌드 방향을 판단하는 뉴런 네트워크 모듈을 추가합니다.
- 다양한 지표와 필터링 조건을 통합하여 전략 포트폴리오를 구성합니다.
이러한 최적화 방향은 전략의 안정성, 적응성 및 지능화 수준을 더욱 높일 수 있습니다.
요약하다
쌍평선 트렌드 추적 전략은 전체적으로 좀 더 탄탄한 트렌드 추적 전략이다. 그것은 동시에 평선 지표와 가격 통로를 결합하여 트렌드 방향과 강도를 판단하고 빠른 평선으로 거래 신호를 발송한다. 추가로 추가된 기둥 모양 필터 조건은 또한 잘못된 신호를 추가로 방지 할 수 있다. 이 전략의 매개 변수는 조정 가능하며, 다른 시장 환경에 잘 적응할 수 있다. 또한 최적화 할 수있는 큰 공간을 남겨두고 신뢰할 수 있고 지능적인 자동 거래 전략을 만들 잠재력을 가지고있다.
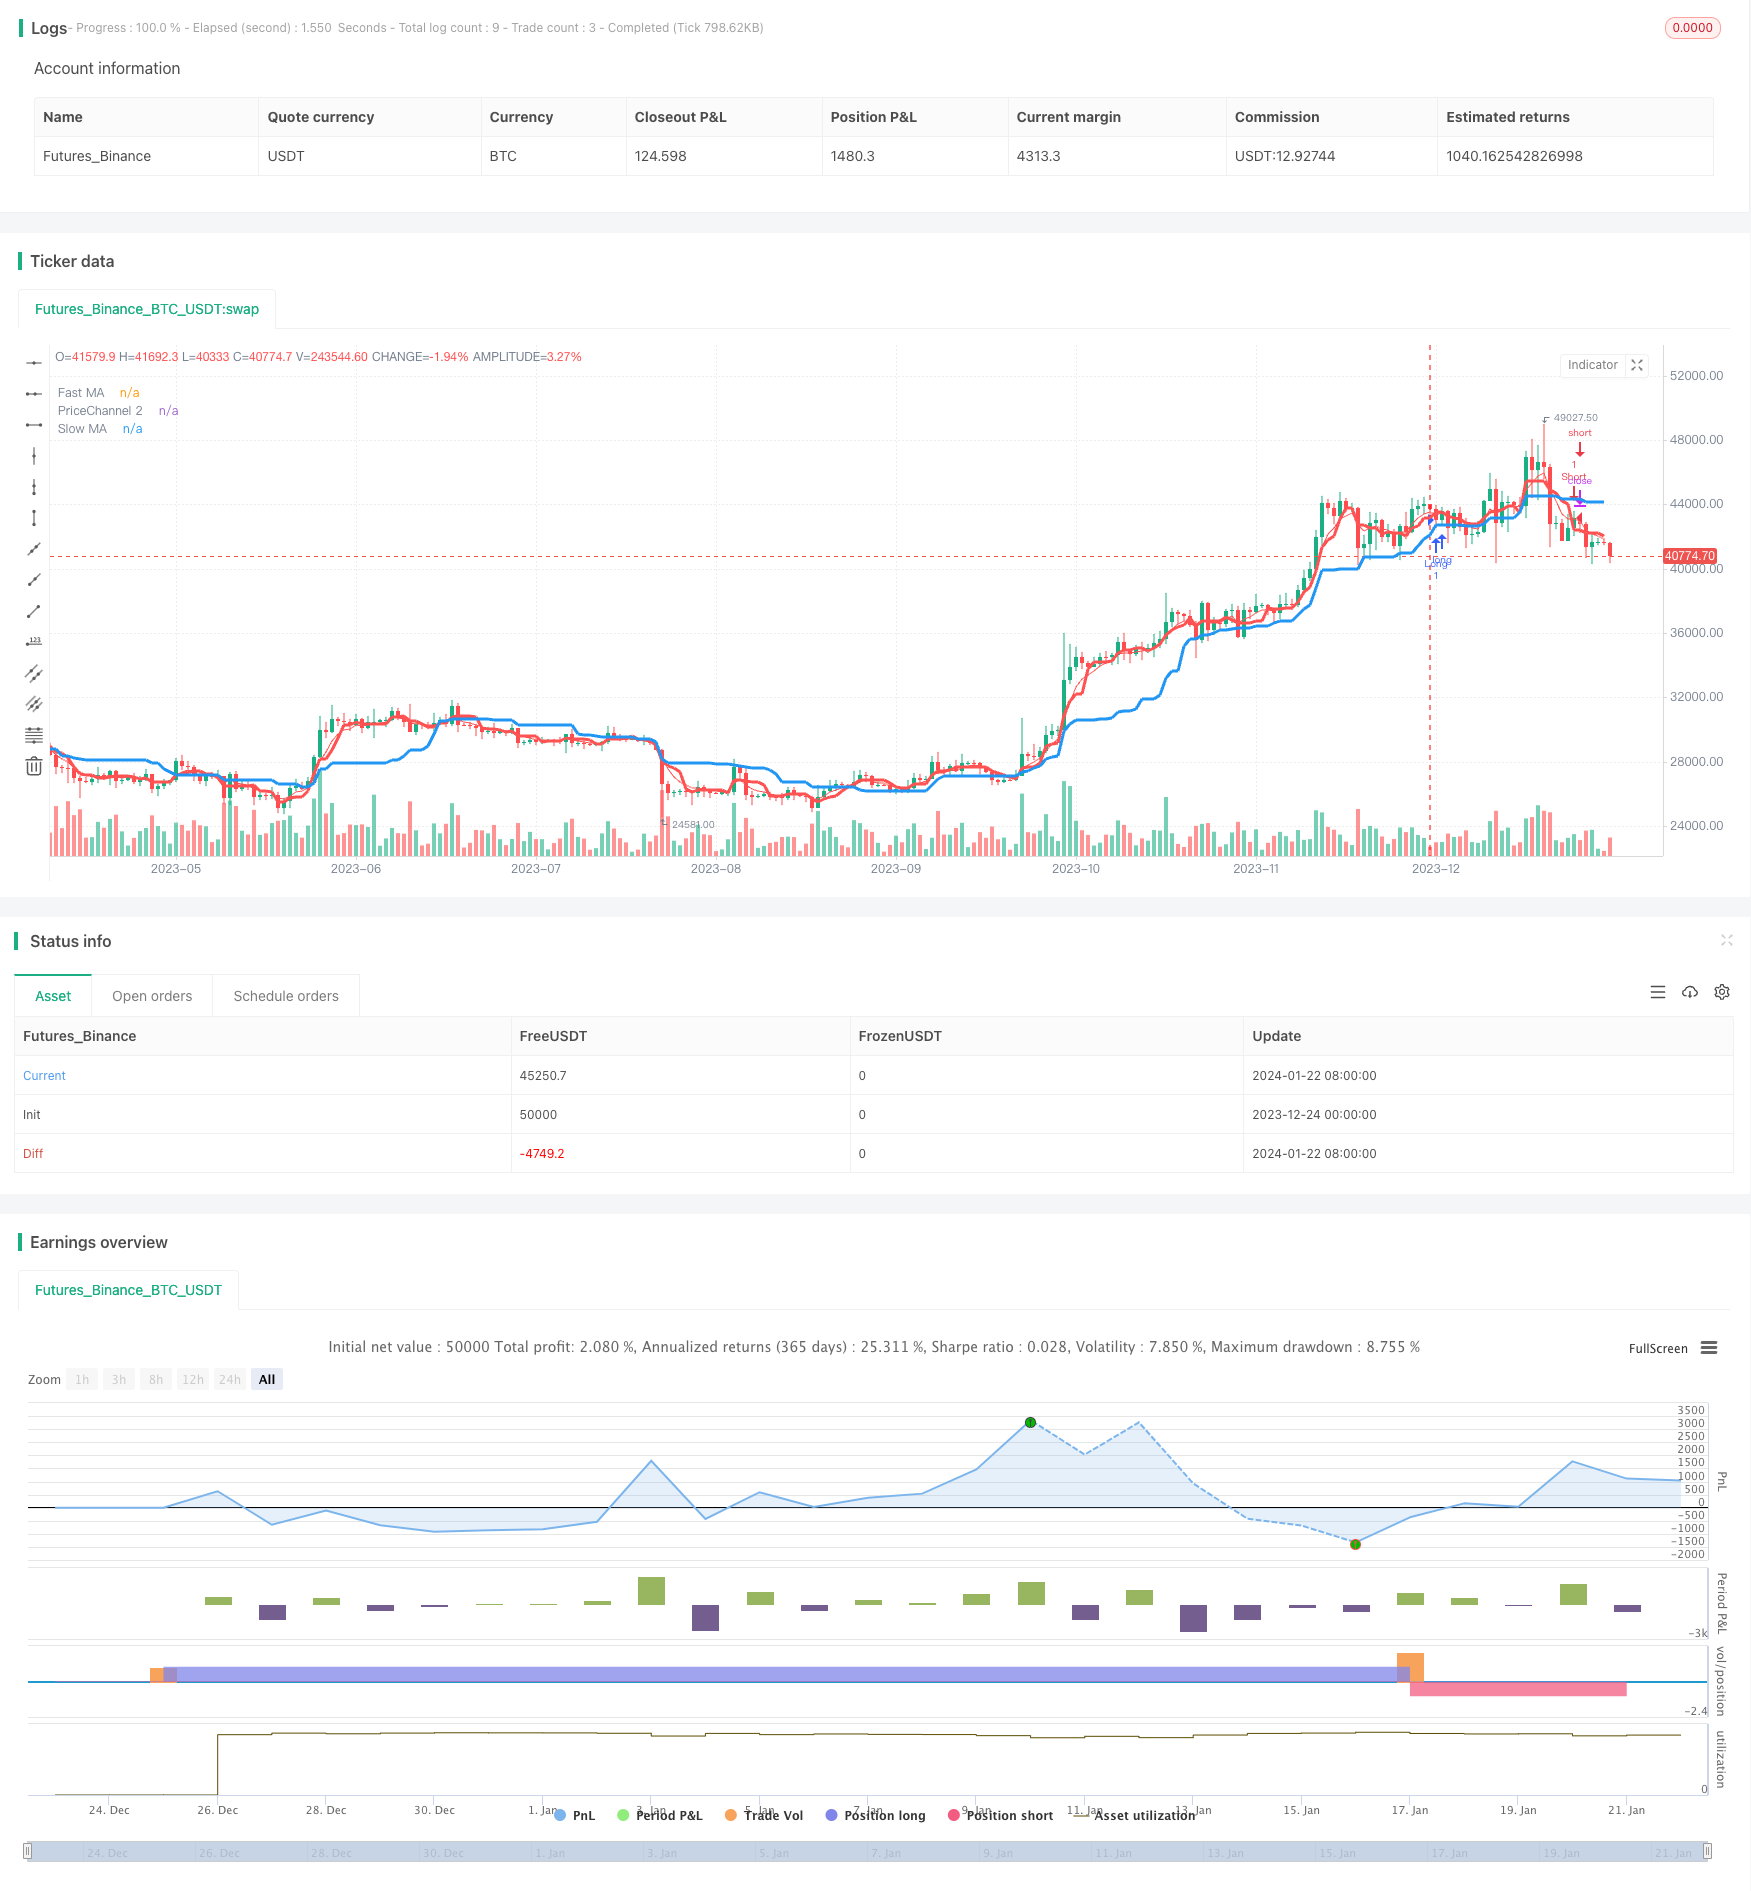
/*backtest
start: 2023-12-24 00:00:00
end: 2024-01-23 00:00:00
period: 1d
basePeriod: 1h
exchanges: [{"eid":"Futures_Binance","currency":"BTC_USDT"}]
*/

//@version=2
strategy(title = "Noro's Trend MAs Strategy v1.8", shorttitle = "Trend MAs str 1.8", overlay=true, default_qty_type = strategy.percent_of_equity, default_qty_value=100.0, pyramiding=0)

//Settings
needlong = input(true, "long")
needshort = input(true, "short")
needstops = input(false, "stops")
stoppercent = input(5, defval = 5, minval = 1, maxval = 50, title = "Stop, %")
useohlc4 = input(false, defval = false, title = "Use OHLC4")
usefastsma = input(true, "Use fast MA Filter")
fastlen = input(5, defval = 5, minval = 1, maxval = 50, title = "fast MA Period")
slowlen = input(21, defval = 20, minval = 2, maxval = 200, title = "slow MA Period")
bars = input(2, defval = 2, minval = 0, maxval = 3, title = "Bars Q")
needbg = input(false, defval = false, title = "Need trend Background?")
needarr = input(false, defval = false, title = "Need entry arrows?")

src = useohlc4 == true ? ohlc4 : close
fastsma = ema(src, 5)

//PriceChannel 1
lasthigh = highest(src, slowlen)
lastlow = lowest(src, slowlen)
center = (lasthigh + lastlow) / 2

//PriceChannel 2
lasthigh2 = highest(src, fastlen)
lastlow2 = lowest(src, fastlen)
center2 = (lasthigh2 + lastlow2) / 2

//Trend
//ma = type == 1 ? sma(src, len) : type == 2 ? ema(src, len) : type == 3 ? vwma(src, len) : type == 4 ? dema : type == 5 ? tema : type == 6 ? kama : type == 7 ? center : 0
//trend = low > ma and low[1] > ma[1] and low[2] > ma[2] ? 1 : high < ma and high[1] < ma[1] ? -1 : trend[1]

trend1 = low > center and low[1] > center[1] ? 1 : high < center and high[1] < center[1] ? -1 : trend1[1]
trend2 = low > center2 and low[1] > center2[1] ? 1 : high < center2 and high[1] < center2[1] ? -1 : trend1[1]
trend = trend1 == 1 and trend2 == 1 ? 1 : trend2 == -1 and trend2 == -1 ? -1 : trend[1]

//Bars
bar = close > open ? 1 : close < open ? -1 : 0
redbars = bars == 0 ? 1 : bars == 1 and bar == -1 ? 1 : bars == 2 and bar == -1 and bar[1] == -1 ? 1 : bars == 3 and bar == -1 and bar[1] == -1 and bar[2] == -1 ? 1 : 0
greenbars = bars == 0 ? 1 : bars == 1 and bar == 1 ? 1 : bars == 2 and bar == 1 and bar[1] == 1 ? 1 : bars == 3 and bar == 1 and bar[1] == 1 and bar[2] == 1 ? 1 : 0

//Signals
up = trend == 1 and (low < center2 or usefastsma == false) and (redbars == 1) ? 1 : 0
dn = trend == -1 and (high > center2 or usefastsma == false) and (greenbars == 1) ? 1 : 0

//Lines
colorfastsma = usefastsma == true ? red : na
plot(fastsma, color = colorfastsma, title = "Fast MA")
plot(center, color = blue, linewidth = 3, transp = 0, title = "Slow MA")
plot(center2, color = red, linewidth = 3, transp = 0, title = "PriceChannel 2")

//Arrows
plotarrow(up == 1 and needarr == true ? 1 : 0, colorup = black, colordown = black, transp = 0)
plotarrow(dn == 1 and needarr == true ? -1 : 0, colorup = black, colordown = black, transp = 0)

//Background
col = needbg == false ? na : trend == 1 ? lime : red
bgcolor(col, transp = 90)

//Alerts
alertcondition(up == 1, title='buy', message='Uptrend')
alertcondition(dn == 1, title='sell', message='Downtrend')

//Trading
stoplong = up == 1 and needstops == true ? close - (close / 100 * stoppercent) : stoplong[1]
stopshort = dn == 1 and needstops == true ? close + (close / 100 * stoppercent) : stopshort[1]

longCondition = up == 1
if (longCondition)
    strategy.entry("Long", strategy.long, needlong == false ? 0 : na)
    strategy.exit("Stop Long", "Long", stop = stoplong)

shortCondition = dn == 1
if (shortCondition)
    strategy.entry("Short", strategy.short, needshort == false ? 0 : na)
    strategy.exit("Stop Short", "Short", stop = stopshort)