개요
이 전략은 주로 상대적으로 강하고 약한 지표 ((RSI) 와 부린 띠에 대한 거래 신호 판단을 사용합니다. 구체적으로, RSI 낮은 지표가 부린 띠 아래로 교차 할 때 더 많이하고, RSI 높은 지표가 부린 띠 위로 교차 할 때 공백합니다.
전략 원칙
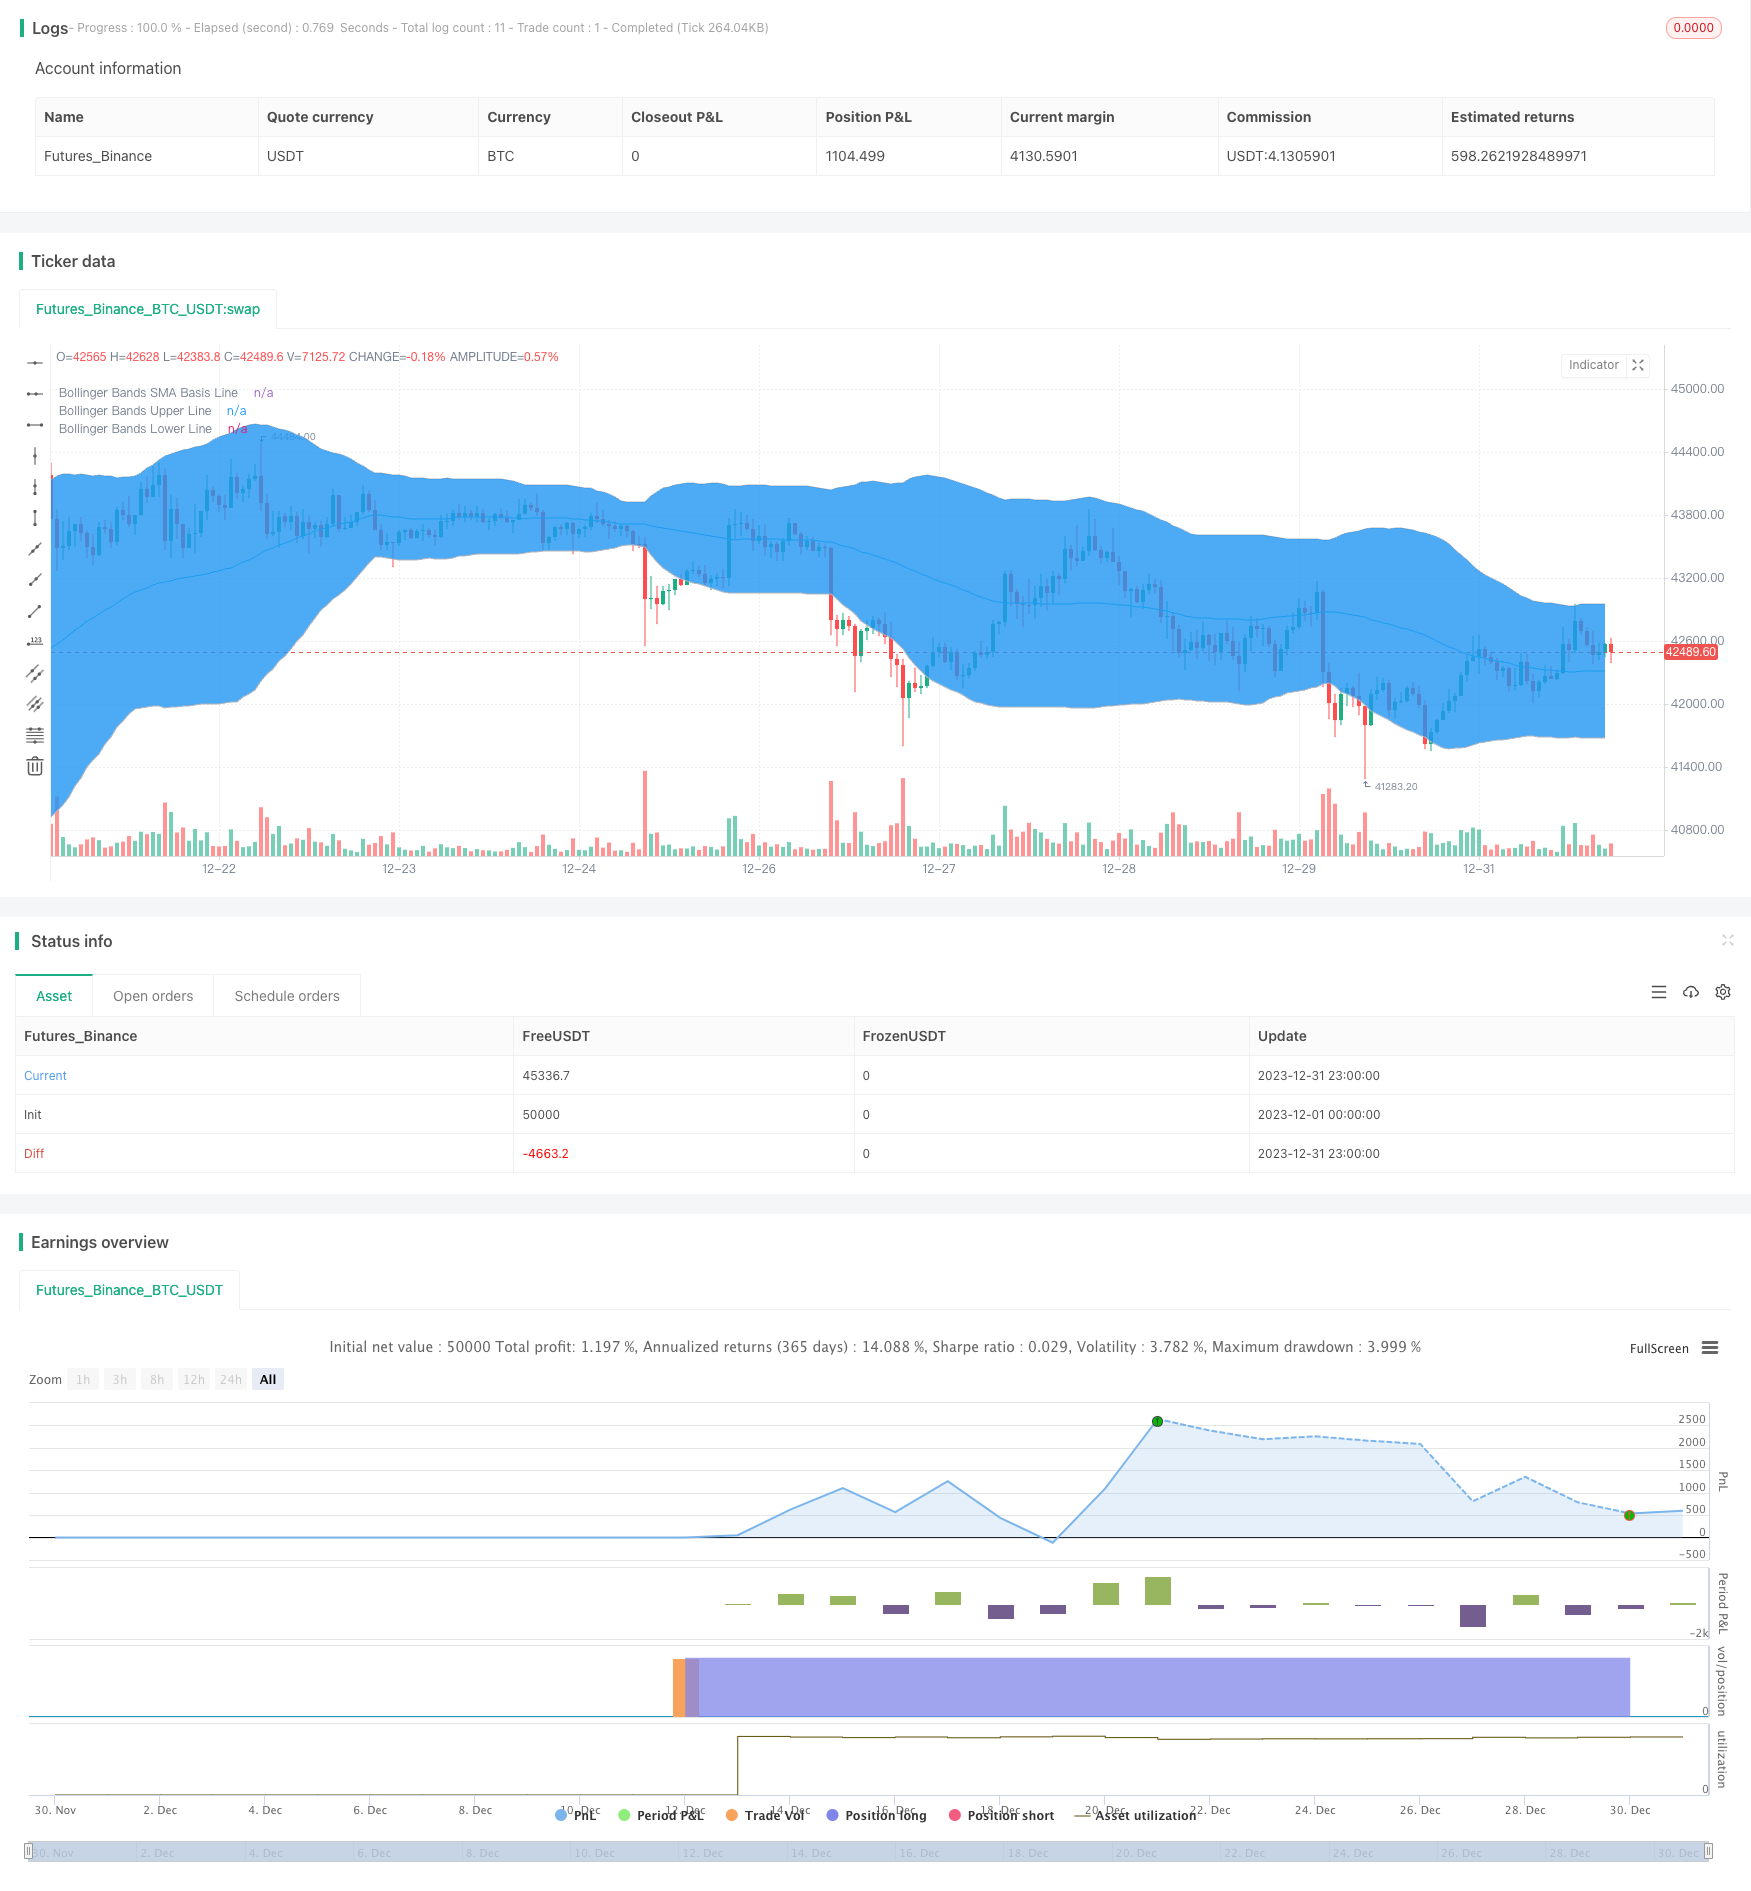
이 전략은 먼저 RSI 지표와 브린띠를 계산한다. RSI 지표는 거래 상품의 상대적인 강점을 반영하며, RSI가 초상조 (Default) 30보다 낮을 때 거래 상품이 초상조 (OverSold) 에 있음을 나타내고, 이 때 구매한다. 브린띠는 상반도, 중반도, 하반도를 포함하며, 가격의 변동 범위를 잘 반영한다. 브린띠는 하반도 근처에서 구매하고 상반도 근처에서 판매하여 비교적 안정적인 신호를 얻을 수 있다. 이 전략은 RSI 지표와 브린띠를 결합하여 거래 신호를 판단하고, RSI 지표는 상반도 상반에서 상반도 상반으로 상승할 때 구매 신호를 발생시키고, 가격은 브린띠 아래에서 상승하여 브린띠의 하반도로 상승할 때 구매 신호를 발생시키고, 가격은 브린띠 상반도에서 상반도로 내려가면 판매 신호를 발생시킨다.
전략적 이점
- RSI와 브린 밴드를 결합하여 신호 판단의 정확성을 향상시킵니다.
- RSI 지표가 일부 잡음 신호를 필터링합니다.
- 브린 띠는 현재 시장 변동의 큰 범위를 반영하고 신호는 더 신뢰할 수 있습니다.
- 거래 전략이 엄격하여 무효 거래가 발생하지 않습니다.
전략적 위험
- 부린밴드 파라미터를 잘못 설정하면 거래 신호가 정확하지 않을 수 있습니다.
- RSI 오버 바이 오버 셀 영역 파라미터 설정이 부적절하면 신호 판단에도 영향을 줄 수 있습니다.
- “전략이 엄격하기 때문에 거래 기회를 놓칠 수 있습니다”.
위험 해결 방법:
- 브린 대역과 RSI 대역을 최적화하여 최적의 조합을 찾습니다.
- 적절히 느슨한 거래 조건 전략, 더 많은 기회를 얻기 위해 유효하지 않은 거래의 양을 늘립니다.
전략 최적화 방향
- RSI 변수와 브린 밴드 변수를 테스트하고 최적화하여 최적의 변수를 찾습니다.
- 거래 위험을 통제하기 위한 손실을 막는 전략을 강화합니다.
- MACD와 같은 다른 기술 지표에 신호 검증을 추가하는 것을 고려하십시오.
- 다양한 품종과 시간 주기의 파라미터 최적화 효과를 테스트합니다.
요약하다
이 전략은 전체적으로 안정적이며, RSI 지표와 브린 밴드 스톱을 효과적으로 결합한다. 매개 변수의 테스트 및 최적화를 통해 전략의 효과를 더욱 높일 수 있다. 또한, 더 엄격한 전략으로 인해 발생할 수 있는 신호 손실 위험을 경계할 필요가 있다. 전체적으로 이 전략은 신뢰할 수 있는 양적 거래 전략이다.
전략 소스 코드
/*backtest
start: 2023-12-01 00:00:00
end: 2023-12-31 23:59:59
period: 1h
basePeriod: 15m
exchanges: [{"eid":"Futures_Binance","currency":"BTC_USDT"}]
*/

//@version=2
strategy("BB + RSI 20MIN,", shorttitle="BBRSI 20MIN", overlay=true )

     // Strategy Tester Start Time
sYear = input(2019, title = "Start Year")
sMonth = input(04, title = "Start Month", minval = 01, maxval = 12)
sDay = input(01, title = "Start Day", minval = 01, maxval = 31)
sHour = input(00, title = "Start Hour", minval = 00, maxval = 23)
sMinute = input(00, title = "Start Minute", minval = 00, maxval = 59)
startTime = true


///////////// RSI
RSIlength = input(9,title="RSI Period Length")
RSIoverSold = input(30, minval=1,title="RSIL")
RSIoverBought = input(69, minval=1,title="RSIh")
price = open
vrsi = rsi(price, RSIlength)


///////////// Bollinger Bands
BBlength = input(60, minval=1,title="Bollinger Period Length")
BBmult = input(2.0, minval=0.001, maxval=50,title="Bb")
BBbasis = sma(price, BBlength)
BBdev = BBmult * stdev(price, BBlength)
BBupper = BBbasis + BBdev
BBlower = BBbasis - BBdev
source = close
buyEntry = crossover(source, BBlower)
sellEntry = crossunder(source, BBupper)
plot(BBbasis, color=aqua,title="Bollinger Bands SMA Basis Line")
p1 = plot(BBupper, color=silver,title="Bollinger Bands Upper Line")
p2 = plot(BBlower, color=silver,title="Bollinger Bands Lower Line")
fill(p1, p2)


///////////// Colors
switch1=input(true, title="Enable Bar Color?")
switch2=input(true, title="Enable Background Color?")
TrendColor = RSIoverBought and (price[1] > BBupper and price < BBupper) and BBbasis < BBbasis[1] ? red : RSIoverSold and (price[1] < BBlower and price > BBlower) and BBbasis > BBbasis[1] ? green : na
barcolor(switch1?TrendColor:na)
bgcolor(switch2?TrendColor:na,transp=50)


///////////// RSI + Bollinger Bands Strategy
if (not na(vrsi))

    if (crossover(vrsi, RSIoverSold) and crossover(source, BBlower))
        strategy.entry("RSI_BB_L", strategy.long and startTime, stop=BBlower,  comment="RSI_BB_L")
    else
        strategy.cancel(id="RSI_BB_L")

    if (crossunder(vrsi, RSIoverBought) and crossunder(source, BBupper))
        strategy.entry("RSI_BB_S", strategy.short and startTime, stop=BBupper,comment="RSI_BB_S")
    else
        strategy.cancel(id="RSI_BB_S")

//plot(strategy.equity, title="equity", color=red, linewidth=2, style=areabr)