개요
이 전략은 EMA 평균선 차등과 MACD 지표에 기반한 복합 전략으로, BTC의 단선 거래에 사용된다. EMA 평균선과 MACD의 신호를 결합하여 특정 조건에서 구매 및 판매 신호를 생성한다.
전략 원칙
차이는 마이너스이며, 마이너스보다 작고, MACD가 공백으로 교차하면, 구매 신호를 발생시킨다. 차이는 긍정적이고, 마이너스보다 크면, MACD가 다중으로 교차하면, 판매 신호를 발생시킨다.
EMA 평균선 차치와 MACD 지표를 사용하는 신호를 조합하여, 일부 가짜 신호를 필터링하여 신호의 신뢰성을 향상시킬 수 있다.
우위 분석
- 복합 지표를 사용하여 신호가 더 안정적입니다.
- 단기 주기 변수를 사용하여 단선 거래에 적합합니다.
- 손해 방지 및 차단 설정으로 위험을 제어할 수 있습니다.
위험 분석
- 시장이 급격하게 변동할 때, 스톱로드는 깨질 수 있습니다.
- 다른 시장 환경에 맞게 최적화해야 할 요소
- 다른 코인들과 다른 거래소의 효과를 테스트해야 합니다.
최적화 방향
- EMA와 MACD의 매개 변수를 최적화하여 BTC의 변동 환경에 더 적합하게 만듭니다
- 포지션 개설 및 포지션 감축 전략을 늘리고, 자금 사용 효율을 최적화
- 이동 상쇄, 진동 상쇄와 같은 상쇄 방법을 추가하여 위험을 줄이십시오.
- 다른 거래소와 다른 화폐의 효과를 테스트하는 것
요약하다
이 전략은 평균선과 MACD 두 지표의 장점을 통합하여 복합 신호를 사용하여 거짓 신호를 효과적으로 필터링 할 수 있습니다. 최적화 매개 변수와 포지션 개설 전략을 통해 안정적인 수익을 얻을 수 있습니다. 그러나 또한 스톱 손실이 침범 될 위험에 대해 경계해야하며 추가 테스트 및 개선이 필요합니다.
전략 소스 코드
/*backtest
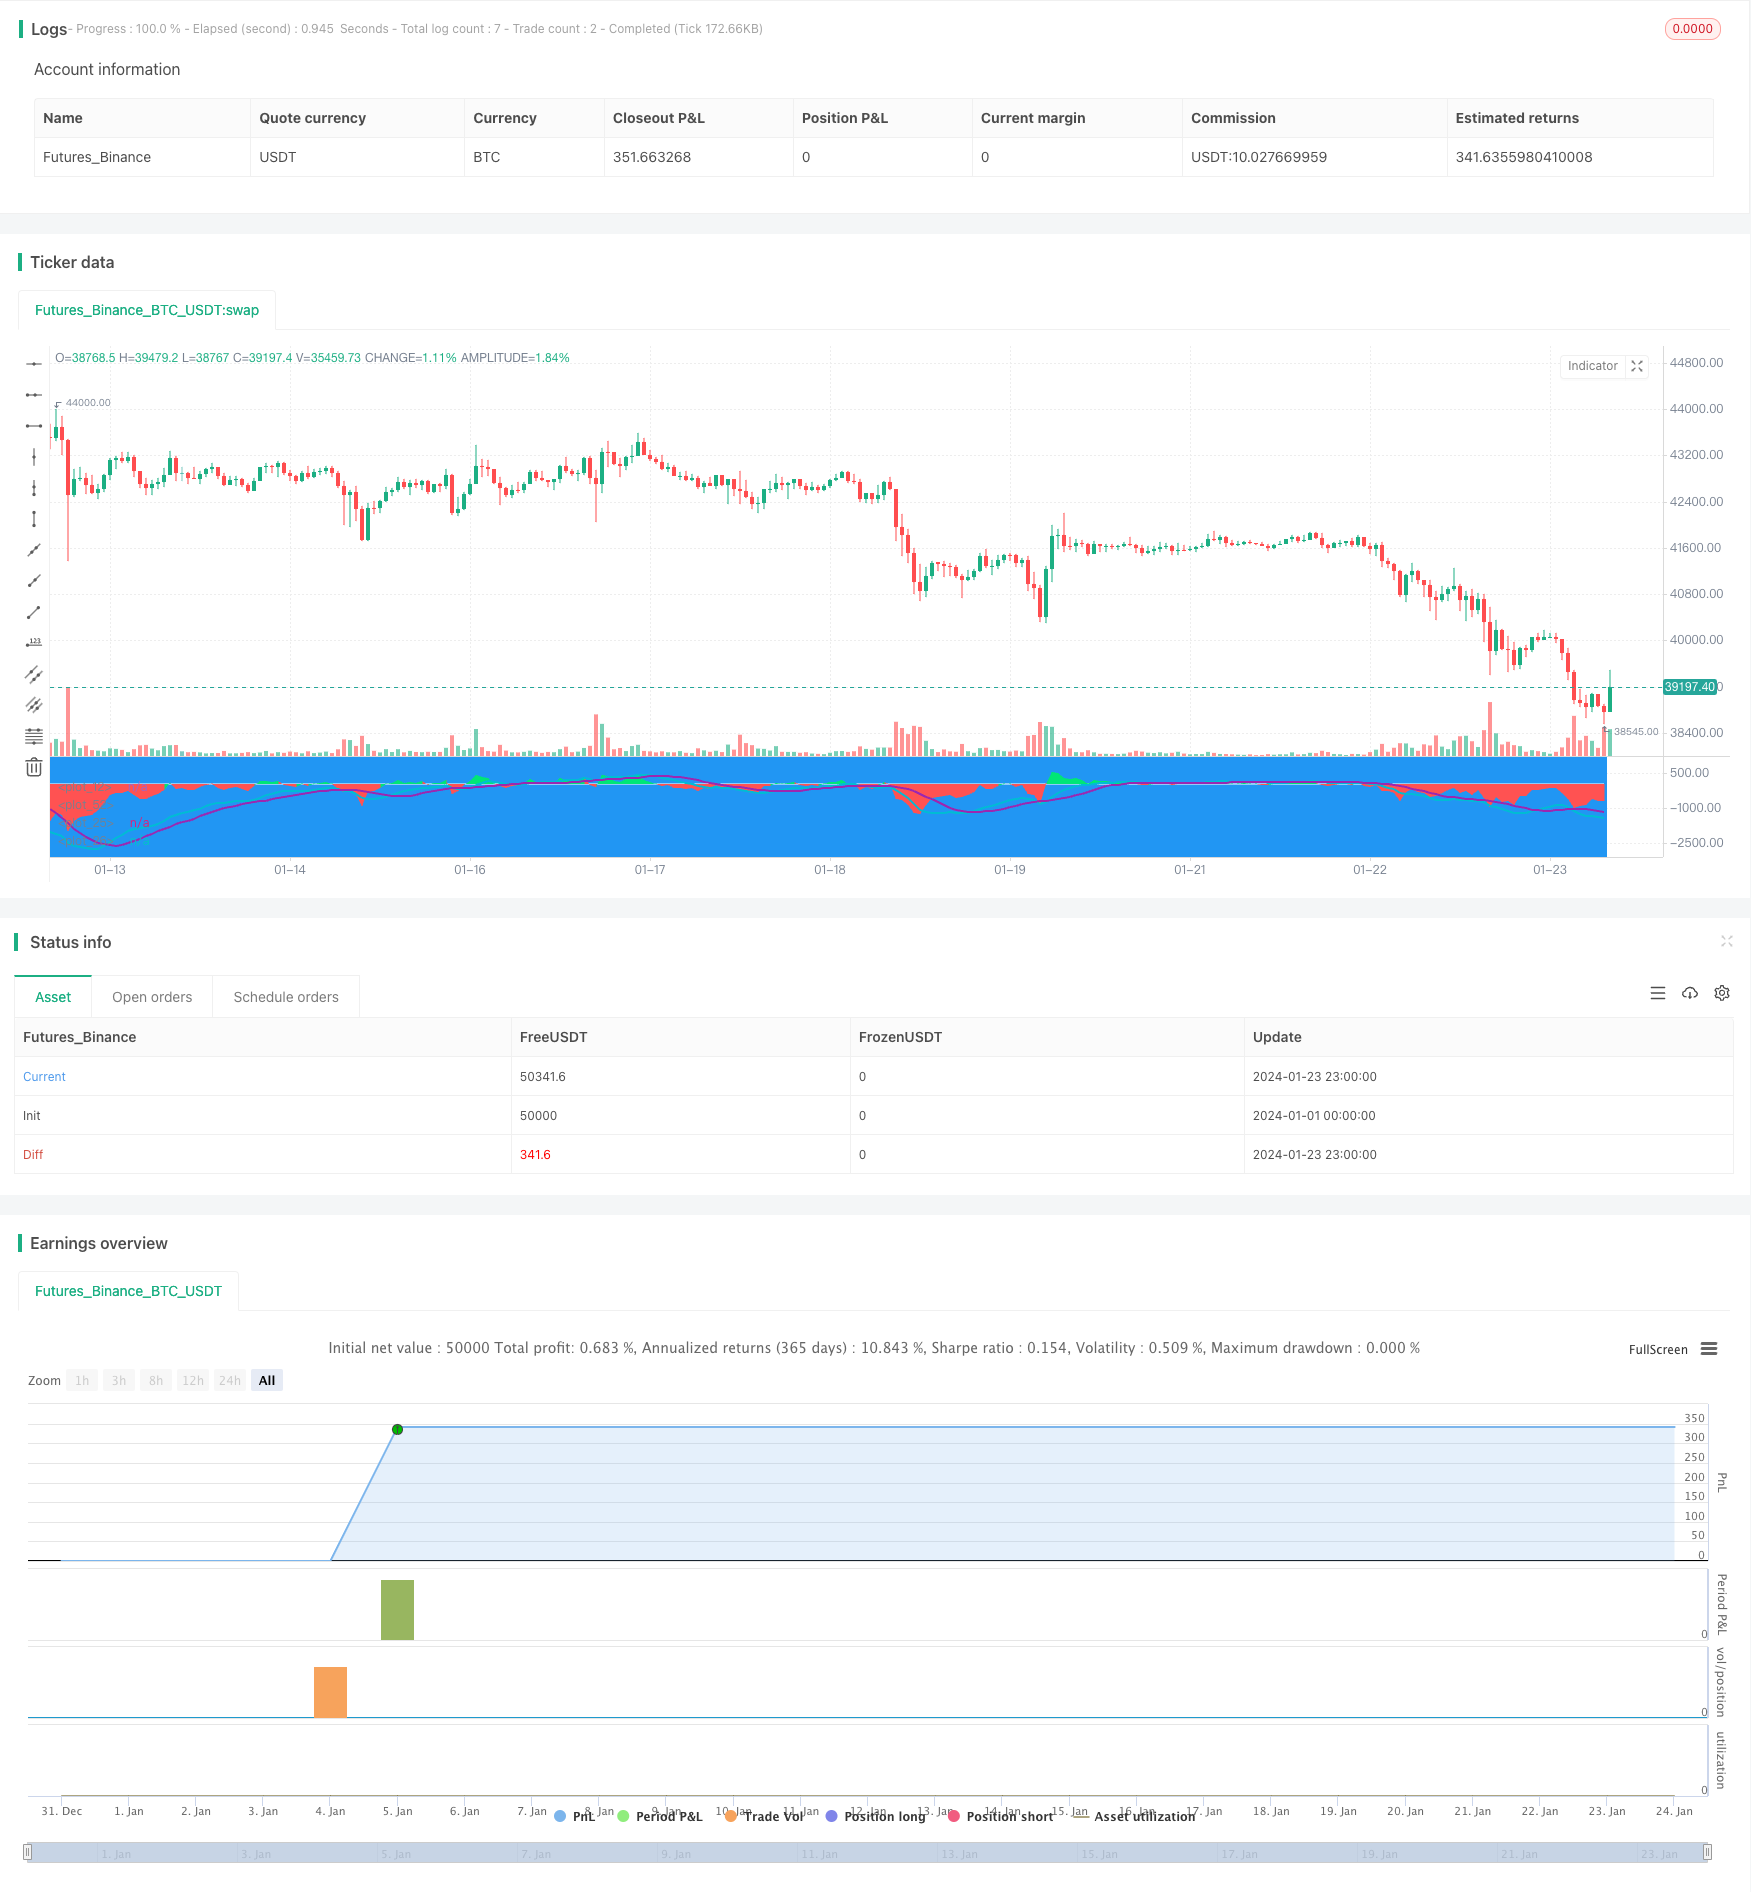
start: 2024-01-01 00:00:00
end: 2024-01-24 00:00:00
period: 1h
basePeriod: 15m
exchanges: [{"eid":"Futures_Binance","currency":"BTC_USDT"}]
*/
//@version=3
strategy("EMA50Diff & MACD Strategy", overlay=false)
EMA = input(18, step=1)
MACDfast = input(12)
MACDslow = input(26)
EMADiffThreshold = input(8)
MACDThreshold = input(80)
TargetValidityThreshold = input(65, step=5)
Target = input(120, step=5)
StopLoss = input(650, step=5)
ema = ema(close, EMA)
hl = plot(0, color=white, linewidth=1)
diff = close - ema
clr = color(blue, transp=100)
if diff>0
clr := lime
else
if diff<0
clr := red
fastMA = ema(close, MACDfast)
slowMA = ema(close, MACDslow)
macd = (fastMA - slowMA)*3
signal = sma(macd, 9)
plot(macd, color=aqua, linewidth=2)
plot(signal, color=purple, linewidth=2)
macdlong = macd<-MACDThreshold and signal<-MACDThreshold and crossover(macd, signal)
macdshort = macd>MACDThreshold and signal>MACDThreshold and crossunder(macd, signal)
position = 0.0
position := nz(strategy.position_size, 0.0)
long = (position < 0 and close < strategy.position_avg_price - TargetValidityThreshold and macdlong) or
(position == 0.0 and diff < -EMADiffThreshold and diff > diff[1] and diff[1] < diff[2] and macdlong)
short = (position > 0 and close > strategy.position_avg_price + TargetValidityThreshold and macdshort) or
(position == 0.0 and diff > EMADiffThreshold and diff < diff[1] and diff[1] > diff[2] and macdshort)
amount = (strategy.equity / close) //- ((strategy.equity / close / 10)%10)
bgclr = color(blue, transp=100) //#0c0c0c
if long
strategy.entry("long", strategy.long, amount)
bgclr := green
if short
strategy.entry("short", strategy.short, amount)
bgclr := maroon
bgcolor(bgclr, transp=20)
strategy.close("long", when=close>strategy.position_avg_price + Target)
strategy.close("short", when=close<strategy.position_avg_price - Target)
strategy.exit("STOPLOSS", "long", stop=strategy.position_avg_price - StopLoss)
strategy.exit("STOPLOSS", "short", stop=strategy.position_avg_price + StopLoss)
//plotshape(long, style=shape.labelup, location=location.bottom, color=green)
//plotshape(short, style=shape.labeldown, location=location.top, color=red)
pl = plot(diff, style=histogram, color=clr)
fill(hl, pl, color=clr)