모멘텀 완화 지표와 123 패턴 전략


생성 날짜: 2024-01-25 14:27:29 마지막으로 수정됨: 2024-01-25 14:27:29
복사: 0 클릭수: 713
avatar of ChaoZhang ChaoZhang
1
집중하다
1617
수행원

모멘텀 완화 지표와 123 패턴 전략

개요

이 전략은 동적 팽창 지표와 123 형태 두 가지 전략을 결합하여 통합 거래 신호를 형성하여 수익률을 높인다. 이 중 동적 팽창 지표는 시장의 변동성을 추적하고, 단기 경향을 잡기 위해 RSI 파라미터를 조정한다. 123 형태는 주식의 단기 기간 동안의 최고점, 저점으로 거래 신호를 형성한다. 두 가지 전략의 조합은 전략이 다른 시장 환경에서 거래 효과를 유지할 수 있도록 한다.

전략 원칙

123 형태

123 형태는 세 단계로 나뉘어져 있는데, 첫 번째 단계의 주가가 2 일 연속으로 하락한 다음 두 번째 단계의 주가가 2 일 연속으로 상승한 다음 마지막 세 번째 단계의 주가가 다시 하락했다. 이 형태에 따라 우리는 두 번째 단계의 주가가 상승할 때 다단위 포지션을 구축할 수 있고, 세 번째 단계의 주가가 하락할 때 공백 포지션을 구축할 수 있다고 판단할 수 있다.

구체적으로 말해서, 2일 연속으로 하락한 후, 3일 종료 시점이 전날 종료 시점보다 높고, 9일 스토카스틱 슬로우가 50보다 낮으면 구매 신호로; 2일 연속으로 상승한 후, 3일 종료 시점이 전날 종료 시점보다 낮고, 9일 스토카스틱 패스트가 50보다 높으면 판매 신호로.

동력 팽창 지표

동력 팽창 지표의 구성 과정은 RSI와 거의 동일하지만, 주요 차이점은 동력 팽창 지표의 주기 길이가 변동된다는 것입니다. 구체적으로, 지표의 주기 길이는 최근의 가격 변동률에 영향을 받습니다. 가격 변동이 클수록 주기는 짧아 지표가 더 민감하게됩니다. 가격이 안정되면, 오류를 줄이기 위해 주기는 길어집니다.

동력 張 지수의 계산 공식은:

DMI = RSI(DTime)

其中:
DTime = 14 / X日收盘价标准差的10日均值

이 지표는 RSI의 정의 범위와 동일하며, 빈 영역은 다음과 같습니다.

다중 머리 영역: DMI > 30 빈 머리 영역: DMI < 70

지표가 공허 영역에서 다목적 영역으로 들어가면 구매 신호가 발생하고, 다목적 영역에서 공허 영역으로 들어가면 판매 신호가 발생한다.

우위 분석

  1. 123 형태는 간단하고 효과적입니다. 이 형태는 주가 가격의 단기 역전 특성을 활용하여 하위 하위에서 구매하고 상위 하위에서 판매하며, 트렌드 중간에 거래하는 것을 피합니다.

  2. 동량 장 지수는 더 민감하다. 지표의 변동 속도의 특성으로 시장에 적응할 수 있고, 급격한 변동 속에서 전환점을 적시에 잡을 수 있다.

  3. 두 가지 전략은 잘못된 보도를 효과적으로 필터링 할 수 있습니다. 123 형태가 신호를 생성 할 때 DMI를 참조하여 시장 배경을 판단하여 추세에서 거래되는 손실을 줄일 수 있습니다.

  4. 두 가지 전략의 장점을 활용하는 DMI는 필터로 사용하기에 적합하며, 123 형태와 결합하면 시스템 안정성을 크게 향상시킬 수 있다.

위험 분석

  1. 신호 오류가 발생할 수 있다. DMI와 123 형식 모두 가격이 단지 단기 변동일 때 잘못된 신호를 일으킬 수 있다.

  2. 거래 주파수가 너무 높을 수 있다. DMI의 변주기 특성은 시장 소음에 매우 민감하게 만들어 거래 주파수를 제어하기 위해 적절한 매개 변수를 조정해야 한다.

  3. 123 형태는 트렌드 중간 기회를 놓칠 수 있다. 이 형태는 주로 단기 반전을 포착하여 중·장기 선에서 지속적인 이익을 얻을 수 없다.

  4. 거래 횟수를 적절히 제한해야 합니다. 거래 횟수가 너무 많으면 높은 수수료와 슬라이드 포인트 비용이 발생합니다.

최적화 방향

  1. 동력张 지수 파라미터를 최적화한다. 다양한 DMI의 RSI 파라미터를 테스트하고 거래 범위 파라미터를 사용하여 최적의 파라미트 조합을 찾을 수 있다.

  2. 123 형태 필터링 조건을 최적화한다. 스토흐 지표의 다른 매개 변수 또는 MACD와 같은 다른 필터링 지표를 테스트할 수 있다.

  3. 손해 제도를 늘리십시오. 적절한 수축 손해 제도는 단독 손실을 줄일 수 있습니다.

  4. 위치 관리 모듈을 추가한다. 고정량 거래, 고정자금 활용률 거래 등이 전략적 위험 관리를 개선한다.

요약하다

이 전략은 동력张 지수와 123 형태를 결합하여 두 가지 각도에서 시장을 판단하여 거래 신호의 효과를 높이기 위해 고안되었습니다. 그러나 어떤 단일 전략도 시장의 변화에 완벽하게 적응 할 수 없습니다. 투자자는 재검토 및 실장 결과에 따라 최적화 매개 변수를 지속적으로 조정하여 전략을 지속적으로 수익을 창출 할 수 있도록 사용 할 때 주의를 기울여야합니다.
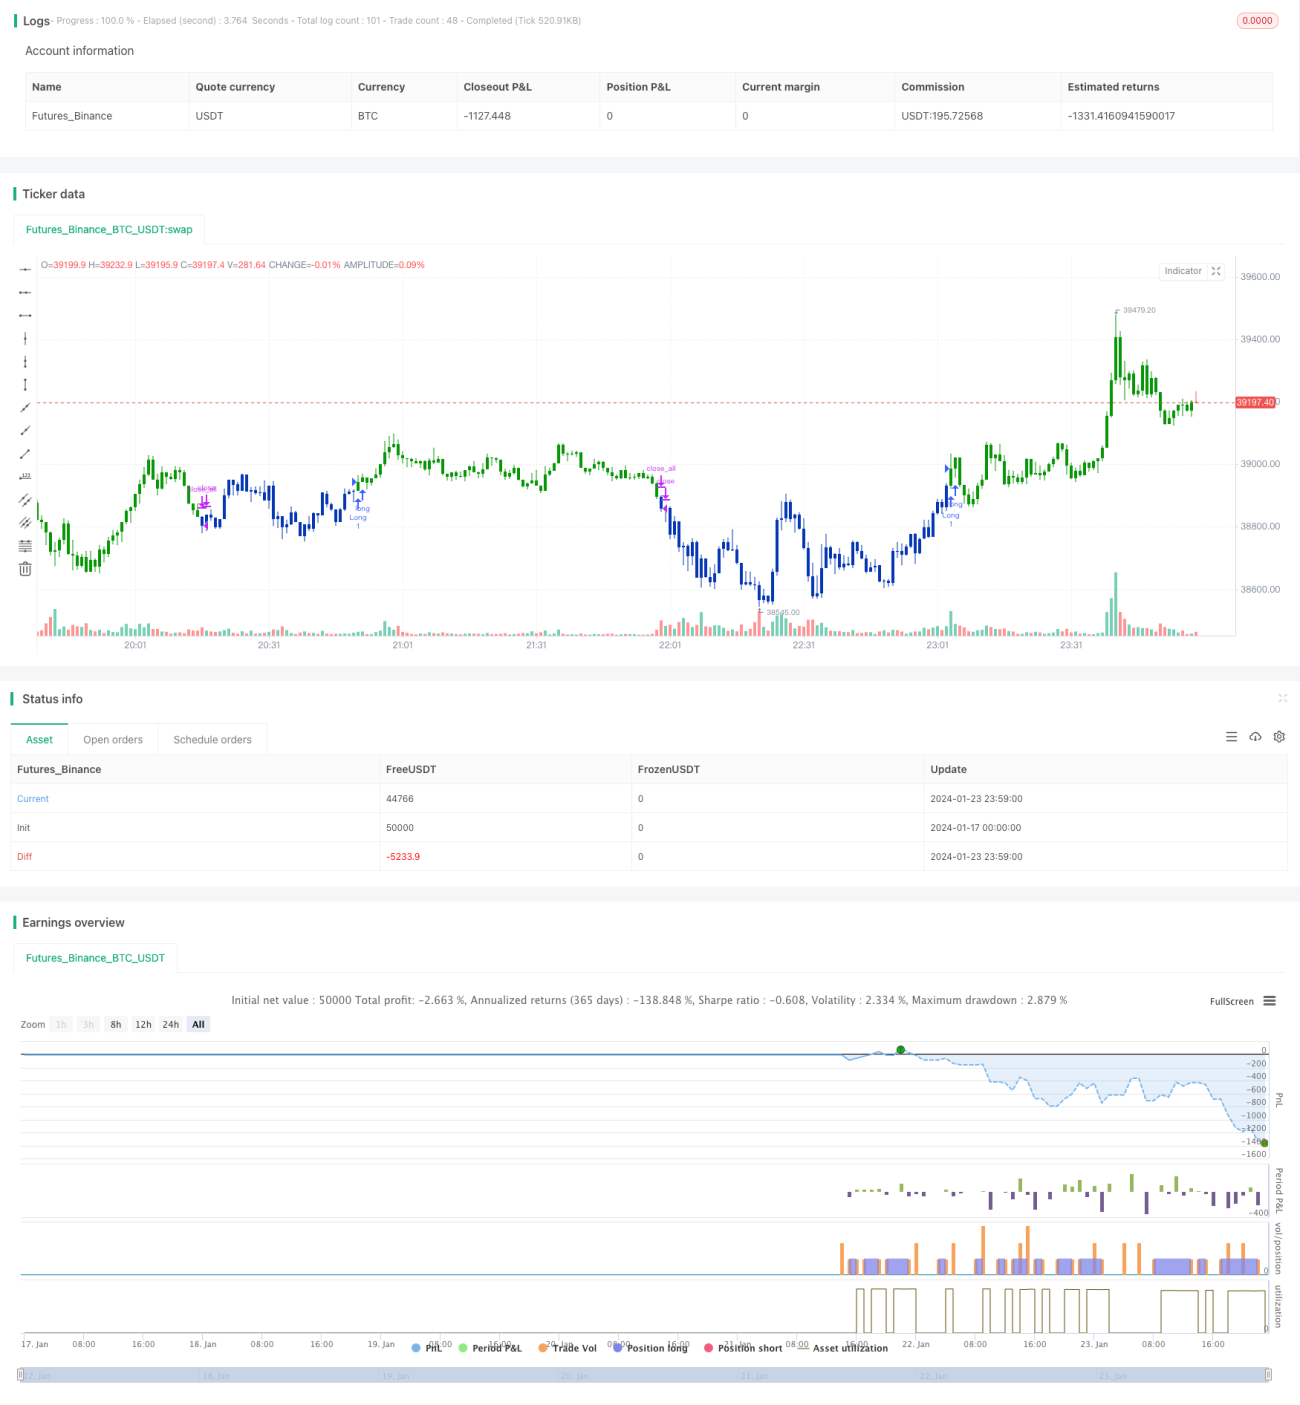
전략 소스 코드
/*backtest
start: 2024-01-17 00:00:00
end: 2024-01-24 00:00:00
period: 1m
basePeriod: 1m
exchanges: [{"eid":"Futures_Binance","currency":"BTC_USDT"}]
*/

//@version=4
////////////////////////////////////////////////////////////
//  Copyright by HPotter v1.0 18/03/2020
// This is combo strategies for get a cumulative signal. 
//
// First strategy
// This System was created from the Book "How I Tripled My Money In The 
// Futures Market" by Ulf Jensen, Page 183. This is reverse type of strategies.
// The strategy buys at market, if close price is higher than the previous close 
// during 2 days and the meaning of 9-days Stochastic Slow Oscillator is lower than 50. 
// The strategy sells at market, if close price is lower than the previous close price 
// during 2 days and the meaning of 9-days Stochastic Fast Oscillator is higher than 50.
//
// Second strategy
// This indicator plots Dynamic Momentum Index indicator. The Dynamic Momentum 
// Index (DMI) was developed by Tushar Chande and Stanley Kroll. The indicator 
// is covered in detail in their book The New Technical Trader.
// The DMI is identical to Welles Wilder`s Relative Strength Index except the 
// number of periods is variable rather than fixed. The variability of the time 
// periods used in the DMI is controlled by the recent volatility of prices. 
// The more volatile the prices, the more sensitive the DMI is to price changes. 
// In other words, the DMI will use more time periods during quiet markets, and 
// less during active markets. The maximum time periods the DMI can reach is 30 
// and the minimum is 3. This calculation method is similar to the Variable 
// Moving Average, also developed by Tushar Chande.
// The advantage of using a variable length time period when calculating the RSI 
// is that it overcomes the negative effects of smoothing, which often obscure short-term moves.
// The volatility index used in controlling the time periods in the DMI is based 
// on a calculation using a five period standard deviation and a ten period average 
// of the standard deviation.
//
// WARNING:
// - For purpose educate only
// - This script to change bars colors.
////////////////////////////////////////////////////////////
Reversal123(Length, KSmoothing, DLength, Level) =>
    vFast = sma(stoch(close, high, low, Length), KSmoothing) 
    vSlow = sma(vFast, DLength)
    pos = 0.0
    pos := iff(close[2] < close[1] and close > close[1] and vFast < vSlow and vFast > Level, 1,
	         iff(close[2] > close[1] and close < close[1] and vFast > vSlow and vFast < Level, -1, nz(pos[1], 0))) 
	pos

DMI(RSILen, BuyZone,SellZone,UpLimit,LoLimit) =>
    pos = 0
    xStdDev = stdev(close, 5) 
    xSMAStdDev = sma(xStdDev, 10)
    DTime = round(14 / xSMAStdDev - 0.5)
    xDMI = iff(DTime > UpLimit, UpLimit,
             iff(DTime < LoLimit, LoLimit, DTime))
    xRSI = rsi(xDMI, RSILen)
    pos := iff(xRSI > BuyZone, 1,
             iff(xRSI < SellZone, -1, nz(pos[1], 0))) 
    pos

strategy(title="Combo Backtest 123 Reversal & Dynamic Momentum Index", shorttitle="Combo", overlay = true)
Length = input(14, minval=1)
KSmoothing = input(1, minval=1)
DLength = input(3, minval=1)
Level = input(50, minval=1)
//-------------------------
RSILen = input(14, minval=1)
BuyZone = input(30, minval=1)
SellZone = input(70, minval=1)
UpLimit = input(30, minval=1)
LoLimit = input(5, minval=1)
reverse = input(false, title="Trade reverse")
posReversal123 = Reversal123(Length, KSmoothing, DLength, Level)
posDMI = DMI(RSILen, BuyZone,SellZone,UpLimit,LoLimit)
pos = iff(posReversal123 == 1 and posDMI == 1 , 1,
	   iff(posReversal123 == -1 and posDMI == -1, -1, 0)) 
possig = iff(reverse and pos == 1, -1,
          iff(reverse and pos == -1 , 1, pos))	   
if (possig == 1) 
    strategy.entry("Long", strategy.long)
if (possig == -1)
    strategy.entry("Short", strategy.short)	 
if (possig == 0) 
    strategy.close_all()
barcolor(possig == -1 ? #b50404: possig == 1 ? #079605 : #0536b3 )