개요
이 전략은 케빈 데이비의 무료 원유 선물 거래 전략에 기초한다. 이 전략은 ADX 지표를 사용하여 원유 시장의 추세를 판단하고, 가격 돌파 원칙과 결합하여 간단한 실용적인 원유 자동 거래 전략을 구현한다.
전략 원칙
- 14주기 ADX를 계산하는 방법
- ADX>10일 때, 동가가 유행이라고 생각함
- 65 K선 전의 종결값보다 종결값이 높다면, 가격의 돌파구를 나타냅니다.
- 65 K선 전의 종결값보다 종결값이 낮다면, 가격의 돌파구를 표시하고, 단위 포지션 신호로 사용된다.
- 입력 후 손해 중지 및 정지 설정
이 전략은 주로 ADX 지표 판단 트렌드에 의존하며, 트렌드 상황에서 고정된 주기적인 가격 돌파에 따라 거래 신호를 생성한다. 전체 전략 논리는 매우 간단하고 명확하다.
전략적 강점 분석
- 트렌드를 판단하기 위해 ADX를 사용해서 트렌드 기회를 놓치지 마세요.
- 고정 주기 가격 돌파가 신호를 생성하고, 재측정 효과가 더 좋다.
- 코드는 직관적이고 간결하며 이해하기 쉽고 수정하기 쉽습니다.
- 케빈 데이비 (Kevin Davey) 는 여러 해 동안 실험실 테스트를 통해 비 곡선 적합성을 확인했습니다.
전략적 위험 분석
- ADX는 주요 지표로, 변수 선택과 돌파 주기 선택에 민감하다
- 일정한 주기를 통과하는 것은 일부 기회를 놓칠 수 있습니다.
- 손해 차단 장치의 잘못된 설정으로 손실이 커질 수 있습니다.
- 실디 효과와 재측정 차이가 있을 가능성
전략 최적화 방향
- ADX 변수 및 브레이크 사이클을 최적화
- 지분 증가 동적 조정
- 재검토 결과와 실전 검증에 따라 계속 수정하고 개선하는 전략
- 기계 학습 및 딥 러닝 기술을 도입하여 전략적 최적화를 수행합니다.
요약하다
이 전략은 전반적으로 매우 실용적인 원유 거래 전략이다. ADX 지표를 사용하여 추세를 판단하는 것은 매우 합리적이며, 가격 돌파 원칙은 간단하고 효과적이며, 재검토 효과가 좋다. 또한 케빈 데이비의 공개 무료 전략으로서, 그것은 강한 실무 신뢰성을 가지고 있다. 전략에도 약간의 개선 공간이 있지만, 초보자 및 소액 거래자에게는 이 전략은 입문 및 실습에 매우 적합한 선택이다.
전략 소스 코드
/*backtest
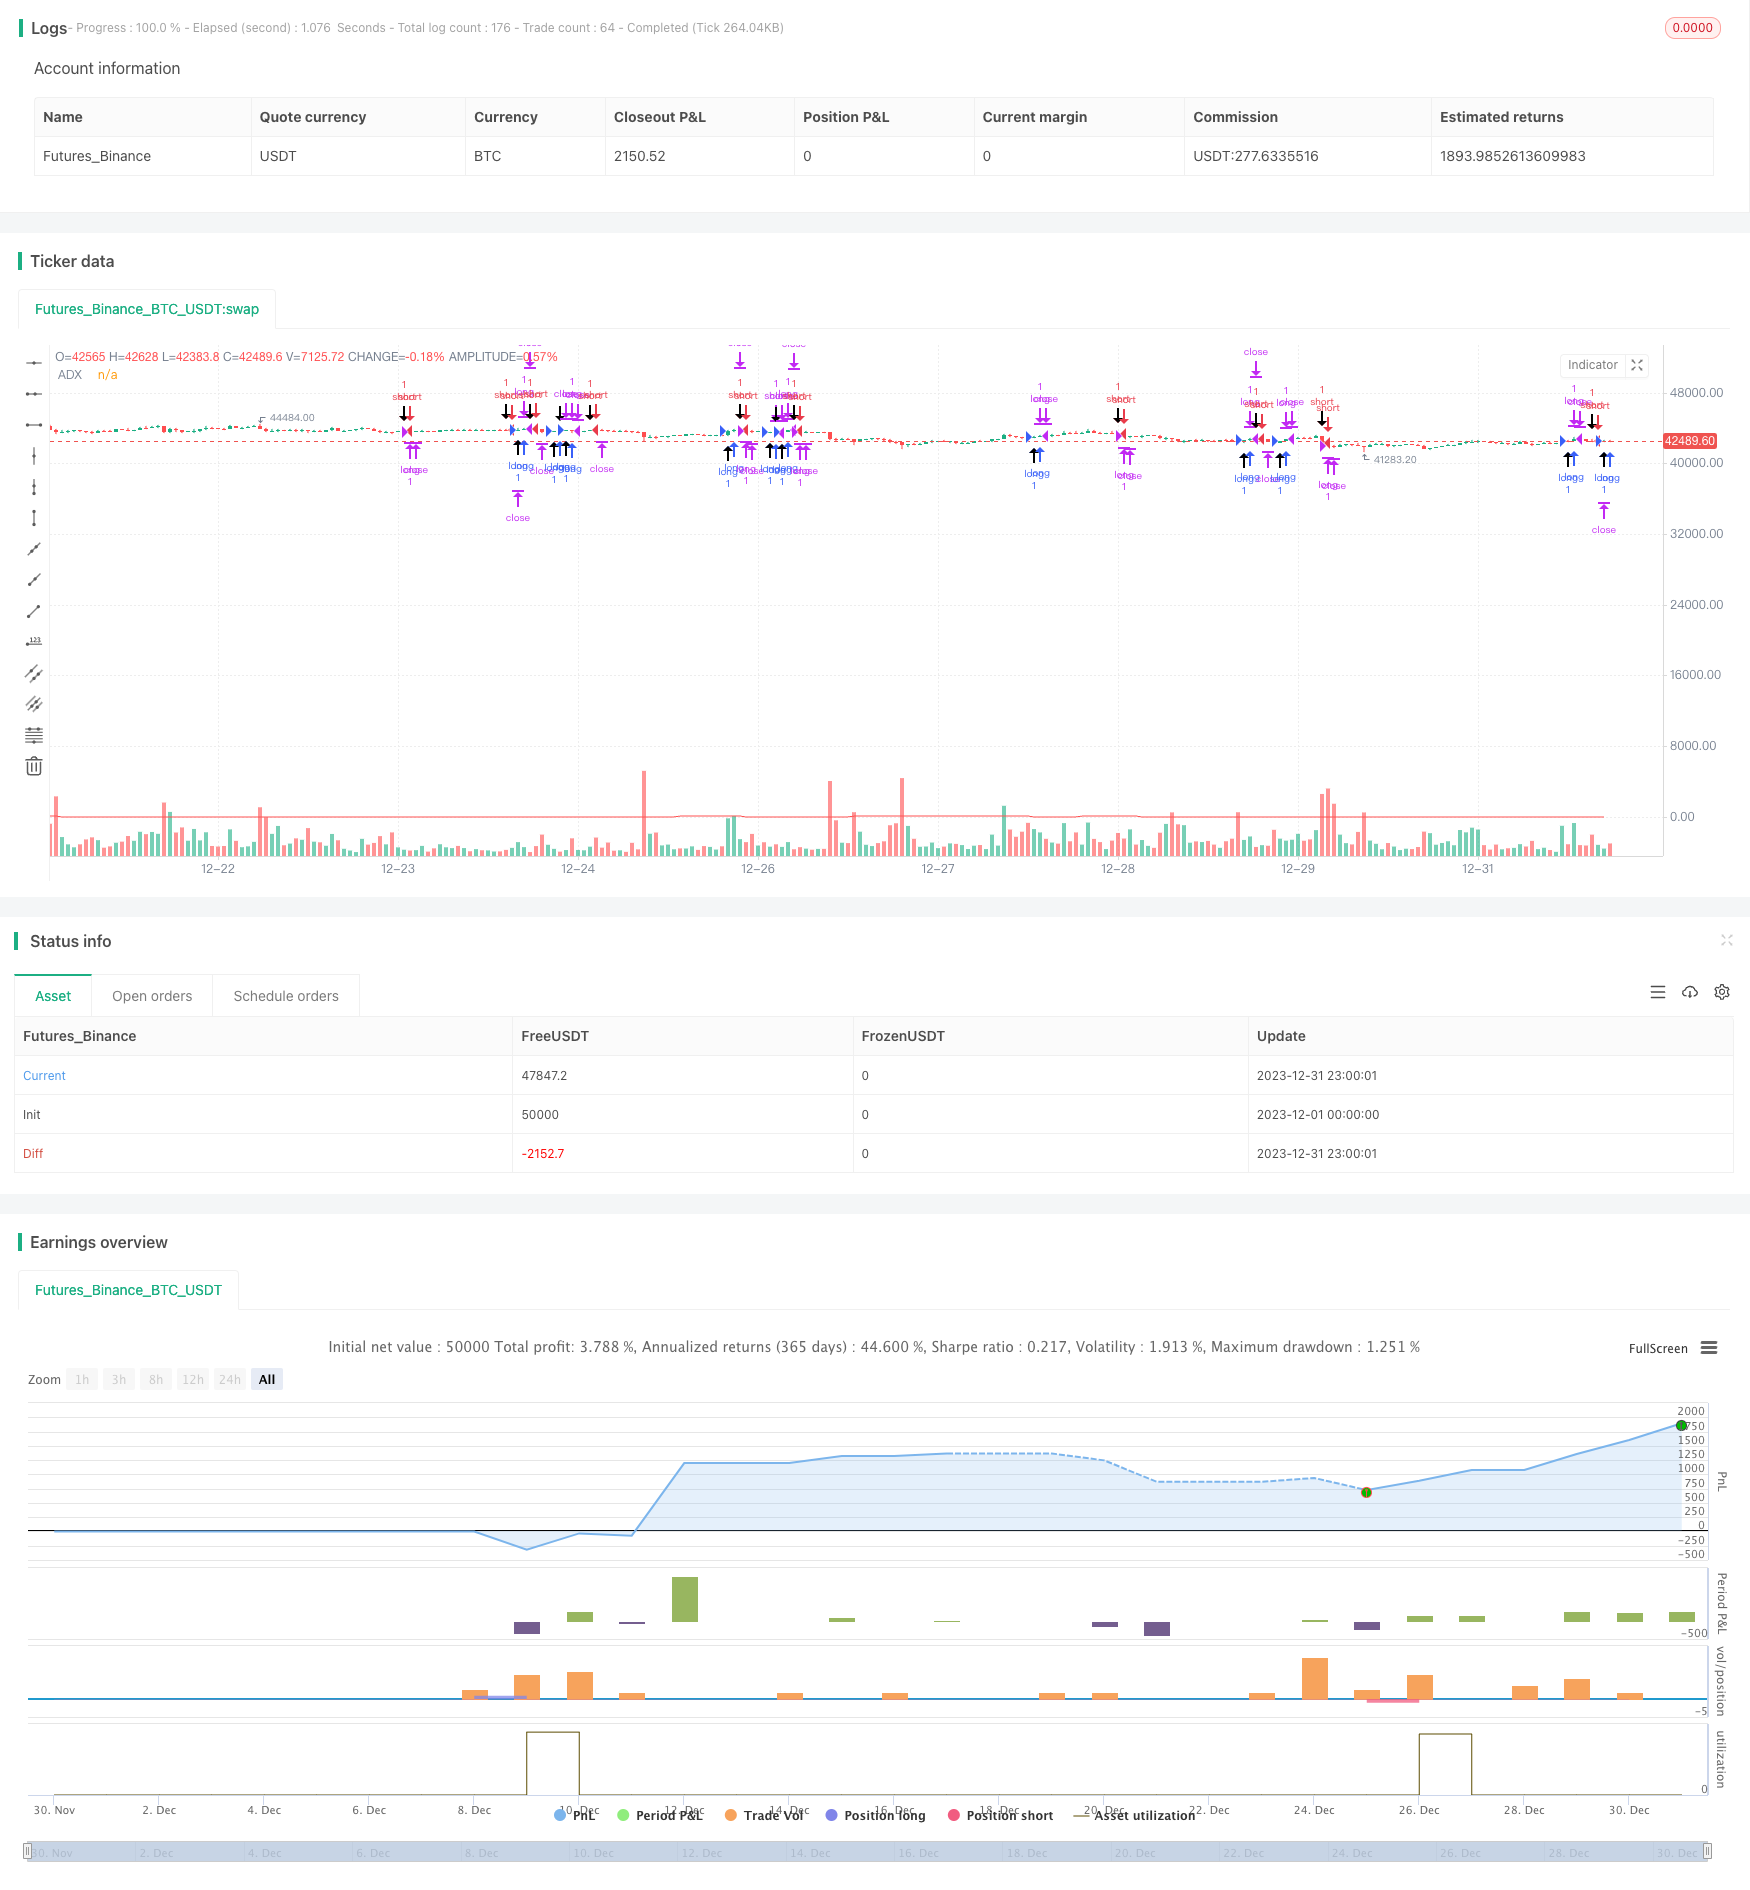
start: 2023-12-01 00:00:00
end: 2023-12-31 23:59:59
period: 1h
basePeriod: 15m
exchanges: [{"eid":"Futures_Binance","currency":"BTC_USDT"}]
*/
// Strategy idea coded from EasyLanguage to Pinescript
//@version=5
strategy("Kevin Davey Crude free crude oil strategy", shorttitle="CO Fut", format=format.price, precision=2, overlay = true, calc_on_every_tick = true)
adxlen = input(14, title="ADX Smoothing")
dilen = input(14, title="DI Length")
dirmov(len) =>
up = ta.change(high)
down = -ta.change(low)
plusDM = na(up) ? na : (up > down and up > 0 ? up : 0)
minusDM = na(down) ? na : (down > up and down > 0 ? down : 0)
truerange = ta.rma(ta.tr, len)
plus = fixnan(100 * ta.rma(plusDM, len) / truerange)
minus = fixnan(100 * ta.rma(minusDM, len) / truerange)
[plus, minus]
adx(dilen, adxlen) =>
[plus, minus] = dirmov(dilen)
sum = plus + minus
adx = 100 * ta.rma(math.abs(plus - minus) / (sum == 0 ? 1 : sum), adxlen)
sig = adx(dilen, adxlen)
plot(sig, color=color.red, title="ADX")
buy = sig > 10 and (close - close[65]) > 0 and (close - close[65])[1] < 0
sell = sig > 10 and (close - close[65]) < 0 and (close - close[65])[1] > 0
plotshape(buy, style = shape.arrowup, location = location.belowbar,size = size.huge)
plotshape(sell, style = shape.arrowdown, location = location.abovebar,size = size.huge)
if buy
strategy.entry("long", strategy.long)
if sell
strategy.entry("short", strategy.short)
if strategy.position_size != 0
strategy.exit("long", profit = 450, loss = 300)
strategy.exit("short", profit = 450, loss = 300)
// GetTickValue() returns the currency value of the instrument's
// smallest possible price movement.
GetTickValue() =>
syminfo.mintick * syminfo.pointvalue
// On the last historical bar, make a label to display the
// instrument's tick value
if barstate.islastconfirmedhistory
label.new(x=bar_index + 1, y=close, style=label.style_label_left,
color=color.black, textcolor=color.white, size=size.large,
text=syminfo.ticker + " has a tick value of:\n" +
syminfo.currency + " " + str.tostring(GetTickValue()))