개요
이중 지표 돌파 전략은 RSI 지표와 종결 가격 지표를 결합하여 낮은 가격과 높은 가격의 거래를 실현합니다. 이 전략은 간단하고 실용적이며, 철회 위험이 적으며, 중장선 지점을 보유하는 데 적합합니다.
전략 원칙
이 전략은 다음과 같은 두 가지 지표에 기초하여 판단됩니다.
- RSI 지표: RSI2가 15보다 작을 때, 더 많은 진입을 한다.
- 전날의 종식 가격: 오늘 종식 가격이 전날의 최고 가격보다 높을 때, 평점 위치가 출발한다.
진입 조건은 RSI 과매매, 주식이 고도로 과소평가되어 있고, 역전 가능성이 강하다는 것을 나타냅니다. 진출 조건은 종결 가격이 하루 전 최고 가격을 뚫고, 주식이 다목적 행태로 진입하고 있음을 나타내고, 적절히 멈춰야 한다.
우위 분석
이중 지수 돌파구 전략은 다음과 같은 장점을 가지고 있습니다.
- 전략은 간단하고 쉽게 실행할 수 있습니다.
- 이중 지표에 기반하여 가짜 신호를 효과적으로 제어할 수 있다.
- RSI 지표 파라미터를 최적화할 수 있는 공간이 넓고, 최적의 상태로 조정할 수 있다.
- 중·장기선 추세를 따라가며, 철회 위험은 낮다.
- 대중도 주식에 널리 적용되며 실전 효과도 좋다.
위험 분석
이 전략에는 몇 가지 위험도 있습니다.
- RSI 변수는 변동이 너무 많아서 조정해야 합니다.
- 다중일 경우 짧은 회전 회전이 예상됩니다.
- 하루 전 최고 가격 돌파는 합리성을 평가해야 합니다.
RSI 변수를 최적화하고, 시장 유형을 평가하고, 다른 지표 판단과 결합하여 위의 위험을 피할 수 있습니다.
최적화 방향
이 전략의 최적화 방향은 다음과 같은 부분들에 집중되어 있습니다.
- 다양한 주기에서 RSI 지표의 효과를 평가한다.
- 종결 가격과 다른 가격 지표의 조합을 테스트한다.
- 손해 방지 장치가 추가되었습니다. 예를 들어, 퇴장 후 잠시 다시 입단하는 것.
- 거래량 변화와 결합하여 입시 신호의 신뢰성을 평가한다.
- 기계 학습 알고리즘을 사용하여 자동 최적화 파라미터.
요약하다
이중 지표 돌파 전략은 전체적으로 매우 실용적인 양적 전략이다. 이 전략은 작동이 간단하고, 회수 위험이 적으며, 매개 변수 최적화와 규칙 개선을 통해 똑똑하고 안정적인 양적 절차가 될 수 있다. 효과적으로 착륙하면 우리에게 좋은 중장선 거래 기회를 제공할 수 있다.
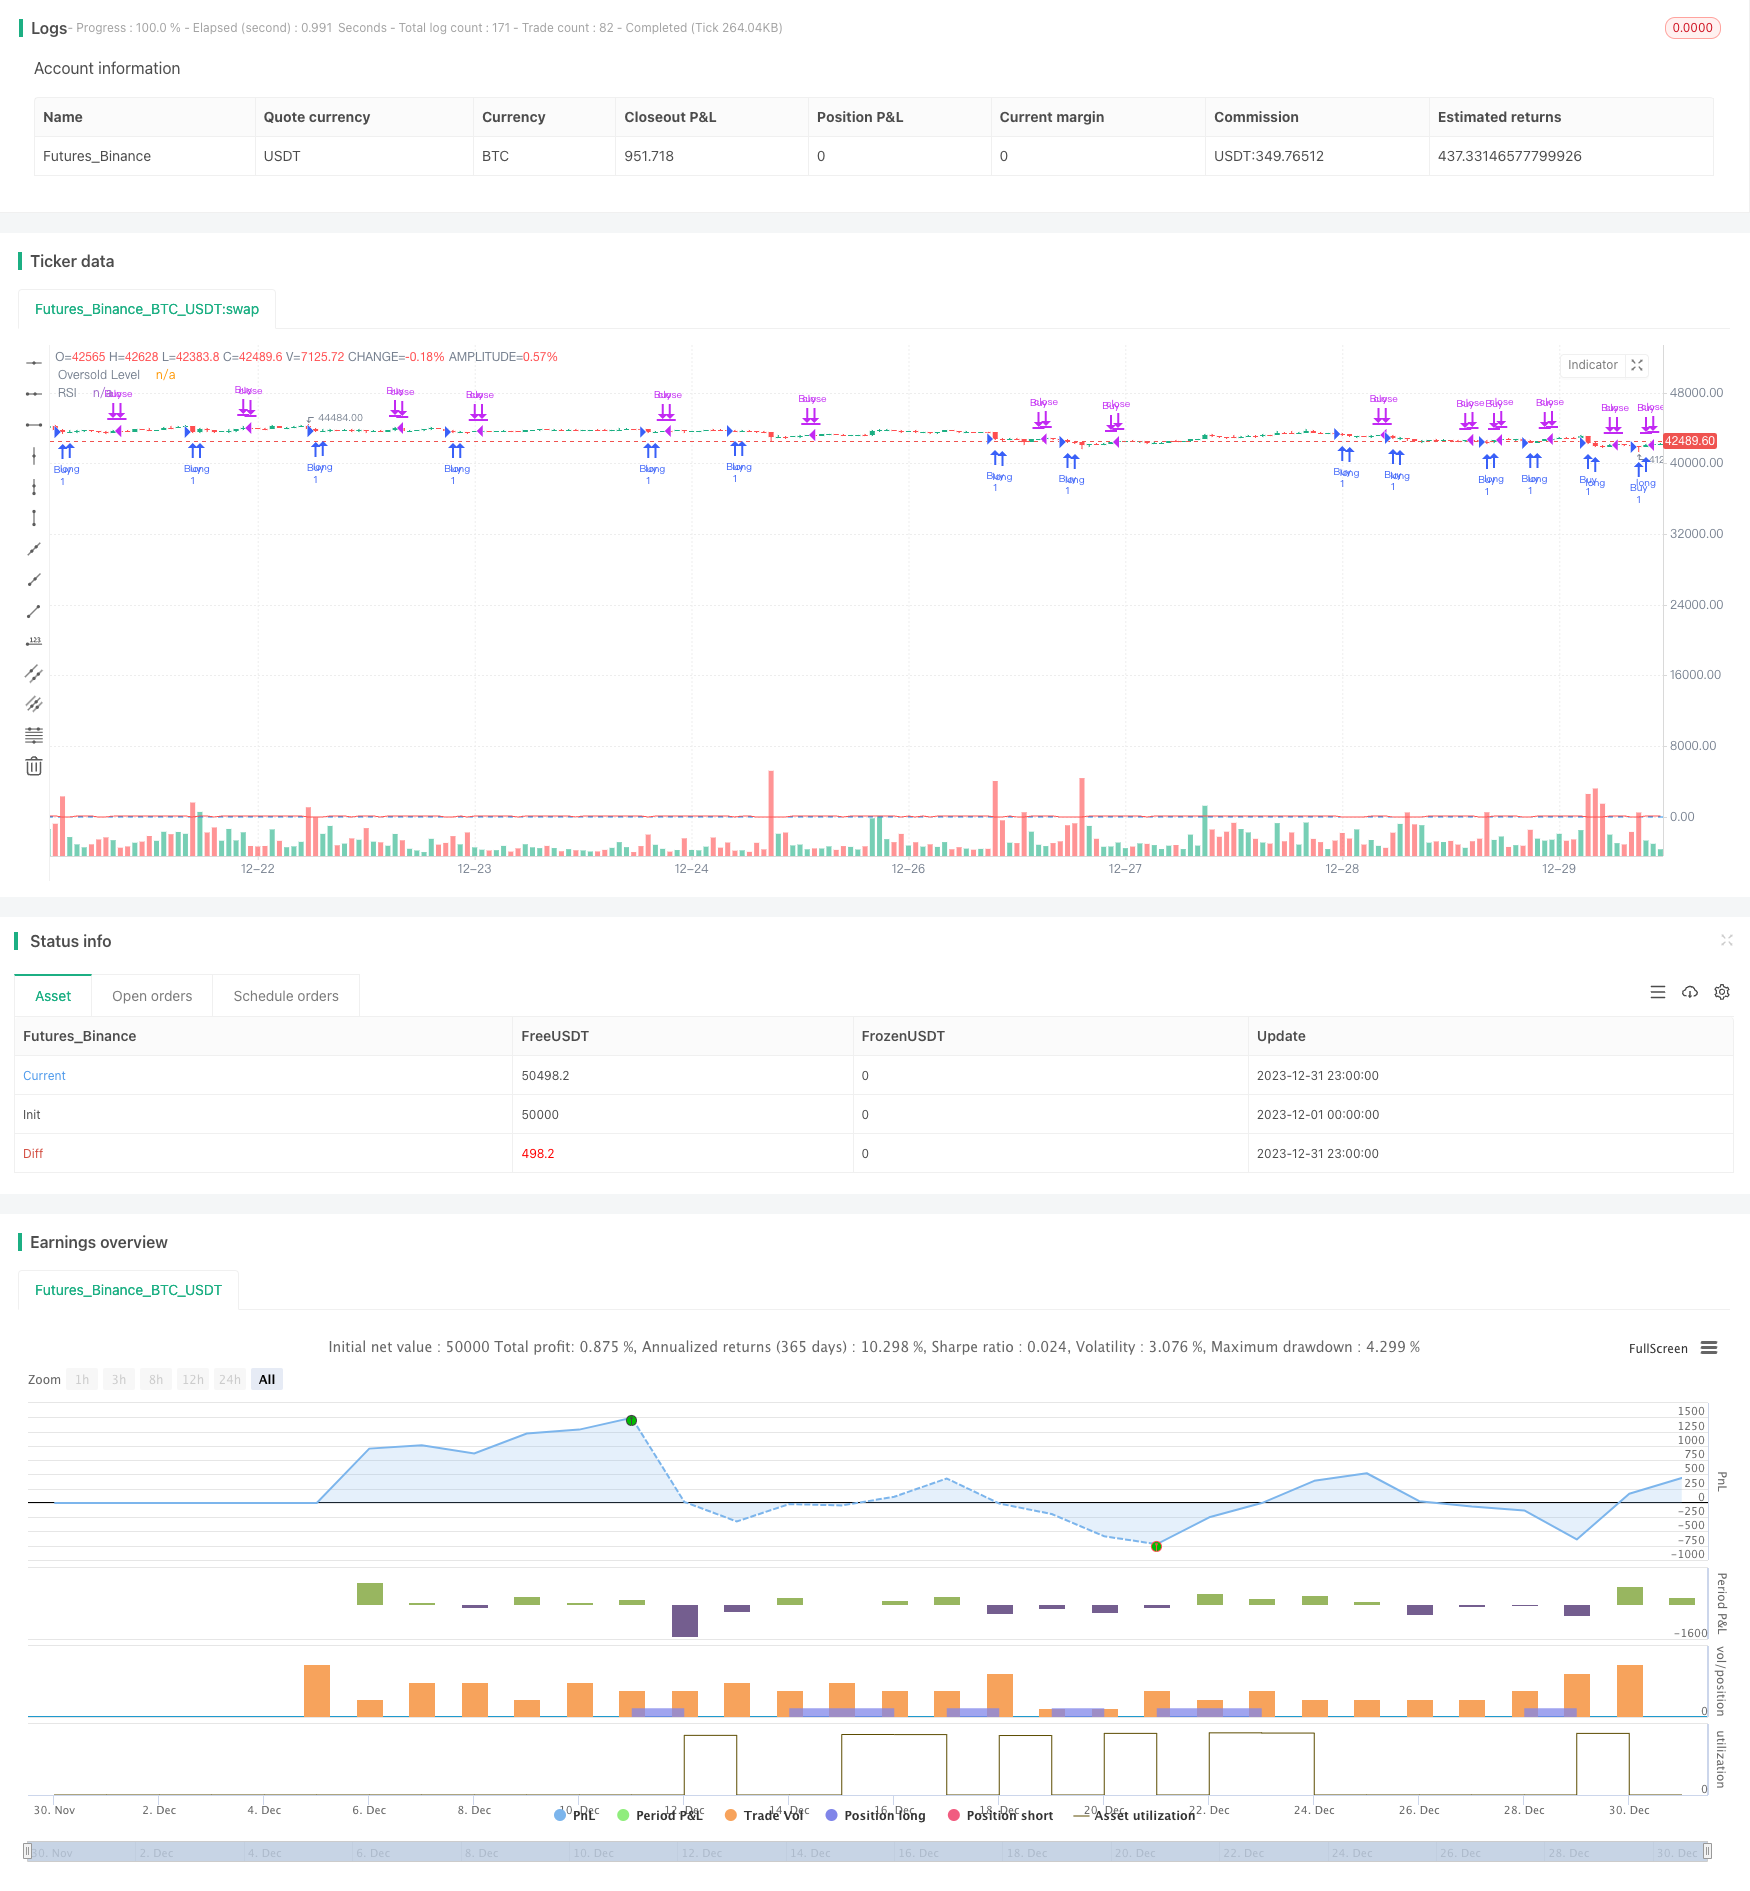
전략 소스 코드
/*backtest
start: 2023-12-01 00:00:00
end: 2023-12-31 23:59:59
period: 1h
basePeriod: 15m
exchanges: [{"eid":"Futures_Binance","currency":"BTC_USDT"}]
*/

// This source code is subject to the terms of the Mozilla Public License 2.0 at https://mozilla.org/MPL/2.0/
// © hobbiecode

// If RSI(2) is less than 15, then enter at the close.
// Exit on close if today’s close is higher than yesterday’s high.

//@version=5
strategy("Hobbiecode - RSI + Close previous day", overlay=true)

// RSI parameters
rsi_period = 2
rsi_lower = 15

// Calculate RSI
rsi_val = ta.rsi(close, rsi_period)

// Check if RSI is lower than the defined threshold
if (rsi_val < rsi_lower)
    strategy.entry("Buy", strategy.long)

// Check if today's close is higher than yesterday's high
if (strategy.position_size > 0 and close > ta.highest(high[1], 1))
    strategy.close("Buy")

// Plot RSI on chart
plot(rsi_val, title="RSI", color=color.red)
hline(rsi_lower, title="Oversold Level", color=color.blue)