개요
이 전략은 RSI, 무작위 지표의 교차 전략과 평점 미끄러지점 최적화 전략과 결합하여 거래 논리를 정확하게 제어하고 정확한 스톱로스를 구현합니다. 또한 신호 최적화를 도입함으로써 트렌드를 더 잘 제어하고 자금을 합리적으로 관리 할 수 있습니다.
전략 원칙
- RSI 지표는 오버 바이 오버 셀 영역을 판단하고, 랜덤 지표의 K값과 D값의 골드 포크 데드 포크가 거래 신호를 형성한다.
- K선에 대한 분류 식별을 도입하여 트렌드 신호를 판단하고, 잘못된 거래를 방지한다.
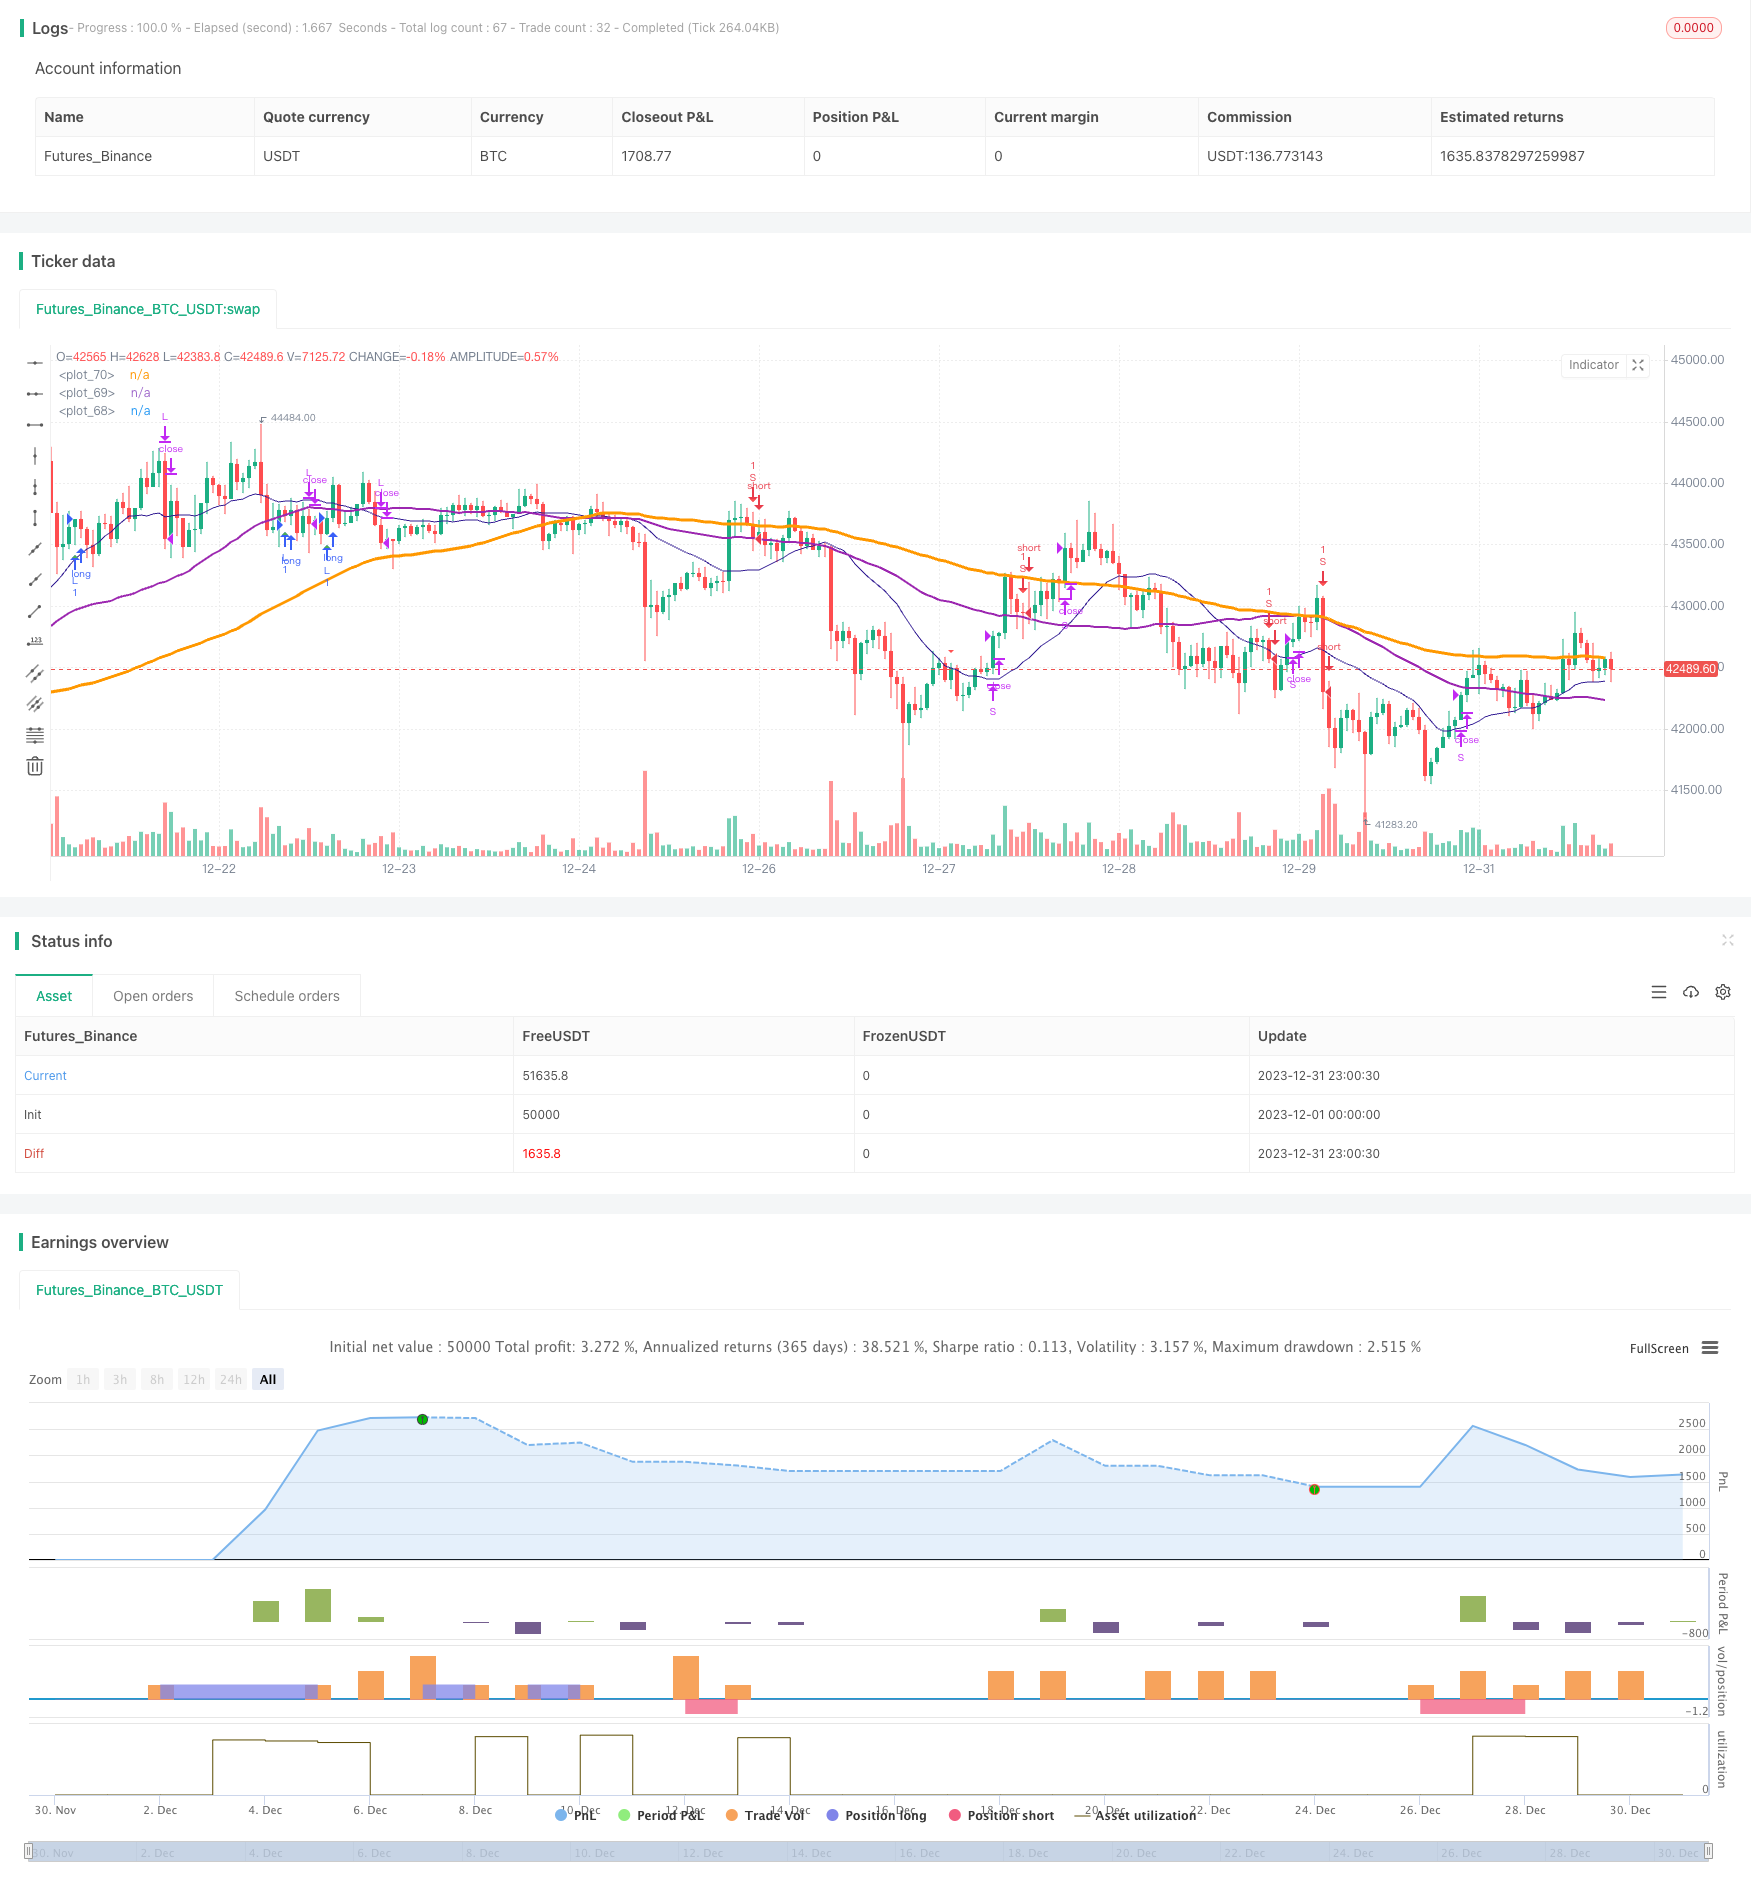
- SMA 평균선은 트렌드 방향을 결정하는데 보조한다. 단기 평균선은 아래에서 위로 장기 평균선을 돌파할 때 시선 신호이다.
- 평평한 위치 슬라이드 포인트 전략, 최고 가격과 최저 가격의 변동 범위에 따라 스톱 로스 스톱 가격을 설정한다.
우위 분석
- RSI 지수 변수 최적화, 오버 바이 오버 셀 영역을 잘 판단하여 잘못된 거래를 피합니다.
- STO 지표 매개 변수를 최적화하고, 부드러움 매개 변수를 조정하여 소음을 제거하고, 신호 품질을 향상시킵니다.
- Heikin-Ashi 기술 분석을 도입하여 K선 엔티티의 방향 변화를 식별하여 거래 신호의 정확성을 보장합니다.
- SMA 평균선은 큰 트렌드 방향을 판단하여 역동적인 거래를 피합니다.
- 스톱 스톱 슬라이드 포인트 전략과 결합하여 거래 당 수익을 최대화 할 수 있습니다.
위험 분석
- 대시장 하락이 지속되면 자금이 더 큰 위험에 처하게 됩니다.
- 거래 빈도가 너무 높아서 거래 비용과 슬라이드 포인트 비용이 증가할 수 있습니다.
- RSI 지표는 가짜 신호를 생성하기 쉽다. 다른 지표와 함께 필터링해야합니다.
전략 최적화
- RSI 변수를 조정하여 과매매 판단을 최적화합니다.
- STO 지표 매개 변수, 부드러움 및 주기를 조정하여 신호 품질을 향상시킵니다.
- 이동 평균 주기 조정, 트렌드 판단 최적화
- 더 많은 기술 지표를 도입하여 신호 판단의 정확성을 향상시킵니다.
- 단편 거래 위험을 줄이기 위해 스톱 스톱 비율을 최적화
요약하다
이 전략은 여러 주류 기술 지표의 장점을 통합하여, 매개 변수 최적화 및 규칙 개선을 통해 거래 신호 품질과 스톱 스톱 손실의 균형을 달성한다. 어느 정도의 보편성과 안정적인 수익성을 가지고 있다. 지속적인 최적화를 통해 승률과 수익률을 더욱 높일 수 있다.
전략 소스 코드
/*backtest
start: 2023-12-01 00:00:00
end: 2023-12-31 23:59:59
period: 1h
basePeriod: 15m
exchanges: [{"eid":"Futures_Binance","currency":"BTC_USDT"}]
*/

//@version=4
//study(title="@sentenzal strategy", shorttitle="@sentenzal strategy", overlay=true)
strategy(title="@sentenzal strategy", shorttitle="@sentenzal strategy", overlay=true  )
smoothK = input(3, minval=1)
smoothD = input(3, minval=1)
lengthRSI = input(14, minval=1)
lengthStoch = input(14, minval=1)
overbought = input(80, minval=1)
oversold = input(20, minval=1)
smaLengh = input(100, minval=1)
smaLengh2 = input(50, minval=1)
smaLengh3 = input(20, minval=1)

src = input(close, title="RSI Source")
testStartYear = input(2017, "Backtest Start Year")
testStartMonth = input(1, "Backtest Start Month")
testStartDay = input(1, "Backtest Start Day")
testPeriodStart = timestamp(testStartYear,testStartMonth,testStartDay,0,0)
testPeriod() =>
    time >= testPeriodStart ? true : false

rsi1 = rsi(src, lengthRSI)
k = sma(stoch(rsi1, rsi1, rsi1, lengthStoch), smoothK)
d = sma(k, smoothD)
crossBuy = crossover(k, d) and k < oversold
crossSell = crossunder(k, d) and k > overbought

dcLower = lowest(low, 10)
dcUpper = highest(high, 10)


heikinashi_close = security(heikinashi(syminfo.tickerid), timeframe.period, close)
heikinashi_open = security(heikinashi(syminfo.tickerid), timeframe.period, open)
heikinashi_low = security(heikinashi(syminfo.tickerid), timeframe.period, low)
heikinashi_high = security(heikinashi(syminfo.tickerid), timeframe.period, high)
heikinashiPositive = heikinashi_close >= heikinashi_open

heikinashiBuy = heikinashiPositive == true and heikinashiPositive[1] == false  and heikinashiPositive[2] == false
heikinashiSell = heikinashiPositive == false and heikinashiPositive[1] == true and heikinashiPositive[2] == true

//plotshape(heikinashiBuy, style=shape.arrowup, color=green, location=location.belowbar, size=size.tiny)
//plotshape(heikinashiSell, style=shape.arrowdown, color=red, location=location.abovebar, size=size.tiny)

buy = (crossBuy == true or crossBuy[1] == true or crossBuy[2] == true) and (heikinashiBuy == true or heikinashiBuy[1] == true or heikinashiBuy[2] == true)
sell = (crossSell == true or crossSell[1] == true or crossSell[2] == true) and (heikinashiSell == true or heikinashiSell[1] == true or heikinashiSell[2] == true)

mult = timeframe.period == '15' ? 4 : 1
mult2 = timeframe.period == '240' ? 0.25 : mult

movingAverage = sma(close, round(smaLengh))
movingAverage2 = sma(close, round(smaLengh2))
movingAverage3 = sma(close, round(smaLengh3))

uptrend = movingAverage < movingAverage2 and movingAverage2 < movingAverage3 and close > movingAverage
downtrend = movingAverage > movingAverage2 and movingAverage2 > movingAverage3 and close < movingAverage

signalBuy = (buy[1] == false and buy[2] == false and buy == true) and uptrend
signalSell = (sell[1] == false and sell[2] == false and sell == true) and downtrend

takeProfitSell = (buy[1] == false and buy[2] == false and buy == true) and uptrend == false
takeProfitBuy = (sell[1] == false and sell[2] == false and sell == true)  and uptrend

plotshape(signalBuy, style=shape.triangleup, color=green, location=location.belowbar, size=size.tiny)
plotshape(signalSell, style=shape.triangledown, color=red, location=location.abovebar, size=size.tiny)


plot(movingAverage, linewidth=3, color=orange, transp=0)
plot(movingAverage2, linewidth=2, color=purple, transp=0)
plot(movingAverage3, linewidth=1, color=navy, transp=0)

alertcondition(signalBuy, title='Signal Buy', message='Signal Buy')
alertcondition(signalSell, title='Signal Sell', message='Signal Sell')


strategy.close("L", when=dcLower[1] > low)
strategy.close("S", when=dcUpper[1] < high)

strategy.entry("L", strategy.long, 1, when = signalBuy and testPeriod() and uptrend)
strategy.entry("S", strategy.short, 1, when = signalSell and testPeriod() and uptrend ==false)

//strategy.exit("Exit Long", from_entry = "L", loss = 25000000, profit=25000000)
//strategy.exit("Exit Short", from_entry = "S", loss = 25000000, profit=25000000)